
Finances of Non-Government Non-Financial Large Public Limited Companies: 2011-12 - आरबीआय - Reserve Bank of India


Finances of Non-Government Non-Financial Large Public Limited Companies: 2011-12
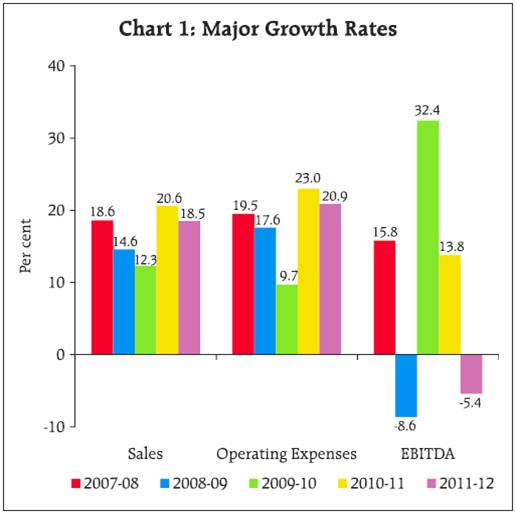
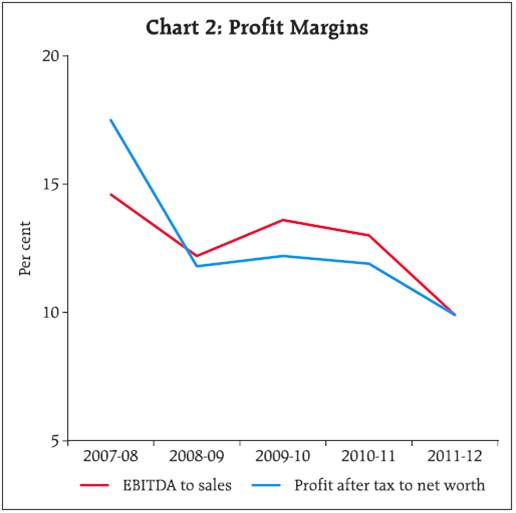
Finances of Non-Government Non-Financial Large Public Limited Companies, 2011-12* The aggregate results of the select non-government nonfinancial large public limited companies in 2011-12 revealed moderation in growth rates of major parameters as compared with those in 2010-11. Continued relatively higher growth in operating expenses than in sales together with lower addition to stock in 2011-12 resulted in decline in profits like earnings before interest, tax, depreciation and amortisation (EBITDA) and net profits (PAT) and moderation in profits margins as compared to 2010-11. Fall in profits led to decline in gross saving also. Borrowings grew at same pace in 2011-12 as in the previous year. Growth in net worth has been the lowest in last five years and debt to equity ratio increased in 2011-12 reversing a declining trend since 2007-08. Significant fall in capital work-in-progress was observed with corresponding increase in acquisition of plant and machineries during the year 2011-12. However, increase in investments in fixed assets formation was minimal in 2011-12. This article presents the financial performance of select 1,843 non-government non-financial (NGNF) large1 public limited companies for the financial year 2011-12 based on their audited annual accounts closed during April 2011 to March 20122 and draws a comparative picture over the five year period from 2007-08 to 2011-12, based on the previous studies on public limited companies published earlier. The detailed data for 2011-12 along with explanatory notes have been made available in the website of the Reserve Bank. The select 1,843 companies covered in the latest data release accounted for 23.3 per cent of population paid-up capital (PUC) (provisional estimate supplied by Ministry of Corporate Affairs, Government of India) of all NGNF public limited companies as on March 31, 2012. The coverage of companies for earlier years were slightly different. 1. Growth in sales moderated and profits declined 1.1 Demand conditions weakened during 2011-12 as reflected in lower sales growth (18. 5 per cent) as compared with 2010-11 (Statement 1 and Chart 1). Also, addition to stock was of lower order. However, operating expenses continued to grow at a relatively higher rate, resulting in decline in operating profits i.e., EBITDA. With interest expenses also maintaining high growth, net profits (PAT) declined more sharply in 2011-12. After the sharp rebound in growth of EBITDA in 2009-10, mainly boosted by the lowest growth in employee remuneration, the growth in EBITDA fell by 18.6 percentage points in 2010-11 and turned negative in 2011-12 (-5.4 per cent). 1.2 Disaggregated as per size of sales, companies in all size groups recorded lower sales growth in 2011-12, while those in the smallest size class i.e., with sales ‘less than `1 billion’ each, recorded a decline in sales. Decline in EBITDA was also sharper in the smaller size classes. 1.3 At the sectoral level, moderation in sales growth was sharper in the services sector but it recorded much smaller decline in EBITDA in 2011- 12, as their operating expenses were contained. Performance of ‘transportation’ and ‘real estate’ industries was most adversely affected, both in terms of sales and EBITDA. 1.4 In the manufacturing sector, ‘cement and cement products’ and ‘iron and steel’ industries reversed the recent trend and registered robust sales growth in 2011-12. On the other hand, sales growth in ‘textiles’ and ‘motor vehicles and other transport equipments’ industries moderated considerably. In terms of EBITDA, ‘food products and beverages’, ‘cement and cement products’ and ’electrical machinery and apparatus’ industries recorded higher growth on a lower base of the previous year. 2. Profit Margin remained under pressure 2.1 Profit margin of Indian corporates peaked in 2007-08. In the next 3 years upto 2010-11, the margin was lower but they moved in a narrow range (Chart 2). During 2011-12 the margin compressed sharply as the corporates could not hold on to their pricing power in the face of weakening demand (Box 1). Box 1: Reduced Pricing Power of Corporates Manufacturing expenses and staff cost (remuneration to employees and welfare expenses) are the major items of expenditure for companies. As percentage to sales, the share of these two items of expenditure has ranged between 71.3 per cent (2001-02) and 79.4 per cent (2011- 12) in the last twelve years. The EBITDA margin (EBITDA as percentage to sales) has been the highest at 16.0 per cent in 2007-08 and the lowest at 10.1 per cent in 2000- 01. During the period 2001-02 to 2004-05 the EBITDA margin has improved in spite of increase in the share of manufacturing expenses and staff cost. This could be indicative that during the high sales growth phase, the corporates had the ability to pass on the increase in cost to the customers. However, since 2005-06 these ratios have moved exactly in opposite directions. The EBITDA margin has increased (decreased) in case of a fall (rise) in share of manufacturing and staff cost. The steep increase in the share of these expenditures in 2010-11 and 2011-12 and the fall in EBITDA margin suggests reduced pricing power with the corporates as they could not pass on the increase in expenditure and protect the profit margin. 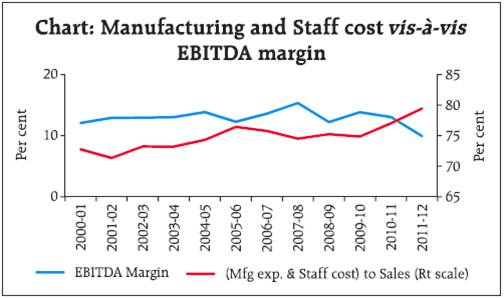
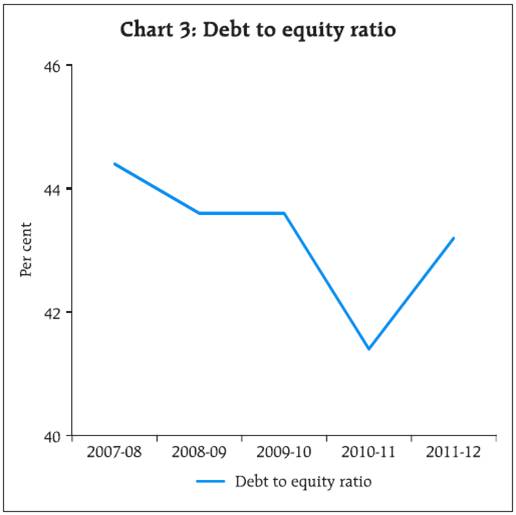
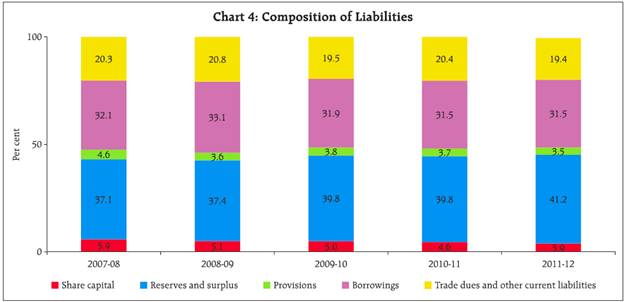
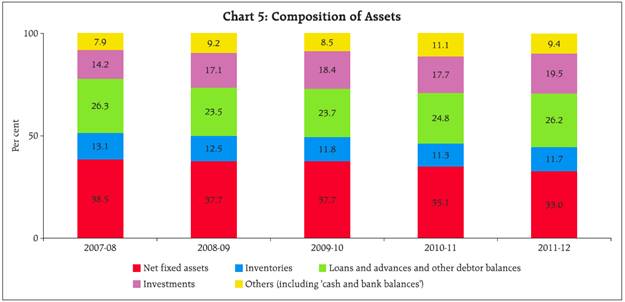
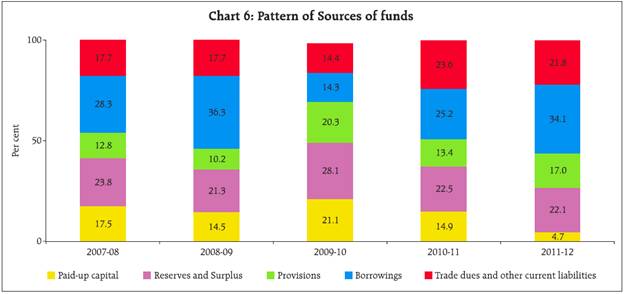
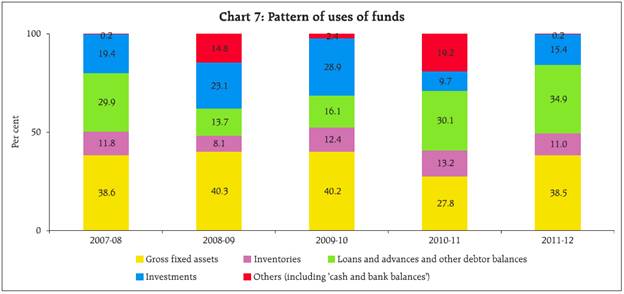
2.2 The larger companies, with sales ‘above `1 billion’ each recorded positive growth in sales but their EBITDA margins were the lowest in last five years. The fall was sharper for the companies in sales size classes ‘`1 billion - `5 billion’ and ‘`10 billion and above’. 2.3 At sectoral level, the EBITDA margin in the services sector was found to be higher than that in the manufacturing sector. EBITDA margin, in general, declined across all industries with the exception of ‘pharmaceuticals and medicines’ and ’cement and cement products’ industries in the manufacturing sector. In the services sector, margin of ‘transportation’ industry recorded significant decline. 3. Slower growth in business 3.1 Growth in total net assets of Indian corporates moderated since the crisis period of 2008-09, barring some recovery seen in 2010-11. Companies in ‘less than `1 billion’ sales size displayed lowest growth in total net assets over last five years. Growth in total net assets also moderated in all size classes in 2011-12 except for the sales size group ‘`1 billion - `5 billion’. 3.2 While growth in total net assets of companies in the services sector exceeded that of the manufacturing sector till 2008-09, the situation reversed since 2009-10. However, all industries in manufacturing sector recorded lower growth in total net assets in 2011-12 as compared to the previous year except ‘chemical and chemical products’ and ‘iron and steel’ industries. In the services sector, ‘transportation’ and ‘computer and related activities’ industries recorded higher growth in total net assets in 2011-12. 3.3 Adverse sentiments in the capital market also led to continuous decline in the growth rate in net worth of companies between 2007-08 and 2011-12 (Statement 2). Lower accrual in profit in 2011-12 further moderated the net worth growth. 4. Debt to equity ratio increased 4.1 The growth in total borrowings recorded a sharp decline in 2009-10 and then recovered to some extent in 2010-11 and 2011-12. However, growth rate of total borrowings of smaller companies (i.e. those having sales below `1 billion and between `5 billion and `10 billion each) moderated in 2011-12. Total borrowings also moderated in ‘textile’, ‘iron and steel’ and ‘pharmaceuticals and medicines’ industries in 2011-12. On the other hand, companies in ‘food products and beverages’ industry continued to borrow heavily recording high growth in 2011-12 on top of similar growth in 2010-11. Besides, high growth in borrowings in 2011-12 was also observed in ‘machineries and equipments (non-electrical)’, ‘construction’, ‘chemical and chemical products’ industries. 4.2 Debt to equity ratio (debt as percentage of net worth) increased in 2011-12 reversing a declining trend observed since 2007-08 mainly due to the higher growth in borrowing than in net worth (Chart 3). It had fallen gradually from 44.4 per cent in 2007-08 to 41.4 per cent in 2010-11 but rose to 43.2 per cent in 2011-12. Sales size- wise, debt to equity ratio was the lowest for the smallest sales size companies i.e., ‘Less than `1 billion’, while companies in ‘`5 billion to `10 billion’ sales range recorded the highest debt to equity ratio in 2011-12 (Statement 2). 4.3 While debt to equity ratio has remained at modest levels in most of the industries, it continued to be high in ‘transportation’, ‘textiles’, ‘iron and steel’ and ‘food products and beverages’ industries. High debt to equity ratio together with relatively lower EBITDA margin in ‘transportation’ and ‘food products and beverages’ industries may be a matter of some concern. 5. Share of net fixed assets in total assets declined and that of investment has risen 5.1 The overall composition of total liabilities in terms of paid-up capital, reserves and surplus, borrowings, trade dues and other current liabilities and provisions remained quite similar in the last five years (Statement 3A and Chart 4). However, on the assets side, share of ‘net fixed assets’ in total assets has gradually declined in the last five year period and correspondingly, share of investments rose and reached 19.5 per cent in 2011-12 which was the highest during the five year period (Statement 3B and Chart 5). Share of ‘loans and advances’, which declined during 2008-09 has gradually recovered. 6. Fixed assets formation remains the most prominent use of funds 6.1 Funds raised by the corporates during 2011-12 continued to be dominated by external (i.e., ‘other than companies’ own) sources of funds, though, its share declined from 63.6 per cent in 2010-11 to 60.8 per cent in 2011-12 (Statement 4A and Chart 6). This was due to sharp drop in the share of paid-up capital raised from the market. Funds raised through borrowings were significantly higher at 34.1 per cent in 2011-12 as compared with 25.2 per cent in 2010-11. 6.2 Gross fixed assets formation retained its prominence in the uses of funds during 2011-12 (Statement 4B and Chart 7). The share of ‘loans and advances and other debtor balances’ in uses of funds rose further in 2011-12. Share of investments which declined sharply in 2010-11 reversed the trend in 2011-12.
* Prepared in the Company Finances Division of the Department of Statistics and Information Management. Reference may be made to the February 2012 issue of the Reserve Bank of India Bulletin for the previous study, which covered 2,072 non-government non-financial large public limited companies during 2010-11. In the present study, 552 new companies have been covered in addition to the 1,291 companies common with the previous study. Data of some of the companies in the sample were procured from Centre for Monitoring Indian Economy (CMIE). 1 Companies with paid-up capital of `10 million and above. 2 In the case of companies, which either extended or shortened their accounting year, their income, expenditure and appropriation account figures have been annualised. The balance sheet data, however, have been retained as presented in the annual accounts of the companies. The analysis of financial performance of the select companies is subject to these limitations. |
|||||||||||||||||||||||||||||||||||||||||||||||||||||||||||||||||||||||||||||||||||||||||||||||||||||||||||||||||||||||||||||||||||||||||||||||||||||||||||||||||||||||||||||||||||||||||||||||||||||||||||||||||||||||||||||||||||||||||||||||||||||||||||||||||||||||||||||||||||||||||||||||||||||||||||||||||||||||||||||||||||||||||||||||||||||||||||||||||||||||||||||||||||||||||||||||||||||||||||||||||||||||||||||||||||||||||||||||||||||||||||||||||||||||||||||||||||||||||||||||||||||||||||||||||||||||||||||||||||||||||||||||||||||||||||||||||||||||||||||||||||||||||||||||||||||||||||||||||||||||||||||||||||||||||||||||||||||||||||||||||||||||

हे पेज शेअर करा:


भारतीय रिझर्व्ह बँक मोबाईल ॲप्लिकेशन इंस्टॉल करा आणि नवीनतम बातम्यांचा त्वरित ॲक्सेस मिळवा!


