India’s Foreign Trade: 2006-07 (April-March)* Provisional data on India’s merchandise trade for April-March 2006-07 and commodity-wise details for April-January 2006-07 released recently by the Directorate General of Commercial Intelligence and Statistics (DGCI&S) reveal the following.
Highlights
Merchandise exports in March 2007 were the highest level of exports recorded in a single month. Cumulative exports during April-March 2006-07 at US $ 124.6 billion, showing a growth rate of 21 per cent, achieved the export target set for the year. Imports during April-March2006-07 at US $ 181.3 billion was higher by 26.4 per cent over 2005-06. Non-oil imports contributed to 64.8 per cent of import growth. Oil imports showed a sharp deceleration in growth in March 2007 (9.4 per cent as against 27.2 per cent in March 2006). The cumulative imports of POL during 2006-07 at US $ 57.3 billion was higher by US $ 13.3 billion than a year ago. Trade deficit during April-March 2006-07 touched US $ 56.7 billion, higher by US $ 16.4 billion over the level in the corresponding period a year ago (US $ 40.3 billion).
Exports
Merchandise exports in March 2007, at US $ 12.6 billion, was the highest level of exports ever recorded in a single month (Chart 1 and Statement 1). Cumulative exports during April-March 2007 stood at US $ 124.6 billion (20.9 per cent growth), achieving the export target set by the * Prepared in the Division of International Trade, Department of Economic Analysis and Policy. Previous issue of the article was published in RBI Bulletin, May 2007. 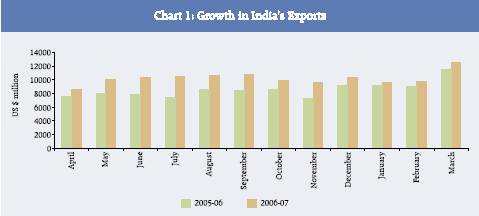
Government (US $ 125 billion) [Table-A and Statement-2]. With this India’s merchandise exports recorded a growth of above 20 per cent for the fifth consecutive year since 2002-03.
Commodity-wise data for 2006-07 (April-Januar y) revealed that both primar y products and manufactured products, in general, showed a moderation in export growth (Statement 3). At the same time, within the primary sector, tea, and spices, engineering goods in the manufacturing sector, and petroleum products maintained the growth momentum. Engineering goods and petroleum products, which together contributed to 63 per cent of total export growth during April-Januar y 2006-07, remained as the growth drivers (Box).
Table A: India’s Merchandise Trade : |
April-March |
(US $ million) |
Items |
2005-06 R |
2006-07P |
Exports |
|
103,101 |
124,598 |
|
|
(23.4) |
(20.9) |
Imports |
|
143,430 |
181,343 |
|
|
(28.6) |
(26.4) |
Oil Imports |
|
43,963 |
57,308 |
|
|
(47.3) |
(30.4) |
Non-Oil Imports |
|
99,466 |
124,035 |
|
|
(21.8) |
(24.7) |
Trade Balance |
|
–40,329 |
–56,745 |
P : Provisional. R: Revised.
Note :
Figures in parentheses show percentage change over the previous year.
Source : DGCI&S. |
The moderation in the growth of primary products witnessed during 2006-07 (April-January) was mainly due to the decline in the exports of iron ore and marine products. Growth in the exports of manufactured products also showed deceleration on the back of sharp drop in the growth of textiles, gems and jewellery, chemicals and leather. Within the engineering goods (which recorded a 36.6 per cent growth), iron and steel was the major growth puller (51.2 per cent) benefiting mostly from increased exports to the US, Belgium, Germany, Italy and UAE.
Textiles and textile products continued its decelerating trend in export growth during 2006-07 (April-January) and the slow down was witnessed across the major product segments like ready made Box: Drivers of Export Growth India’s merchandise exports have been registering strong growth ever since 2002-03, posting an average growth of 23.3 per cent during 2002-07 with the year 2004-05 witnessing the highest growth (30.8 per cent) in the last three and a half decades. As a result, India’s share in world merchandise exports reached 1.0 per cent in 2006 from 0.7 per cent in 2000.
The commodity composition of India’s export basket has undergone structural changes during this period (2002-07). The changing structure reveals that petroleum products, engineering products and ores and minerals emerged as the major drivers of export growth, while, the shares of traditional items like handicrafts, textiles and related products, gems and jewellery, agricultural products, and leather and manufactures showed reduction. Further, engineering goods, ores and minerals and petroleum products together contributed to 63 per cent of total export growth during 2002-07 (Chart). The tilt in commodity profile towards garments, cotton yarn and fabrics. Exports to major markets like the US, the UK, Germany, France, UAE and France showed a deceleration during this period. According to the US, Department of Commerce, Office of Textiles and Apparel, the exports of engineering goods, petroleum products and chemicals and related products reflect the growing competitiveness and the increasing technological sophistication of India’s manufacturing exports. 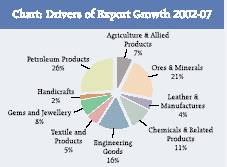
The changing commodity composition of India’s exports also reflects the shift in India’s relative share in world exports of commodities (Table). While India’s share in world agricultural exports remained constant between 2000 and 2005, the share in world exports of machinery and transport equipment, fuels and mining products and chemicals showed an improvement. Apart from the Government policies towards strengthening India’s trade sector, the recovery in global investment, reflected in a notable increase in exports of world trade in capital goods, also provided a conducive environment for stimulating technology oriented engineering goods exports from India India’s exports of textiles and apparel to the US during 2006-07 (April-March) in value terms decelerated to 4.0 per cent (24.2 per cent in 2005-06), and in quantity terms to 12.3 per cent (18.6 percent in 2005-06).
Table: India’s Share in World Exports |
Commodities |
1990 |
2000 |
2005 |
I. |
Agricultural Products |
0.8 |
1.2 |
1.2 |
II. |
Fuels and Mining |
|
|
|
|
Products |
0.3 |
0.4 |
1.1 |
III. Manufactures |
0.5 |
0.7 |
1.0 |
|
1. Iron and Steel |
0.2 |
0.9 |
1.7 |
|
2. Chemicals |
0.4 |
0.8 |
1.0 |
|
3. Machinery & Transport |
|
|
|
|
equipment |
0.1 |
0.1 |
0.3 |
|
4. Textiles |
2.1 |
3.8 |
3.9 |
|
5. Clothing |
2.3 |
3.1 |
3.0 |
Total Merchandise Rrade |
0.5 |
0.7 |
0.9 |
Source: World Trade Organisation. |
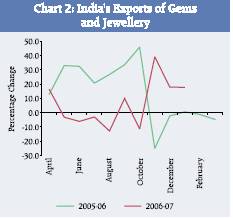
Gems and jewellery, which was showing a declining trend from the second half of 2005-06 showed a reversal since November 2006 (Chart 2). As a result, the cumulative exports during 2006-07 (April-January) registered a modest growth of 2.0 per cent as against a negative growth till April-November 2006. According to the Gems and Jewellery Export Promotion Council, the overall exports of gems and jewellery recorded a modest growth of 2.7 per cent during 2006-07 (April-March).
Exports of petroleum products (POL) recorded 62.2 per cent growth during 2006-07 (April-January), on top of 66.8 per cent a year ago, facilitated by increase in both price and volume. In volume terms, POL exports registered sharp increase at 46.9 per cent during April-January 2006-07 (15.2 per cent a year ago).
Destination-wise, the US remained the major market for India’s exports during 2006-07 (April-January) with a share of 15.2 per cent followed by UAE (9.7 per cent), China (6.3 per cent), Singapore (4.7 per cent) and UK (4.5 per cent). However, exports growth decelerated in almost all major markets during the period, with the exception of UAE, recording a growth of 44.2 per cent (Statement 4).
Imports
India’s merchandise imports posted a growth of 26.4 per cent during 2006-07 (April-March) with non-oil imports posting strong growth, while, oil imports showed a moderation.
Oil Imports
The imports of POL at US $ 4.6 billion in March 2007 showed a sharp deceleration in growth to 9.4 per cent (27.2 per cent a year ago), reflecting mostly the impact of international crude oil prices. The average crude oil price (Indian basket) at US $ 60.4 per barrel showed a marginal increase (1.3 per cent) during March 2007 as against an increase of 22.1 per cent a year ago (Table B).
Table B: Trends in Crude Oil Prices |
(US $/barrel) |
|
Dubai |
UK |
US- |
Indian |
|
|
Brent |
WTI |
Basket |
1995-96 |
16.2 |
17.5 |
18.8 |
16.7 |
2000-01 |
25.9 |
28.1 |
30.3 |
26.8 |
2001-02 |
21.8 |
23.2 |
24.1 |
22.4 |
2002-03 |
25.9 |
27.6 |
29.2 |
26.6 |
2003-04 |
26.9 |
29.0 |
31.4 |
27.8 |
2004-05 |
36.4 |
42.2 |
45.0 |
38.9 |
2005-06 |
53.4 |
58.0 |
59.9 |
55.3 |
2006-07 |
60.9 |
64.4 |
64.7 |
62.4 |
March -06 |
57.6 |
62.3 |
62.9 |
59.6 |
March-07 |
59.1 |
62.1 |
60.6 |
60.4 |
Note :
Indian basket comprising 58 per cent ‘sour’ variety benchmarked by Dubai crude and 42 per cent of
‘sweet’ variety benchmarked by UK Brent crude.
Source : International Monetary Fund, International Financial Statistics, World Bank’s Commodity Price Pink sheet May 2007. |
The overall POL imports during 2006-07 (April-March) stood at US $ 57.3 billion, a growth of 30.4 per cent over US $ 44.0 billion a year ago. The average price of Indian basket of crude oil stood at US $ 62.4 per barrel during 2006-07 (April-March), a relatively low growth of 12.7 per cent as compared to 42.2 per cent registered a year ago. In volume terms, oil imports increased by 18.6 per cent during 2006-07 (April-January) as compared to 3.2 per cent growth a year ago.
Non-Oil Imports
Non-oil imports in March 2007 grew by 16.6 per cent (11.5 per cent in March 2006) and contributed 81 per cent of the total import growth. The cumulative non-oil imports during 2006-07 (April-March) also recorded a strong growth of 24.7 per cent (21.8 per cent a year ago). Capital goods accounted for 46 per cent of the growth in non-oil imports. The other major contributors to growth were metalliferrous ores and metal scrap and gold and silver (Chart 3). On the other hand, pearls, precious and semi-precious stones, a major component of non-oil imports, showed a decline of 25.7 per cent during 2006-07 (April-January). Source-wise, China was the major source of non-oil imports during 2006-07 (April-January) accounting for 13.9 per cent of total non-oil imports, followed by the US (8.1 per cent), Switzerland (7.4 per cent), Germany (5.9 per cent) and Australia (5.6 per cent). However, considering the overall imports (including oil), Saudi Arabia turned out to be the second major import source for India during April-January 2006-07.
Trade Deficit
The trade deficit, during 2006-07 (April-March) stood at US $ 56.7 billion, an increase of US $ 16.4 billion over 2005-06 (US $ 40.3 billion) (Statement 2). At this level, trade deficit accounted for 6.2 per cent of GDP at current market prices during 2006-07, compared to 5.0 per cent of GDP in 2005-06. The trade deficit on the oil account increased by US $ 6.1 billion during 2006-07 (April-January), while the non-oil trade deficit increased by US $ 4.9 billion. 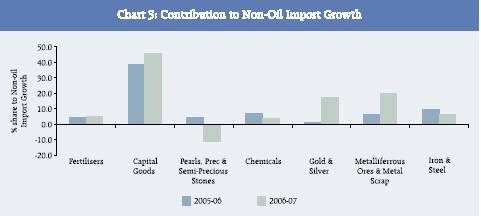
Global Developments
The global economy expanded in a modest pace in the beginning of 2007 with growth slowing down in the US. According to the advance estimates by the US Bureau of Economic Analysis released on April 27, 2007, the real gross domestic product increased at an annual rate of 1.3 percent in the first quarter of 2007, compared to 2.5 per cent increase in the fourth quarter.
On the trade front, according to latest data available from the IMF, International Financial Statistics, world exports in January 2007 registered strong growth at 16.3 per cent (10.8 per cent a year ago). Industrial countries registered a growth of 14.6 per cent (7.4 per cent a year ago), while developing countries exports grew by 18.3 per cent (15.4 per cent a year ago).
According to the US Bureau of Economic Analysis (BEA), during the first quarter of 2007 (January-March), the US merchandise registered a growth of 10.6 per cent (13.8 per cent a year ago), while, imports grew by 3.8 per cent (13.7 per cent in the corresponding period a year ago). In the Euro area, according to Euro Stat, exports from the 13 major EU countries increased by 10.3 per cent in euro terms during January-February 2007 (13.5 per cent a year ago), while imports registered a relatively slow growth of 7.7 per cent (21.1 per cent a year ago). Japan’s exports posted a growth of 15.1 per cent during January-February 2007 (13.9 per cent a year ago) and imports grew by 15.7 per cent (20.1 per cent a year ago). China’s exports, according to the Ministry of Commerce of the People’s Republic of China, during the first quarter of 2007 (January-March) increased by 27.8 per cent, while imports grew by 18.2 per cent. Commodity Prices
Global Commodity prices remained strong in 2007 so far. According to the World Bank, Monthly Commodity price data, average international crude oil prices surged to an eight month high in April 2007 touching US $ 65.1 per barrel. Non-energy commodity prices also remained firm in April 2007, registering an increase of 4.4 per cent over March 2007. The pick up was mostly reflected in metals and minerals which registered an increase of 9.1 per cent in April 2007 compared to the previous month (Chart 4). 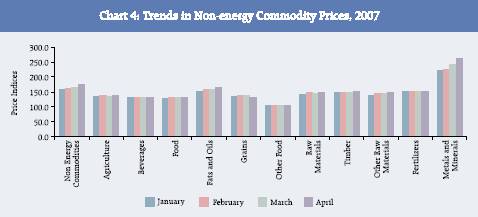
Statement 1 : India’s Foreign Trade for the Month of March 2007 |
Year |
Export |
Import |
Trade Balance |
|
Total |
Oil |
Non-Oil |
Total |
Oil |
Non-Oil |
Total |
Oil |
Non-Oil |
1 |
2 |
3 |
4 |
5 |
6 |
7 |
8 |
9 |
10 |
Rupees crore |
2004-05 |
44,367 |
2,874 |
41,492 |
54,042 |
14,433 |
39,609 |
–9,676 |
–11,559 |
1,883 |
|
|
|
|
|
|
|
|
|
|
2005-06 R |
51,426 |
4,274 |
47,152 |
63,672 |
18,695 |
44,977 |
–12,246 |
–14,421 |
2,176 |
|
(15.9) |
(48.7) |
(13.6) |
(17.8) |
(29.5) |
(13.6) |
|
|
|
|
|
|
|
|
|
|
|
|
|
2006-07 P |
55,400 |
.. |
.. |
72,128 |
20,242 |
51,886 |
–16,727 |
|
|
|
(7.7) |
|
|
(13.3) |
(8.3) |
(15.4) |
|
|
|
US dollar million |
2004-05 |
10,155 |
658 |
9,497 |
12,369 |
3,303 |
9,066 |
–2,215 |
–2,646 |
431 |
|
|
|
|
|
|
|
|
|
|
2005-06 R |
11,561 |
961 |
10,601 |
14,314 |
4,203 |
10,111 |
–2,753 |
–3,242 |
489 |
|
(13.9) |
(46.1) |
(11.6) |
(15.7) |
(27.2) |
(11.5) |
|
|
|
|
|
|
|
|
|
|
|
|
|
2006-07 P |
12,584 |
.. |
.. |
16,383 |
4,598 |
11,785 |
–3,799 |
|
|
|
(8.8) |
|
|
(14.5) |
(9.4) |
(16.6) |
|
|
|
SDR million |
2004-05 |
6,656 |
431 |
6,224 |
8,107 |
2,165 |
5,942 |
–1,452 |
–1,734 |
282 |
|
|
|
|
|
|
|
|
|
|
2005-06 R |
8,036 |
668 |
7,368 |
9,950 |
2,921 |
7,028 |
–1,914 |
–2,254 |
340 |
|
(20.7) |
(54.9) |
(18.4) |
(22.7) |
(34.9) |
(18.3) |
|
|
|
|
|
|
|
|
|
|
|
|
|
2006-07 P |
8,349 |
.. |
.. |
10,870 |
3,050 |
7,819 |
–2,521 |
|
|
|
(3.9) |
|
|
(9.2) |
(4.4) |
(11.3) |
|
|
|
P : Provisional. R : Revised. .. : Not available.
Note : Figures in brackets relate to percentage variation over the corresponding period of the previous year.
Source : DGCI & S. |
Statement 2 : India’s Foreign Trade |
Year |
Export |
Import |
Trade Balance |
|
Total |
Oil |
Non-Oil |
Total |
Oil |
Non-Oil |
Total |
Oil |
Non-Oil |
1 |
2 |
3 |
4 |
5 |
6 |
7 |
8 |
9 |
10 |
April-March |
Rupees crore |
2004-2005 |
375,340 |
31,404 |
343,935 |
501,065 |
134,094 |
381,404 |
–125,725 |
–102690 |
–23,035 |
|
|
|
|
|
|
|
|
|
|
2005-2006 R |
456,463 |
51,030 |
405,433 |
635,013 |
194,640 |
440,373 |
–178,550 |
–143,610 |
–34,940 |
|
(21.6) |
(62.5) |
(17.9) |
(26.7) |
(45.2) |
(20.0) |
|
|
|
2006-2007 P |
563,800 |
69,726 * |
393,480 * |
820,568 |
259,316 |
561,252 |
–256,768 |
|
|
|
(23.5) |
(66.7) |
(21.9) |
(29.2) |
(33.2) |
(27.4) |
(22.3) |
|
|
US dollar million |
2004-2005 |
83,536 |
6,989 |
76,547 |
111,517 |
29,844 |
81,673 |
–27,981 |
–22,855 |
–5,127 |
|
|
|
|
|
|
|
|
|
|
2005-2006 R |
103,101 |
11,526 |
91,575 |
143,430 |
43,963 |
99,466 |
–40,329 |
–32,437 |
–7,892 |
|
(23.4) |
(64.9) |
(19.6) |
(28.6) |
(47.3) |
(21.8) |
|
|
|
2006-2007 P |
124,598 |
15,331 * |
86,515 * |
181,343 |
57,308 |
124,035 |
–56,745 |
|
|
|
(20.9) |
(62.2) |
(18.6) |
(26.4) |
(30.4) |
(24.7) |
|
|
|
SDR million |
2004-2005 |
56,081 |
4,692 |
51,389 |
74,866 |
20,036 |
54,830 |
–18,785 |
–15,343 |
–3,442 |
|
|
|
|
|
|
|
|
|
|
2005-2006 R |
70,781 |
7,913 |
62,868 |
98,467 |
30,182 |
68,286 |
–27,687 |
–22,269 |
–5,418 |
|
(26.2) |
(68.6) |
(22.3) |
(31.5) |
(50.6) |
(24.5) |
|
|
|
2006-2007 P |
83,832 |
10,336 * |
58,330 * |
122,011 |
38,558 |
83,453 |
–38,179 |
|
|
|
(18.4) |
(59.7) |
(16.8) |
(23.9) |
(27.8) |
(22.2) |
|
|
|
P : Provisional. R : Revised. * : Corresponds to April-January.
Note :
1. Figures in brackets relate to percentage variation over the corresponding period of the previous year.
2. Data conversion has been done using period average exchange rates.
Source : DGCI & S. |
Statement 3 : India’s Exports of Principal Commodities |
|
|
|
(US $ million) |
Commodity Group |
April-January |
|
Percentage Variation |
|
|
|
|
2004-05 |
2005-06 |
2006-07 P |
(3)/(2) |
(4)/(3) |
1 |
|
|
|
2 |
3 |
4 |
5 |
6 |
Primary Products |
9,864.1 |
12,760.5 |
14,958.6 |
29.4 |
17.2 |
|
|
|
|
(15.3) |
(15.5) |
(14.7) |
|
|
|
A. |
Agricultural & Allied Products |
6,560.9 |
8,025.6 |
9,597.9 |
22.3 |
19.6 |
|
|
of which : |
(10.2) |
(9.7) |
(9.4) |
|
|
|
|
1. |
Tea |
345.7 |
331.5 |
382.8 |
–4.1 |
15.5 |
|
|
2. |
Coffee |
169.4 |
274.0 |
343.0 |
61.8 |
25.2 |
|
|
3. |
Rice |
1,110.0 |
1,158.9 |
1,212.5 |
4.4 |
4.6 |
|
|
4. |
Wheat |
290.4 |
125.8 |
7.7 |
–56.7 |
–93.9 |
|
|
5. |
Cotton Raw incl. Waste |
65.4 |
398.8 |
853.4 |
509.4 |
114.0 |
|
|
6. |
Tobacco |
212.1 |
234.2 |
295.5 |
10.5 |
26.1 |
|
|
7. |
Cashew incl. CNSL |
440.3 |
494.7 |
462.2 |
12.4 |
–6.6 |
|
|
8. |
Spices |
338.1 |
388.2 |
534.7 |
14.8 |
37.7 |
|
|
9. |
Oil Meal |
560.5 |
742.5 |
864.8 |
32.5 |
16.5 |
|
|
10. Marine Products |
1,065.1 |
1,334.8 |
1,326.7 |
25.3 |
–0.6 |
|
|
11. Sugar & Mollases |
30.9 |
58.2 |
565.5 |
88.2 |
871.8 |
|
B. |
Ores & Minerals |
3,303.1 |
4,734.9 |
5,360.7 |
43.3 |
13.2 |
|
|
of which : |
(5.1) |
(5.7) |
(5.3) |
|
|
|
|
1. |
Iron Ore |
2,024.6 |
2,956.0 |
2,947.5 |
46.0 |
–0.3 |
|
|
2. |
Processed Minerals |
638.3 |
896.3 |
1,050.5 |
40.4 |
17.2 |
II. |
Manufactured Goods |
47,240.4 |
58,041.5 |
67,372.0 |
22.9 |
16.1 |
|
|
of which : |
(73.2) |
(70.4) |
(66.2) |
|
|
|
A. |
Leather & Manufactures |
1,964.3 |
2,202.7 |
2,401.2 |
12.1 |
9.0 |
|
B. |
Chemicals & Related Products |
9,742.8 |
11,725.7 |
13,427.0 |
20.4 |
14.5 |
|
|
1. |
Basic Chemicals,
Pharmaceuticals & Cosmetics |
5,557.3 |
7,135.7 |
8,274.7 |
28.4 |
16.0 |
|
|
2. |
Plastic & Linoleum |
2,426.6 |
2,322.1 |
2,626.8 |
–4.3 |
13.1 |
|
|
3. |
Rubber, Glass, Paints &
Enamels, etc. |
1,369.5 |
1,706.0 |
1,921.4 |
24.6 |
12.6 |
|
|
4. |
Residual Chemicals &
Allied Products |
389.3 |
561.9 |
604.1 |
44.3 |
7.5 |
|
C. |
Engineering Goods |
13,165.8 |
17,174.9 |
23,468.3 |
30.5 |
36.6 |
|
|
of which : |
|
|
|
|
|
|
|
1. |
Manufactures of metals |
2,669.0 |
3,376.4 |
4,082.4 |
26.5 |
20.9 |
|
|
2. |
Machinery & Instruments |
2,821.3 |
4,036.9 |
5,327.6 |
43.1 |
32.0 |
|
|
3. |
Transport equipments |
2,238.6 |
3,380.3 |
3,703.8 |
51.0 |
9.6 |
|
|
4. |
Iron & steel |
2,853.2 |
2,860.4 |
4,325.2 |
0.3 |
51.2 |
|
|
5. |
Electronic goods |
1,456.1 |
1,735.8 |
2,276.7 |
19.2 |
31.2 |
|
D. |
Textiles and Textile Products |
10,683.9 |
13,145.2 |
13,965.1 |
23.0 |
6.2 |
|
|
1. |
Cotton Yarn, Fabrics,
Made-ups, etc. |
2,760.5 |
3,190.9 |
3,400.8 |
15.6 |
6.6 |
|
|
2. |
Natural Silk Yarn,
Fabrics Madeups, etc. |
|
|
|
|
|
|
|
|
(incl.silk waste) |
332.2 |
366.8 |
363.4 |
10.4 |
–0.9 |
|
|
3. |
Manmade Yarn, Fabrics,
Made-ups, etc. |
1,588.5 |
1,582.7 |
1,750.5 |
–0.4 |
10.6 |
|
|
4. |
Manmade Staple Fibre |
56.1 |
69.2 |
151.1 |
23.2 |
118.5 |
|
|
5. |
Woolen Yarn, Fabrics,
Madeups, etc. |
55.6 |
70.9 |
68.5 |
27.6 |
–3.4 |
|
|
6. |
Readymade Garments |
5,069.9 |
6,812.1 |
7,135.9 |
34.4 |
4.8 |
|
|
7. |
Jute & Jute Manufactures |
221.7 |
246.7 |
235.5 |
11.3 |
–4.5 |
|
|
8. |
Coir & Coir Manufactures |
84.8 |
111.7 |
117.8 |
31.6 |
5.5 |
|
|
9. |
Carpets |
514.5 |
694.3 |
741.5 |
34.9 |
6.8 |
|
|
|
(a) Carpet Handmade |
493.3 |
675.2 |
717.4 |
36.9 |
6.2 |
|
|
|
(b) Carpet Millmade |
0.0 |
0.0 |
0.0 |
|
|
|
|
|
(c) Silk Carpets |
21.2 |
19.1 |
24.1 |
–10.2 |
26.5 |
|
E. |
Gems & Jewellery |
10,716.4 |
12,592.9 |
12,849.8 |
17.5 |
2.0 |
|
F. |
Handicrafts |
315.0 |
385.3 |
305.7 |
22.3 |
–20.7 |
III. |
Petroleum Products |
5,667.2 |
9,452.0 |
15,330.7 |
66.8 |
62.2 |
|
|
|
|
(8.8) |
(11.5) |
(15.1) |
|
|
IV. |
Others |
1,735.3 |
2,141.8 |
4,184.6 |
23.4 |
95.4 |
|
|
|
|
(2.7) |
(2.6) |
(4.1) |
|
|
Total Exports |
64,507.1 |
82,395.8 |
101,845.9 |
27.7 |
23.6 |
P : Provisional.
Note : Figures in brackets relate to percentage to total exports for the period.
Source : DGCI & S. |
Statement 4 : Direction of India’s Foreign Trade- Exports |
(US $ million) |
Group/Country |
April-January |
|
Percentage Variation |
|
|
|
|
2004-05 |
2005-06 |
2006-07 P |
(3)/(2) |
(4)/(3) |
1 |
|
|
|
2 |
3 |
4 |
5 |
6 |
I. |
O E C D Countries |
28,677.2 |
37,067.4 |
42,235.6 |
29.3 |
13.9 |
|
A. |
E U |
13,565.9 |
18,027.9 |
20,829.1 |
32.9 |
15.5 |
|
|
of which: |
|
|
|
|
|
|
|
1. |
Belgium |
1,946.0 |
2,293.5 |
2,802.7 |
17.9 |
22.2 |
|
|
2. |
France |
1,326.9 |
1,665.0 |
1,706.6 |
25.5 |
2.5 |
|
|
3. |
Germany |
2,179.4 |
2,842.4 |
3,164.4 |
30.4 |
11.3 |
|
|
4. |
Italy |
1,744.6 |
1,967.0 |
2,910.4 |
12.7 |
48.0 |
|
|
5. |
Netherlands |
1,234.8 |
2,159.7 |
2,134.9 |
74.9 |
–1.1 |
|
|
6. |
U K |
2,838.3 |
4,163.6 |
4,546.9 |
46.7 |
9.2 |
|
B. |
North America |
11,767.3 |
14,926.1 |
16,399.1 |
26.8 |
9.9 |
|
|
1. |
Canada |
675.5 |
818.1 |
913.0 |
21.1 |
11.6 |
|
|
2. |
U S A |
11,091.8 |
14,108.0 |
15,486.1 |
27.2 |
9.8 |
|
C. |
Asia and Oceania |
2,248.9 |
2,799.9 |
3,496.5 |
24.5 |
24.9 |
|
|
of which: |
|
|
|
|
|
|
|
1. |
Australia |
574.0 |
676.1 |
748.1 |
17.8 |
10.7 |
|
|
2. |
Japan |
1,600.2 |
1,999.4 |
2,265.7 |
24.9 |
13.3 |
|
D. |
Other O E C D Countries |
1,095.1 |
1,313.5 |
1,510.8 |
19.9 |
15.0 |
|
|
of which: |
|
|
|
|
|
|
|
1. |
Switzerland |
424.5 |
373.8 |
360.7 |
–11.9 |
–3.5 |
II. |
O P E C |
10,259.6 |
12,073.1 |
16,931.8 |
17.7 |
40.2 |
|
of which: |
|
|
|
|
|
|
1. |
Indonesia |
1,076.1 |
1,053.8 |
1,640.8 |
–2.1 |
55.7 |
|
2. |
Iran |
999.8 |
922.2 |
1,259.9 |
–7.8 |
36.6 |
|
3. |
Iraq |
103.7 |
109.6 |
159.8 |
5.7 |
45.8 |
|
4. |
Kuwait |
336.6 |
421.9 |
508.5 |
25.3 |
20.5 |
|
5. |
Saudi Arabia |
1,139.8 |
1,447.1 |
2,038.2 |
27.0 |
40.8 |
|
6. |
U A E |
5,682.7 |
6,847.2 |
9,872.7 |
20.5 |
44.2 |
III. |
Eastern Europe |
1,439.5 |
1,577.3 |
1,989.6 |
9.6 |
26.1 |
|
of which: |
|
|
|
|
|
|
1. |
Romania |
82.1 |
63.5 |
124.6 |
–22.6 |
96.2 |
|
2. |
Russia |
504.7 |
583.4 |
725.0 |
15.6 |
24.3 |
IV. |
Developing Countries |
23,781.0 |
31,458.8 |
39,992.7 |
32.3 |
27.1 |
|
of which: |
|
|
|
|
|
|
A. |
Asia |
18,544.7 |
24,436.9 |
29,808.8 |
31.8 |
22.0 |
|
|
a) |
S A A R C |
3,499.7 |
4,369.7 |
5,002.2 |
24.9 |
14.5 |
|
|
|
1. Bangladesh |
1,271.2 |
1,353.9 |
1,309.9 |
6.5 |
–3.2 |
|
|
|
2. Bhutan |
65.1 |
82.7 |
45.2 |
— |
–45.3 |
|
|
|
3. Maldives |
38.5 |
57.2 |
55.7 |
48.8 |
–2.7 |
|
|
|
4. Nepal |
600.4 |
714.9 |
770.2 |
19.1 |
7.7 |
|
|
|
5. Pakistan |
411.8 |
513.4 |
1,109.2 |
24.7 |
116.1 |
|
|
|
6. Sri Lanka |
1,112.8 |
1,647.7 |
1,711.9 |
48.1 |
3.9 |
|
|
b) |
Other Asian Developing
Countries |
15,044.9 |
20,067.1 |
24,806.6 |
33.4 |
23.6 |
|
|
|
of which: |
|
|
|
|
|
|
|
|
1. People’s Rep of China |
3,556.3 |
5,177.4 |
6,437.9 |
45.6 |
24.3 |
|
|
|
2. Hong Kong |
2,847.5 |
3,583.8 |
3,675.9 |
25.9 |
2.6 |
|
|
|
3. South Korea |
778.4 |
1,369.5 |
2,054.7 |
75.9 |
50.0 |
|
|
|
4. Malaysia |
860.5 |
921.6 |
1,095.2 |
7.1 |
18.8 |
|
|
|
5. Singapore |
3,007.8 |
4,382.2 |
4,766.9 |
45.7 |
8.8 |
|
|
|
6. Thailand |
667.8 |
863.1 |
1,156.8 |
29.2 |
34.0 |
|
B. |
Africa |
3,544.3 |
4,520.5 |
6,935.7 |
27.5 |
53.4 |
|
|
Of which: |
|
|
|
|
|
|
|
1. |
Benin |
34.9 |
81.9 |
123.7 |
134.6 |
51.1 |
|
|
2. |
Egypt Arab Republic |
348.4 |
507.7 |
582.4 |
45.7 |
14.7 |
|
|
3. |
Kenya |
340.8 |
431.3 |
1,053.8 |
26.6 |
144.3 |
|
|
4. |
South Africa |
821.7 |
1,219.5 |
1,783.1 |
48.4 |
46.2 |
|
|
5. |
Sudan |
242.6 |
252.8 |
330.5 |
4.2 |
30.8 |
|
|
6. |
Tanzania |
146.3 |
195.5 |
227.7 |
33.6 |
16.5 |
|
|
7. |
Zambia |
37.3 |
54.4 |
89.1 |
45.7 |
63.8 |
|
C. |
Latin American Countries |
1,692.1 |
2,501.4 |
3,248.2 |
47.8 |
29.9 |
V. |
Others |
54.8 |
80.3 |
86.2 |
46.5 |
7.3 |
VI. |
Unspecified |
295.0 |
138.9 |
610.0 |
–52.9 |
339.1 |
Total Exports |
64,507.1 |
82,395.8 |
101,845.9 |
27.7 |
23.6 |
P : Provisional.
Source : DGCI & S. |
Statement 5 : India’s Imports of Principal Commodities |
(US $ million) |
Commodity Group |
April-January |
|
Percentage |
Variation |
|
|
|
|
2004-05 |
2005-06 |
2006-07 P |
(3)/(2) |
(4)/(3) |
1 |
|
|
|
2 |
3 |
4 |
5 |
6 |
I. |
Bulk Imports |
33,977.8 |
49,901.7 |
69,244.2 |
46.9 |
38.8 |
|
|
|
|
(38.9) |
(42.3) |
(46.7) |
|
|
|
A. |
Petroleum, Petroleum Products |
24,038.3 |
35,646.5 |
47,608.9 |
48.3 |
33.6 |
|
|
& Related Material |
(27.5) |
(30.2) |
(32.1) |
|
|
|
B. |
Bulk Consumption Goods |
2,532.7 |
2,295.9 |
2,793.2 |
–9.3 |
21.7 |
|
|
1. |
Wheat |
0.0 |
0.0 |
311.6 |
— |
— |
|
|
2. |
Cereals & Cereal Preparations |
19.9 |
26.5 |
27.9 |
32.8 |
5.5 |
|
|
3. |
Edible Oil |
1,996.6 |
1,626.9 |
1,797.6 |
–18.5 |
10.5 |
|
|
4. |
Pulses |
352.5 |
495.4 |
655.3 |
40.5 |
32.3 |
|
|
5. |
Sugar |
163.7 |
147.1 |
0.7 |
— |
— |
|
C. |
Other Bulk Items |
7,406.8 |
11,959.2 |
18,842.1 |
61.5 |
57.6 |
|
|
1. |
Fertilisers |
1,022.8 |
1,861.9 |
2,805.2 |
82.0 |
50.7 |
|
|
|
a) Crude |
202.9 |
266.2 |
296.2 |
31.2 |
11.2 |
|
|
|
b) Sulphur & Unroasted Iron Pyrites |
96.6 |
115.2 |
90.1 |
19.3 |
–21.7 |
|
|
|
c) Manufactured |
723.3 |
1,480.6 |
2,418.9 |
104.7 |
63.4 |
|
|
2. |
Non-Ferrous Metals |
1,060.5 |
1,518.7 |
2,142.1 |
43.2 |
41.0 |
|
|
3. |
Paper, Paperboard & Mgfd.
incl. Newsprint |
603.5 |
783.2 |
1,026.7 |
29.8 |
31.1 |
|
|
4. |
Crude Rubber, incl.
Synthetic & Reclaimed |
336.9 |
348.9 |
493.6 |
3.5 |
41.5 |
|
|
5. |
Pulp & Waste Paper |
411.5 |
476.7 |
514.2 |
15.8 |
7.9 |
|
|
6. |
Metalliferrous Ores & Metal Scrap |
1,933.3 |
3,125.6 |
6,814.6 |
61.7 |
118.0 |
|
|
7. |
Iron & Steel |
2,038.3 |
3,844.1 |
5,045.8 |
88.6 |
31.3 |
II. |
Non-Bulk Imports |
53,282.1 |
67,970.4 |
79,047.0 |
27.6 |
16.3 |
|
|
|
|
(61.1) |
(57.7) |
(53.3) |
|
|
|
A. |
Capital Goods |
18,518.6 |
25,900.3 |
34,298.9 |
39.9 |
32.4 |
|
|
1. |
Manufactures of Metals |
731.2 |
1,006.7 |
1,274.4 |
37.7 |
26.6 |
|
|
2. |
Machine Tools |
473.4 |
885.3 |
1,206.3 |
87.0 |
36.3 |
|
|
3. |
Machinery except Electrical &
Electronics |
5,309.4 |
8,042.3 |
11,080.1 |
51.5 |
37.8 |
|
|
4. |
Electrical Machinery except
Electronics |
958.1 |
1,227.6 |
1,596.5 |
28.1 |
30.0 |
|
|
5. |
Electronic Goods incl.
Computer Software |
8,604.1 |
11,450.6 |
13,903.8 |
33.1 |
21.4 |
|
|
6. |
Transport Equipments |
2,002.9 |
2,625.3 |
3,715.6 |
31.1 |
41.5 |
|
|
7. |
Project Goods |
439.5 |
662.5 |
1,522.2 |
50.7 |
129.8 |
|
B. |
Mainly Export Related Items |
13,318.8 |
15,988.7 |
14,583.8 |
20.0 |
–8.8 |
|
|
1. |
Pearls, Precious & Semi-
Precious Stones |
7,238.9 |
8,028.3 |
5,966.2 |
10.9 |
–25.7 |
|
|
2. |
Chemicals, Organic & Inorganic |
4,449.3 |
5,783.2 |
6,444.0 |
30.0 |
11.4 |
|
|
3. |
Textile Yarn, Fabric, etc. |
1,269.6 |
1,748.0 |
1,814.9 |
37.7 |
3.8 |
|
|
4. |
Cashew Nuts, raw |
361.0 |
429.2 |
358.6 |
18.9 |
–16.4 |
|
C. |
Others |
21,444.6 |
26,081.4 |
30,164.3 |
21.6 |
15.7 |
|
|
of which : |
|
|
|
|
|
|
|
1. |
Gold & Silver |
8,933.1 |
9,189.0 |
12,343.7 |
2.9 |
34.3 |
|
|
2. |
Artificial Resins & Plastic Materials |
1,161.0 |
1,898.5 |
2,112.5 |
63.5 |
11.3 |
|
|
3. |
Professional Instruments etc.
except electrical |
1,184.4 |
1,615.5 |
1,883.9 |
36.4 |
16.6 |
|
|
4. |
Coal, Coke & Briquittes, etc. |
2,445.1 |
3,196.5 |
3,656.6 |
30.7 |
14.4 |
|
|
5. |
Medicinal & Pharmaceutical Products |
579.7 |
860.5 |
1,028.5 |
48.4 |
19.5 |
|
|
6. |
Chemical Materials & Products |
669.3 |
863.5 |
1,105.8 |
29.0 |
28.1 |
|
|
7. |
Non-Metallic Mineral Manufactures |
377.9 |
518.8 |
644.6 |
37.3 |
24.2 |
Total Imports |
87,259.9 |
117,872.1 |
148,291.2 |
35.1 |
25.8 |
Memo Items |
|
|
|
|
|
|
Non-Oil Imports |
63,221.6 |
82,225.5 |
100,682.2 |
30.1 |
22.4 |
|
Non-Oil Imports excl. Gold & Silver |
54,288.5 |
73,036.5 |
88,338.5 |
34.5 |
21.0 |
|
Mainly Industrial Inputs* |
49,848.1 |
67,644.5 |
81,242.5 |
35.7 |
20.1 |
P : Provisional.
* : Non oil imports net of gold and silver, bulk consumption goods, manufactured fertilizers
and professional instruments.
Note : Figures in brackets relate to percentage to total imports for the period.
Source : DGCI & S. |
Statement 6 : Direction of India’s Foreign Trade- Imports |
(US $ million) |
Group/Country |
April-January |
|
|
|
|
2004-05 |
2005-06 |
2006-07 P |
1 |
|
|
|
2 |
3 |
4 |
I. |
O E C D Countries |
30,681.6 |
38,902.4 |
48,591.5 |
|
A. |
E U |
14,299.2 |
18,698.2 |
21,165.4 |
|
|
Of which: |
|
|
|
|
|
1. |
Belgium |
3,642.0 |
4,073.4 |
3,259.1 |
|
|
2. |
France |
1,123.8 |
1,430.5 |
1,784.9 |
|
|
3. |
Germany |
3,160.6 |
4,822.7 |
6,064.5 |
|
|
4. |
Italy |
1,083.3 |
1,523.2 |
2,150.0 |
|
|
5. |
Netherlands |
635.5 |
881.0 |
908.2 |
|
|
6. |
U K |
2,683.2 |
3,347.3 |
3,366.6 |
|
B. |
North America |
5,784.8 |
7,224.2 |
9,535.0 |
|
|
1. |
Canada |
598.0 |
774.0 |
1,117.8 |
|
|
2. |
U S A |
5,186.7 |
6,450.2 |
8,417.2 |
|
C. |
Asia and Oceania |
5,587.5 |
7,212.4 |
9,621.8 |
|
|
of which: |
|
|
|
|
|
1. |
Australia |
3,045.7 |
4,092.6 |
5,748.2 |
|
|
2. |
Japan |
2,445.2 |
2,943.2 |
3,655.5 |
|
D. |
Other O E C D Countries |
5,010.2 |
5,767.6 |
8,269.3 |
|
|
Of which: |
|
|
|
|
|
1. |
Switzerland |
4,723.9 |
5,349.3 |
7,464.8 |
II. |
O P E C |
7,877.0 |
9,158.3 |
46,422.1 |
|
of which: |
|
|
|
|
1. |
Indonesia |
2,084.0 |
2,449.5 |
3,282.1 |
|
2. |
Iran |
320.3 |
570.7 |
6,005.9 |
|
3. |
Iraq |
0.8 |
1.5 |
4,638.5 |
|
4. |
Kuwait |
235.4 |
397.9 |
4,947.4 |
|
5. |
Saudi Arabia |
1,046.4 |
1,318.5 |
11,285.8 |
|
6. |
U A E |
3,597.1 |
3,600.6 |
7,081.4 |
III. |
Eastern Europe |
1,929.1 |
3,260.5 |
3,782.7 |
|
of which: |
|
|
|
|
1. |
Romania |
130.5 |
229.7 |
208.1 |
|
2. |
Russia |
1,028.7 |
1,771.6 |
1,704.5 |
IV. |
Developing Countries |
22,505.0 |
30,614.8 |
48,796.5 |
|
of which: |
|
|
|
|
A. |
Asia |
17,720.1 |
24,731.5 |
38,772.9 |
|
|
a) |
S A A R C |
752.1 |
1,133.0 |
1,208.8 |
|
|
|
1. Bangladesh |
44.9 |
98.0 |
193.6 |
|
|
|
2. Bhutan |
49.8 |
72.5 |
107.5 |
|
|
|
3. Maldives |
0.5 |
1.6 |
2.6 |
|
|
|
4. Nepal |
288.2 |
327.9 |
252.9 |
|
|
|
5. Pakistan |
75.6 |
155.9 |
268.9 |
|
|
|
6. Sri Lanka |
293.0 |
477.0 |
383.3 |
|
|
b) |
Other Asian
Developing Countries |
16,968.0 |
23,598.6 |
37,564.1 |
|
|
|
of which: |
|
|
|
|
|
|
1. People’s Rep of China |
5,538.5 |
8,861.4 |
14,108.1 |
|
|
|
2. Hong Kong |
1,386.7 |
1,751.9 |
1,975.7 |
|
|
|
3. South Korea |
2,647.7 |
3,668.1 |
3,909.2 |
|
|
|
4. Malaysia |
1,865.4 |
1,994.9 |
4,402.7 |
|
|
|
5. Singapore |
2,107.5 |
2,644.7 |
4,581.9 |
|
|
|
6. Thailand |
662.2 |
995.0 |
1,378.4 |
|
B. |
Africa |
3,096.7 |
3,862.8 |
5,727.0 |
|
|
of which: |
|
|
|
|
|
1. |
Benin |
72.1 |
74.4 |
75.4 |
|
|
2. |
Egypt Arab Republic |
117.8 |
192.4 |
1,471.0 |
|
|
3. |
Kenya |
38.8 |
41.1 |
45.5 |
|
|
4. |
South Africa |
1,733.4 |
2,038.4 |
2,172.9 |
|
|
5. |
Sudan |
19.9 |
26.4 |
93.7 |
|
|
6. |
Tanzania |
120.2 |
101.0 |
77.5 |
|
|
7. |
Zambia |
20.9 |
34.6 |
77.0 |
|
C. |
Latin American Countries |
1,688.3 |
2,020.5 |
4,296.7 |
V. |
Others |
17.1 |
37.0 |
56.9 |
VI. |
Unspecified |
24,250.1 |
35,899.0 |
641.3 |
Total Imports |
87,259.9 |
117,872.1 |
148,291.2 |
P : Provisional.
Note :
The figures for 2006-07, which include country-wise distribution of petroleum imports,
are not strictly comparable with the data for previous years.
Source : DGCI & S. |
|


