 IST,
IST,


State of the Economy
|
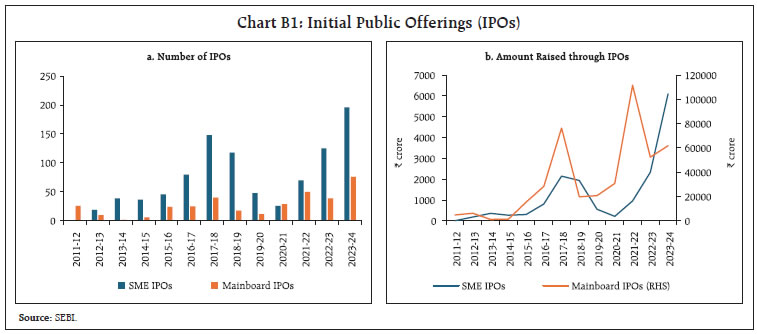
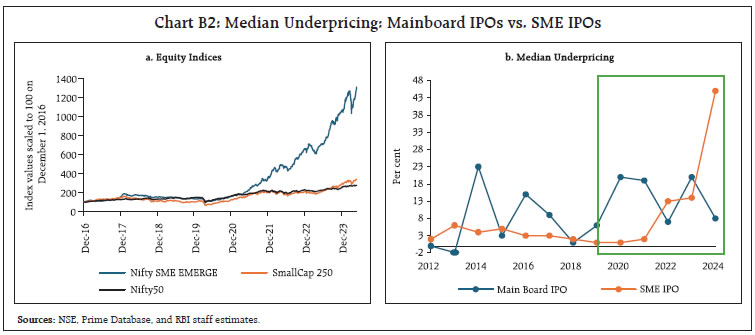
Global economic activity appears to be strengthening across advanced economies (AEs) and emerging market economies (EMEs) and global trade in goods and services is gathering momentum. Monetary policy divergence is setting the tone for global economic developments. In India, the second quarter of 2024-25 has begun with signs of quickening momentum in the economy. The improvement in the outlook for agriculture and the revival of rural spending have turned out to be the bright spots in the evolution of demand conditions. Consumer price inflation ticked up in June 2024 after three consecutive months of moderation as a broad flare-up in vegetables prices halted the overall disinflation that had been underway. Introduction Since the June 2024 edition of the State of the Economy, global economic activity appears to be strengthening across advanced economies (AEs) and emerging market economies (EMEs). According to the World Bank, economic surprise indices suggest that activity is exceeding expectations on the upside for AEs and by a greater margin among EMEs. Sentiment indicators also indicate that economic conditions and expectations remain solid. In terms of purchasing managers’ indices, EMEs continued to outperform AEs for a second straight year, with India ahead of the rest on the back of robust growth expectations. Labour markets are easing from historically tight conditions and wage growth is slowing. On the other hand, the Bank for International Settlement (BIS) has warned in its latest annual report that rising debt levels expose economies to extreme investor aversion and create a growing risk for the global economy. In its recent budget forecast, the US Congressional Budget Office (CBO) expects the US fiscal deficit to reach 7 per cent of GDP in 2024, exceeding its level during some recessions. The CBO states that deficits will stay high for years, and US debt held by the public will exceed 122 per cent of GDP in 2034. The largest economy of the world is cruising into an uncharted sea of federal debt. In this context, the BIS has advised central banks against lowering policy rates prematurely while underlining the importance of acting fiscally before the situation turns dire. Global trade is gathering momentum across goods and services, fuelled by positive trade dynamics in the US and strong export performance in Asia. The nowcast of the United Nations Conference on Trade and Development (UNCTAD) picked up a stronger positive momentum in the second quarter relative to the first quarter, projecting an approximate 2 per cent increase for the first half of 2024. If these trends hold over the rest of the year, global trade could reach almost US $ 32 trillion in 2024, although it is unlikely to surpass the record level (US $ 32.2) of 2022. While there is a regaining of pace in global merchandise trade, the robust upsurge in services trade appears to be getting over. Prices for traded goods are also ticking up, with faster growth in values than in volumes. Despite this uptick, the annual change in the price of traded goods is expected to remain negative. Persisting geopolitical tensions, rising shipping costs and muscular industrial policies remain downside risks. In particular, industrial policies are targeting both traditional and high growth sectors, leading to significant trade reallocations and increased supply concentration. The number of mentions of ‘industrial policy’ in the business press has surged. There is also a steep increase in industrial policy interventions worldwide, according to the International Monetary Fund (IMF). These policy interventions are being driven by geopolitical reordering, the need for transition towards renewable energy sources and the drive to leverage on significant technological advancements in computing power and artificial intelligence. Across AEs and EMEs, the focus is on support measures aimed at enhancing strategic industries, positioning domestic firms as key suppliers of low carbon products and bolstering the resilience of supply chains and critical products. From a trade perspective, these policy interventions seek import substitution while imposing restrictions on trade and facilitating vertical consolidation. Consequently, trade is negatively affected just when global demand in many targeted sectors is rising, such as in electric vehicles. The implications for the outlook are increased supply concentration, global trade fragmentation among major blocs and increased protectionism, trade costs and uncertainty. These developments are leading to a pessimistic environment for foreign direct investment (FDI) flows due to a fall in mergers and acquisitions (M&As) although greenfield investments in developing countries provide a bright spot as discussed in greater detail in Section IV. The global environment for FDI remains challenging in 2024, with multinational enterprises adopting a cautious approach to overseas expansion. Nevertheless, profit levels of these corporations remain high, boosted by reinvested earnings. Furthermore, financial conditions are easing, especially in AEs, brightening the prospects of project finance. Early indicators of greenfield project announcements are, however, still weak, according to the UNCTAD. Inflation is approaching targets, but the pace of disinflation has slowed somewhat. Among AEs, 2 per cent levels are being sighted albeit from some distance still. In most EMEs, inflation is steadying at or just above targets. Monetary policy divergence is setting the tone for global economic developments. The coalescence of views relating to the US Fed is not ‘if’ anymore but ‘when’. Fed fund futures are pricing in rate cuts of 60 basis points in the current calendar year, with the first action fully priced in for the September 2024 meeting of the FOMC. This follows in the wake of core personal consumption expenditure inflation hitting its lowest increase since 2021 in May 2024 and indications that the labour market is slackening. In further corroboration, consumer price inflation for June 2024 came in softer than expectations for both headline and core as section II elaborates. The last mile is evidently getting shortened to the last lap.1 US yields and the broad dollar index fell sharply, bringing much awaited relief to the rest of the world. The mix of loose fiscal and tight monetary policies has so far made for a stronger US dollar, as the textbooks predict. As policy rates are lowered in step with inflation receding, the policy mix will likely be less dollar positive. In the UK, inflation finally reached the target of 2 per cent in May but this did not result in a rate cut. The Bank of Canada, which kickstarted rate cuts, may hit a pause in its July meeting. Among EMEs, the first movers are moderating the pace of easing while others like Indonesia, and also countries like South Korea and Singapore are holding rates steady, and some struck a more hawkish tone, such as Russia. Relative to the start of the year, market participants now expect greater policy rate divergence among countries. Financial conditions have remained broadly unchanged. EME currencies generally weakened against the US dollar amidst notable volatility. Decreasing policy rate differentials vis-à-vis the United States, combined with the unwinding of carry trades have contributed to some slowdown in portfolio inflows into EMEs as a group. According to the World Gold Council, 30 per cent of the world’s central banks will add to their gold reserves in 2024 on top of 1037 tonnes added in 2023, reflecting waning of confidence in the US dollar and a bid to rebalance to a more preferred strategic level of gold holdings. After a blockbuster first half when EME governments and corporates sold a record US$321 billion of bonds denominated in hard currencies2, the second half of 2024 is showing signs of issuers catching their breath in view of mounting political risk in financial capitals. In terms of funding needs for the year, it estimated that 80 per cent has already been covered. US dollar denominated bonds issued by EMEs have handed holders a 2.2 per cent gain so far due to surging yields on pared back expectations for US rate cuts. This performance is roughly in line with US high-yield corporate bonds. The United Nations’ Sustainable Development Goals (SDGs) Report 2024 released on June 28 has pointed out that with just six years to go for achieving the SDGs by 2030, progress remains uneven, slow and mostly elusive. Only 17 per cent of the SDGs are on track while nearly half show minimal or moderate progress and over one-third are stalled or regressing. In the words of the UN Secretary General Mr. Antonio Guterras, “Our failure to secure peace, to confront climate change and to boost international finance is undermining development”.3 Meeting the goals over the next six years will require a massive scaling up of investment, particularly in developing countries where the investment gap is estimated to be around US $ 4 trillion per year. The 2024 report card is not without some glimmers of hope. Illustratively, mobile broadband is accessible to 95 per cent of the world. The most remarkable is the progress in deploying renewable energy which currently constitutes 30 per cent of the world’s electric supply. On June 21, 2024, the northern hemisphere experienced the summer solstice when the sun rose to its highest point in the sky. It marked the cusp of a silent revolution which emits no fumes, uses no earthly resources, costs virtually nothing but provides what makes the world go round – power. The solar revolution, powered by tiny photovoltaic cells made of silicon with an electrical circuit with 60-72 of them packed into panels that cover less than 10,000 square kilometres worldwide, produced about 6 per cent of the world’s electricity in 2023. In 2024, about 70 billion cells will be produced, resulting in 520-655 gigawatts (GW) of installed capacity which is doubling every three years and rising ten-fold each decade. Solar panels are currently the largest category of investment in electricity generation, estimated at US $ 500 billion in 2024 by the International Energy Agency (IEA). According to the International Solar Energy Society, solar power will generate more electricity than all the world’s nuclear power plants in 2026, all wind turbines by 2027, all dams by 2028, all gas-fired power plants by 2030 and all coal-fired ones by 2032. Solar energy is poised to become humankind’s largest source of primary energy–not just electricity–by the 2040s.4 The way forward will be innovations that include long-distance connections; storage (especially batteries); and new avenues of increasing overall demand for solar energy. Furthermore, much of the growth of solar power has been driven by China, the US and the northern Europe. It is time to turn for production to the global south which has a lot of empty land, better access to sunshine and much more unmet demand. In the not-too-distant future, a substantial portion of solar power would be used for producing green hydrogen which can be used as a way of storing energy for longer periods of time than batteries offer, but the hurdle that has to be overcome is prohibitive costs of electrolysis that splits hydrogen from water. It is in this context that India assumes importance. Home to some of the world’s largest solar developers, with a capacity more than two-thirds as large as that which Germany has installed over the past 25 years, India accounts for 5.2 per cent of global solar capacity at 84 giga watts (GW), the fifth highest. Solar installed capacity has grown at a compound annual growth rate (CAGR) of 24.1 per cent vis-à-vis 1.6 per cent in coal power during 2017-18 to 2023-24. Solar power generation accounts for 6.7 per cent of total electricity and 28.4 per cent of renewable electricity, respectively. The decline in the cost of solar modules is contributing to a sustained rise in solar capacity additions - the solar tariff at ₹2.54/unit is lower than those for new coal power plants (₹5-6/unit). Going forward, investments are required in energy storage to ensure grid stability and round-the-clock power supply, which increases the overall costs of solar power. According to the IEA, the levelised cost of electricity (LCOE) for solar photovoltaic (PV) modules combined with battery storage in India has already become more competitive than new coal-fired plants and is expected to decrease further. India aims to produce 5 million metric tonnes per annum (MMTPA) of green hydrogen by 2030 under the National Green Hydrogen Mission with an associated renewable energy capacity addition of about 125 GW. Subsidies are being offered to households for installing rooftop solar panels. An additional 85 GW capacity under various stages of construction will enhance India’s solar capacity in the next few years. Exports of solar cells and modules have increased in recent years, particularly to the US. At present, India is a net importer of solar cells and modules as it is yet to achieve substantial capacity in the production of solar cells. Once the production capacity from the production linked incentive (PLI) and other manufacturing projects becomes operational, India will become the world’s second-largest producer of solar modules, boasting substantial manufacturing capabilities across the entire value chain. The second quarter of 2024-25 has begun with signs of quickening momentum in the Indian economy. After stalling and delivering deficient rains in June, the southwest monsoon has picked up pace in July, covering the entire country ahead of schedule for the seventh time in the past 12 years, the details of which are further elaborated in Section III. In the first half of July, a surplus precipitation has wiped out the June deficit. The India Meteorological Department (IMD) expects the monsoon to become even more vigorous and exceed the long period average over the full month. Water storage in major reservoirs has increased for the first time in 39 weeks as on July 04, 2024. Kharif sowing has gathered pace, exceeding the acreage a year ago (see section III for details). At this rate, the normal sown area is likely to be surpassed this year. Intensified activity on farms has eased the demand for work under the MGNREGS. El Nino is currently neutral and sea surface temperatures are cooling. The Australian Bureau of Meteorology has indicated that La Nina, which leads to heavy rainfall in India and all over Asia will likely emerge after August, portending an extended monsoon and prolonged precipitation. The improvement in the outlook for agriculture puts the spotlight on what is shaping up to be the bright spot of the evolution of demand conditions in 2024-25 – the revival in rural spending that is outpacing urban segments. As a result, the rural-urban divide is narrowing, as the recent monthly per capita consumption expenditure (MPCE) survey of the NSSO highlights. This is on the back of rising fiscal transfers, increase in the wage rate as typified by the MGNREGS and the rising volumes of remittances to rural households due to urban migration. These are some of the proximate factors that are boosting the effective spending power of rural households. Consumption patterns revealed in the survey shows that 46.4 per cent of expenditure in rural India is on food, while it was 39.2 per cent for urban families. Within the rural food basket, the share of cereals has dropped and that of beverages, processed foods, milk, meat and eggs has picked up. It is remarkable that the share of conveyance, medical expenses and consumer services exceeds that of cereals in the rural MPCE. These developments have spurred hope that rural India is catching up with its urban counterpart and convergence can be envisaged. A sobering feature is the gap between growth in MPCE at current and constant prices for both rural and urban, reflecting the toll that the burden of inflation has taken over the years. The rural recovery is yielding better results for companies in the fast moving consumer goods (FMCG) segment, with earnings upgrades boosting stock valuations. This is reflecting improvement in sales volumes as inflation haltingly moderates. The green shoots are slender since rural wages remain muted, although the increase in minimum support prices is seen as supporting farm incomes. Most FMCG companies expect revenues to expand in high single digits, supported by cost saving initiatives and advertising and promotion spends. In the personal care and home care segments, the catalyst is premium offerings which are expanding operating margins. Scorching heatwave conditions this year have also pushed sales of summer-specific FMCGs such as bottled soft drinks to a new high. Fabric softeners and washing liquids have achieved higher levels of penetration. Private research firms tracking household consumption are anticipating a broader rural led recovery in the second half of 2024-25.5 Manufacturing is gaining pace, with the purchasing managers’ index (PMI) having exceeded its long run average in June on the back of new orders. Manufacturing is a key pillar of the drive towards achieving higher levels of development, with its share needing to reach 20-25 per cent of GDP in order to establish India as a global manufacturing hub. This will boost employment in crucial sectors such as electronics, pharmaceuticals, textiles and automobiles while giving Indian products an internationally competitive cutting edge. Federally inclusive policies for manufacturing, focusing on infrastructure and logistics, ease of and cost of doing business, research and development promoting innovation and an aggressive export orientation will carry Indian manufacturing towards that aspirational goal. In one industry, India’s efforts to transform into a manufacturing powerhouse are already bearing fruit – electronics manufacturing. The value of electronics produced rose from $37bn to $115bn (3 per cent of GDP) between 2015-16 and 2023-24. The near-term objective is to triple production by 2025-26. Currently, India’s production of electronics accounts for 3 per cent of the global total, with this share growing faster than any other country’s. In 2023-24, India exported US $ 29 billion of electronic goods and US$ 5.6 billion in the first two months of 2024-25. The production of phones makes up nearly half of India’s electronics industry, making it the world’s second-largest producer. In 2015-16, India imported almost four-fifths of its phones. It now imports barely any. In 2023-24, it exported US$ 15.6 billion of mobile phones and US$ 1.5 billion in April 2024. Apple sources about one in seven of its iPhones from India, double what it did a year ago. Samsung, a South Korean rival, has its largest phone-making facility in India.6 Expanding manufacturing footprint is also key to boosting the share of India’s exports from the current level of 2.4 per cent of world exports to at least 5 per cent, goods and services taken together.7 On the back of exports of close to US $ 780 billion in 2023-24 and a cumulative rate of expansion of 10.2 per cent in the first quarter, India is better prepared in 2024-25 to achieve exports of over US$ 800 billion, according to the Ministry of Commerce and Industry. This will warrant rebooting labour-intensive exports which were muted in the year gone by; promoting exports from MSMEs which contribute about 45 per cent of India’s total exports, 38 per cent of manufacturing output and are the second largest employer after agriculture with 110 million people employed; and diversifying services exports away from software, IT and business to other categories which represent 64 per cent of world exports but in which India has a share of only 1.9 per cent of the global market. Prioritising e-commerce exports to take them from current levels of US $ 4-5 billion to about US$250-300 billion by 2030 will overcome the barriers and geopolitical challenges restraining traditional exports. Ports will play a vital role in achieving the goals set for India’s merchandise trade. The Vadhavan port on the coast of Maharashtra is a step in the direction of setting up all weather deepwater mega ports. It will have nine container terminals, four multipurpose berths including a coastal berth, four liquid cargo berths, a berth for roll on roll off ships and a coast guard berth. It is intended to create a cumulative cargo handling capacity of 298 MTA, including 23.2 TEUs of container handling capacity. Container ships currently handle 16 per cent of the world’s maritime trade. This warrants upscaling container handling capacity from the current 20 million TEUs. Rising optimism about India’s growth prospects, strong profit growth and the return of buying support from foreign portfolio investors across sectors, including through issuances of participatory notes, propelled equity markets to scale fresh peaks in June and July. The rallies in July have been led by banking and technology stocks. The rebalancing of the MSCI index has raised India’s share to 18 per cent, up from 8 per cent in 2020, and a valuation gap relative to peer EMEs is widening. Small and mid-cap stocks are running ahead of earnings and are outperforming large cap peers. The share of mutual funds in the overall institutional equity assets under management hit a record at the end of June 2024, suggesting that the current momentum in equity prices may perhaps be sustained. Along with the secondary market, the primary market is buzzing with energy. The first half of 2024 has turned out to be the best first half for initial public offerings (IPOs) in 17 years, and deal sizes are getting bigger (Box 1, Section IV). This suggests that companies are actively securing fresh capital to fortify their balance sheets in preparation of fresh capacity addition. In step, the tide of start-up funding is turning, with US$ 4.1 billion raised this year so far while the number of start-up IPOs has risen to 17. Renewables IPOs are booming as investors eye surging returns in the solar power sector. Venture capital deals are rising after a lull, finally deploying the dry powder in the form of unallocated capital they have been sitting on that is pegged at US$ 8-10 billion for India. So far, secondary stake sales and buyouts have dominated this space, and late-stage activities are picking up pace. Fintech funding has seen a substantial downturn in spite of record disbursement of loans and increases in the loan size. An uptick in large cost take-out deals could improve the environment for IT services companies. Multinational corporations (MNCs) are exploring options to list in India through IPOs to unlock value and help their parents raise capital. This is in keeping with the relatively attractive valuations at which MNC stocks are trading relative to domestic counterparts. Some MNCs are also encashing on the stock market’s performance by divesting stakes. In the foreign exchange market, the rupee has begun to gain in July on the back of strong capital inflows, barring intermittent corrections, in spite of increase in the trade deficit and firming international crude prices weighing on the downside. Despite volatility triggered by spillovers over market expectations relating to the future course of monetary policy and a fluctuating US dollar (DXY), the rupee is trading in a tight range. Currency hedging costs have accordingly become lower than earlier. The euro is being reportedly preferred as the currency to fund long rupee carry trade. Ahead of the inclusion of Indian sovereign bonds in the JP Morgan index, foreign portfolio investors have increased their ownership of these bonds by over US $ 10 billion. Foreign banks have emerged as the largest investors, with their investments exceeding the value of net inflows into index-eligible bonds. Some of the world’s largest sovereign wealth funds have significantly increased their investments in India. Post inclusion, flows have been muted and yields have remained almost flat, indicative of steady flows in the months ahead rather than volatile surges. In the credit market, the share of low-cost current and saving deposits has largely bottomed out in the 39-40 per cent range in a steady decline from about 44 per cent in 2021-22. This is likely to squeeze banks’ net margins going forward and prompt repricing of deposit books. In fact, banks have been impelled to increase mobilisation of funds through certificates of deposits (CDs) in June ahead of the quarter end as illustrated in Section IV. Mutual funds are the main mobilisers of funds for investment in CDs. The Reserve Bank of India’s (RBI’s) semi-annual Financial Stability Report assessed that the financial system remains robust and resilient, with improved balance sheets of banks and financial institutions and sustained credit expansion. The capital to risk-weighted assets ratio (CRAR) and the common equity tier 1 (CET1) ratio of scheduled commercial banks (SCBs) stood at 16.8 per cent and 13.9 per cent, respectively, at end-March 2024. SCBs’ gross non-performing assets (GNPA) ratio fell to a multi-year low of 2.8 per cent and the net non-performing assets (NNPA) ratio to 0.6 per cent at end-March 2024. Return on assets (RoA) and return on equity (RoE) are close to decadal highs at 1.3 per cent and 13.8 per cent, respectively. Macro stress tests for credit risk reveal that SCBs would be able to comply with minimum capital requirements, with the system-level CRAR in March 2025 projected at 16.1 per cent, 14.4 per cent and 13.0 per cent, respectively, under baseline, medium and severe stress scenarios, well above the regulatory minimum. Non-banking financial companies (NBFCs) remain healthy, with CRAR at 26.6 per cent, GNPA ratio at 4.0 per cent and return on assets (RoA) at 3.3 per cent, respectively, at end-March 2024. At the system level, the CRAR of urban co-operative banks (UCBs) inched up to 17.5 per cent in March 2024. The CRAR of both NBFCs and UCBs remained well in excess of the prescribed regulatory minimum. The consolidated solvency ratio of the insurance sector remains above the minimum threshold limit of 150 per cent. Stress tests on mutual funds and clearing corporations attest to the resilience of these segments of the financial sector. Network analysis indicates that the total outstanding bilateral exposures between financial institutions are expanding, with SCBs holding the largest share. Every silver lining has a cloud. Data for June 2024 showed that consumer price inflation ticked up after three consecutive months of moderation as a broad flare-up in vegetables prices halted the overall disinflation that had been underway. This development reinforced the prescient warnings that some members of the monetary policy committee (MPC) expressed in their minutes relating to the June meeting : “With persistently high food inflation, … any hasty action …will cause more harm than good8; a watchful approach is appropriate to ensure that there are no spillovers of high food inflation to the prices of the other items in the consumption basket9; repeated incidence of food price shocks is delaying the final descent of inflation to the target10; repetitive occurrence (of intersecting food price shocks) calls for intensifying monetary policy vigil11.” The fight against inflation is far from over, as the concluding section elaborates. Set against this backdrop, the remainder of the article is structured into four sections. Section II covers the rapidly evolving developments in the global economy. An assessment of domestic macroeconomic conditions is set out in Section III. Section IV encapsulates financial conditions in India, while the last Section sets out concluding remarks. Global economic activity grew at a moderate pace in Q2:2024 amidst signs of easing labour market conditions and moderation in inflation. The International Monetary Fund (IMF), in its latest World Economic Outlook (WEO) update released on July 16, 2024, maintained the global growth forecast for 2024 at 3.2 per cent (same as its April 2024 projection) and revised the growth forecast up by 10 bps to 3.3 per cent for 2025 (Table II.1). Our model-based nowcast, augmented with the latest high frequency indicators, points to momentum being maintained in Q2 and during Q3:2024 (Chart II.1).  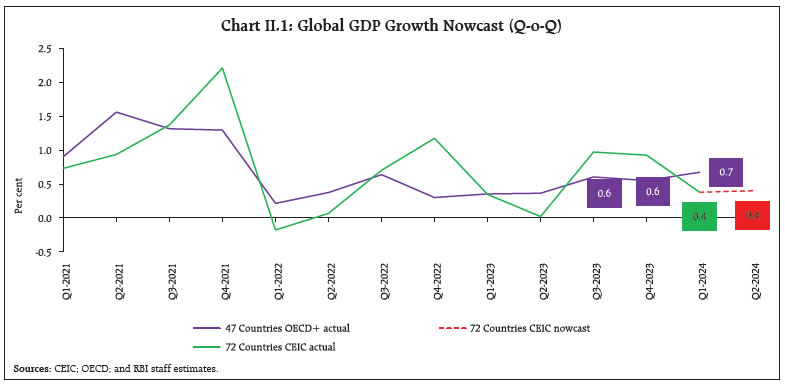 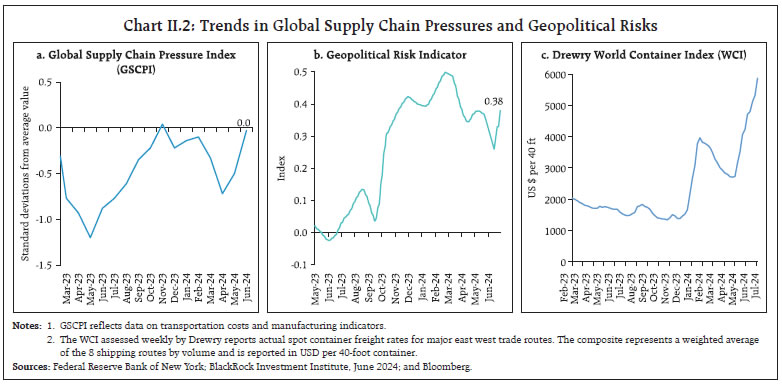 The global supply chain pressures index (GSCPI) recorded an uptick in June 2024, taking it closer to its historial average (Chart II.2a). The geopolitical risk index, which had undergone a marginal decline in the first half of June 2024, recorded an upswing thereafter, driven by the escalation of hostilities in the Middle East (Chart II.2b). Shipping costs maintained an uptrend as voyage transit times remained stretched due to disruptions in the Red Sea12 (Chart II.2c). Consumer sentiments in the US fell for the third consecutive month in June 2024 to their lowest since November 2023 (Chart II.3a). Sentiments also remained wary in the euro area on expectations that employment is likely to decline further. Financial conditions marginally eased in AEs while in emerging economies such as Brazil and China there was some tightening on account of heightened risk preception (Chart II.3b).  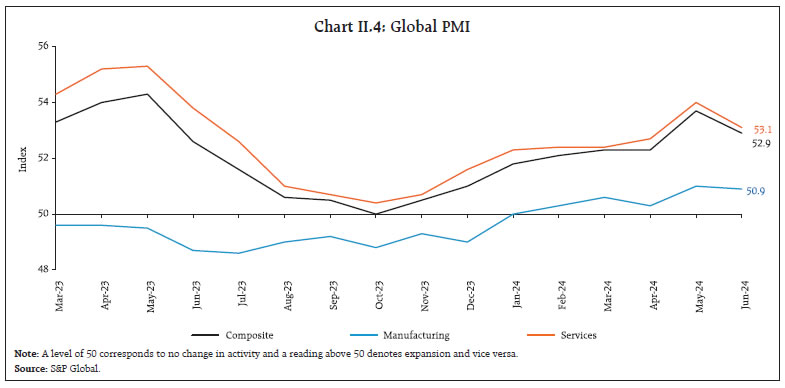 The global composite purchasing managers index (PMI) posted an expansion for the eighth consecutive month albeit with a sequential moderation to 52.9 in June from 53.7 in May. Rates of expansion eased month-on-month (m-o-m) for both manufacturing production and service sector business activity (Chart II.4). The global manufacturing PMI softened to 50.9 in June from May’s two-and-a-half year high while the services PMI slowed to 53.1 in June from 54.0 in May. Despite the sequential moderation, growth is becoming broad-based, with all 25 sub-sectors covered by the PMI recording an expansion (as evident in the Index value of above 50) in June 2024 for the first time since July 2021. 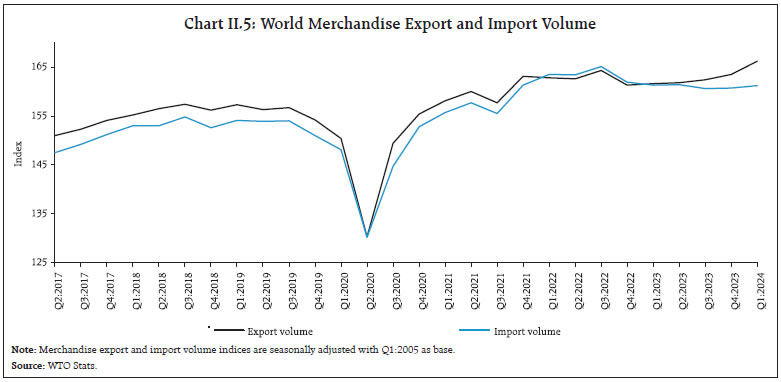 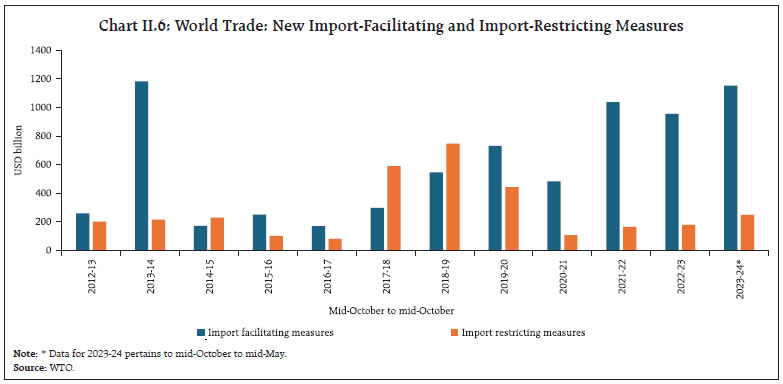 According to the latest World Trade Organisation’s (WTO) trade monitoring update13, world trade is expected to pick up gradually during 2024-25 following a larger than expected decline in 2023. World merchandise export volume grew by 2.8 per cent on a year-on-year (y-o-y) basis in Q1:2024 (Chart II.5). Although world merchandise import volume recorded a marginal contraction on a y-o-y basis, it grew sequentially. 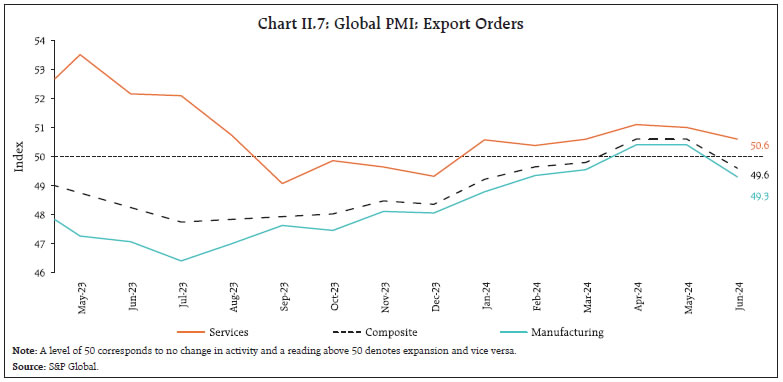 There has been an increase in the number of import facilitating trade measures in the year gone by, outpacing the growth in import restricting measures. With this shift holding up during 2024 so far, it could provide further support to the global trade recovery (Chart II.6). The composite PMI for export orders dipped in June, however, after remaining in expansionary territory over the previous two months. There was a moderation in both manufacturing and services export orders (Chart II.7). Global commodity prices have remained volatile. Lower agricultural commodity prices and industrial metal prices were partly offset by higher energy prices, resulting in the Bloomberg commodity index declining by 1.9 per cent (m-o-m) in June (Chart II.8a). Brent crude oil prices increased by 8.2 per cent, crossing US$ 85 per barrel in late June due to increased geopolitical risks as well as larger than expected decline in US crude oil inventory (Chart II.8b). The Food and Agriculture Organization’s (FAO’s) food price index remained steady (m-o-m) in June 2024 as an increase in the prices of vegetable oils (3.1 per cent) and sugar (1.9 per cent) were offset by a decrease in the price of cereals (-3.0 per cent). The index, however, stood 2.1 per cent below its corresponding value a year ago due to the decline in sugar and cereals prices on a y-o-y basis (Chart II.8c). Gold prices declined by 1 per cent in June (m-o-m), reflecting a stronger US dollar and weak seasonal demand (Chart II.8d). 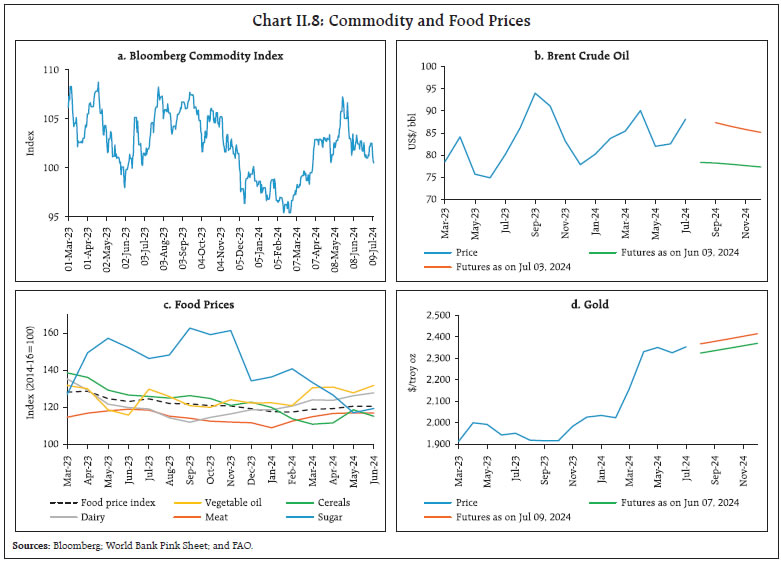 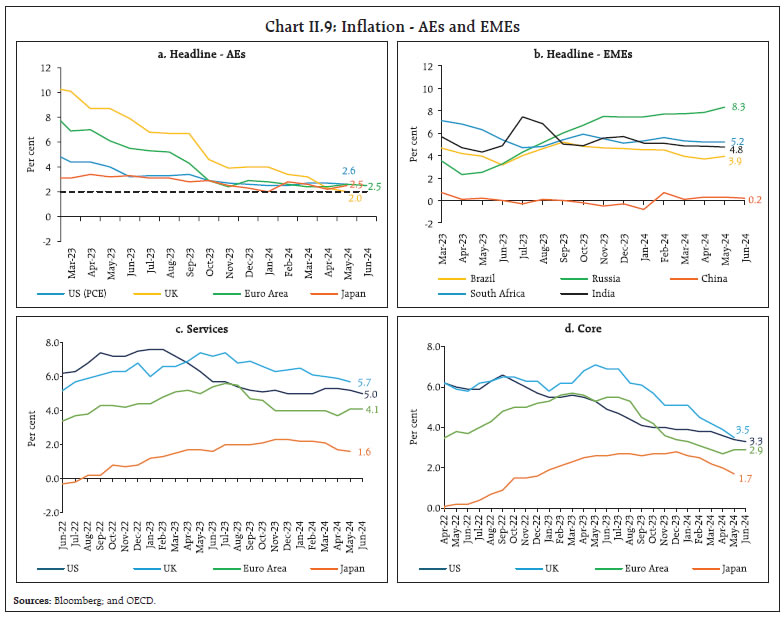 Headline inflation continued its gradual descent in most of the economies. In the US, CPI inflation moderated to 3.0 per cent (y-o-y) in June from 3.3 per cent in May, and the index recorded a m-o-m decline for the first time since May 2020 on the back of declining gas and automobile prices. The headline personal consumption expenditure (PCE) inflation also softened to 2.6 per cent in May from 2.7 per cent in April. As per flash estimates, euro area inflation edged lower to 2.5 per cent in June from 2.6 per cent a month ago, despite sticky core and services inflation. Inflation in Japan (CPI excluding fresh food) edged up to 2.5 per cent in May, while in the UK it softened to 2.0 per cent (Chart II.9a). Among EMEs, inflation increased in Brazil and Russia while it softened in China in June (Chart II.9b). Core and services inflation have been trending down in advanced economies although they remain higher than the headline in most of them. Global equity markets rallied in June, with the Morgan Stanley Capital International (MSCI) world index rising by 2.1 per cent as growing expectations of a sooner than anticipated US Fed rate cut sparked risk-on sentiment across stock markets (Chart II.10a). US government securities (G-sec) yields – both 10-year and 2-year – softened by 10 bps and 12 bps, respectively, in June as financial markets priced in weaker than expected labour market and business activity data14 (Chart II.10b). In the currency markets, the US Dollar strengthened by around 1 per cent in June due to its safe haven appeal. On the other hand, the MSCI currency index for EMEs remained range bound in June with volatile capital flows, mainly in the equity segment (Chart II.10c and II.10d).  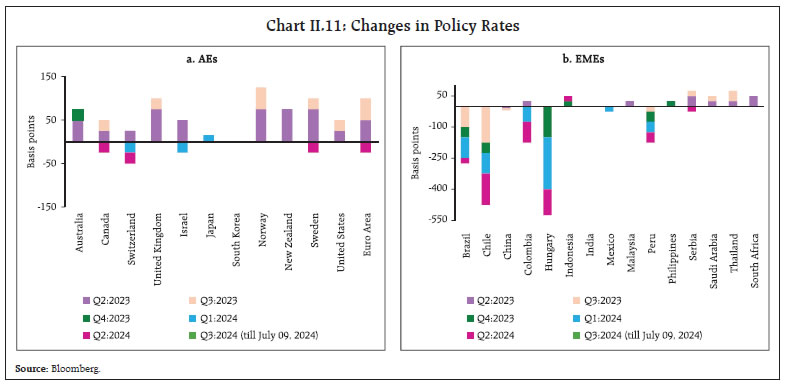 Amongst AE central banks, the Swiss National Bank reduced its benchmark rate for the second consecutive meeting by 25 bps in June to 1.25 per cent (Chart II.11a). Amongst EME central banks, Columbia continued on its easing cycle, cutting its key rate by 50 bps in its June meeting (Chart II.11b). Most other central banks have retained their policy rates in their latest meetings, although a few of them have offered forward guidance on upcoming rate cuts conditional on favourable data on inflation. The Indian economy sustained a strong growth momentum, despite geopolitical headwinds and some build-up of supply chain pressures (Chart III.1a). Using information available from a host of high frequency indicators, our economic activity index (EAI) projects that GDP growth in Q1:2024-25 is likely to turn out to 7.4 per cent (Chart III.1b and Chart III.1c). Aggregate Demand Domestic demand conditions have remained robust during Q1:2024-25 as evinced by movements in high frequency indicators. E-way bills grew by 16.3 per cent (y-o-y) in June 2024, with sequential growth, both inter- and intra-state (Chart III.2a). Toll collections increased by a strong 37.4 per cent (y-o-y) in June 2024 (Chart III.2b). 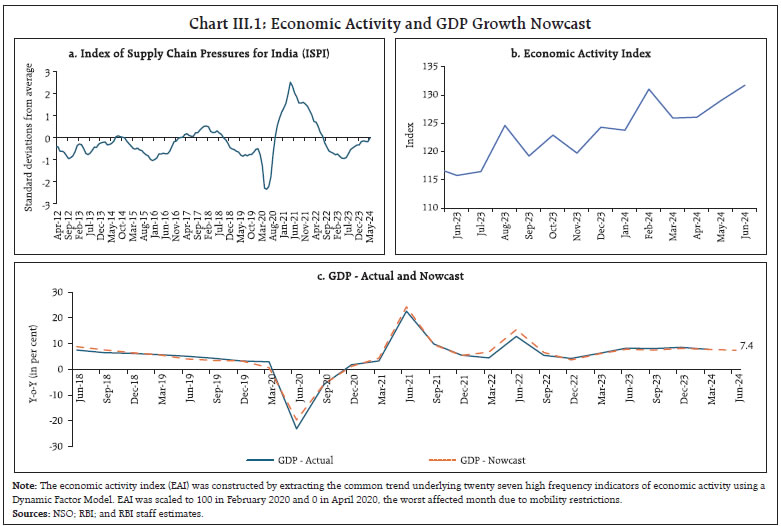 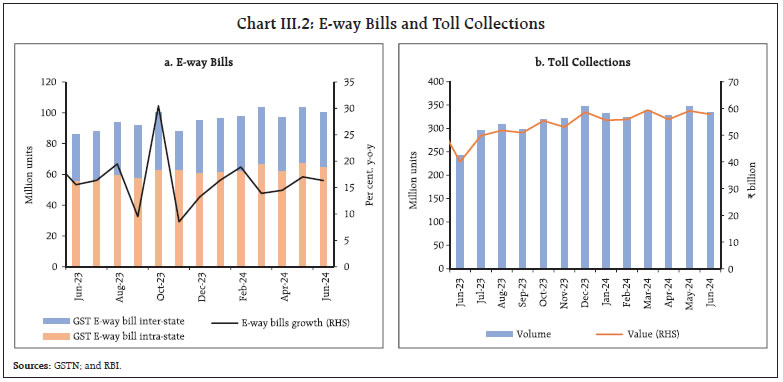 Automobile sales recorded a growth of 18.2 per cent (y-o-y) in June 2024, led by two-and-three wheelers followed by passenger vehicles, even as growth for entry level vehicles continued to remain weak (Chart III.3a). With improving farm sentiments, domestic tractor sales reached an eight-month high in June 2024, with total volumes surpassing the one-lakh mark (Chart III.3b) Vehicle registrations moderated in June 2024 in both non-transport vehicles and transport vehicles segments (Chart III.4a). Average daily petroleum consumption grew by 2.6 per cent (y-oy) in June 2024, driven by motor spirits (petrol) and aviation turbine fuel (ATF) [Chart III.4b]. 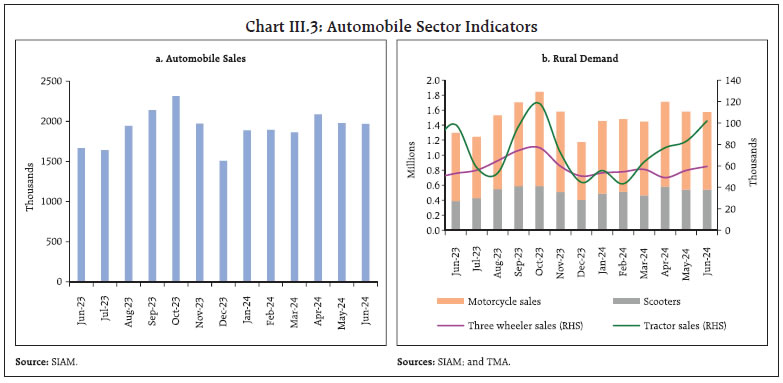 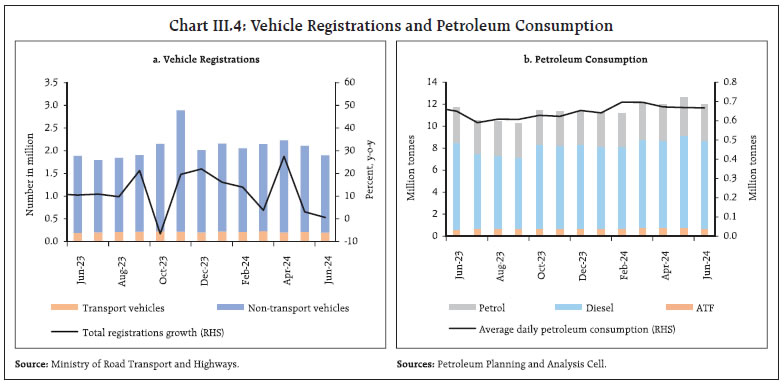 In the same month, organised manufacturing employment, as captured by the PMI employment outlook, recorded the fastest rate of expansion in over 19 years on the back of rising production. Services job creation expanded to its strongest level since August 2022, driven by a surge in new business (Chart III.5). Household work demand under the Mahatma Gandhi National Rural Employment Guarantee Scheme (MGNREGS) witnessed a marginal decline of 2.9 per cent (m-o-m) in June (Chart III.6). 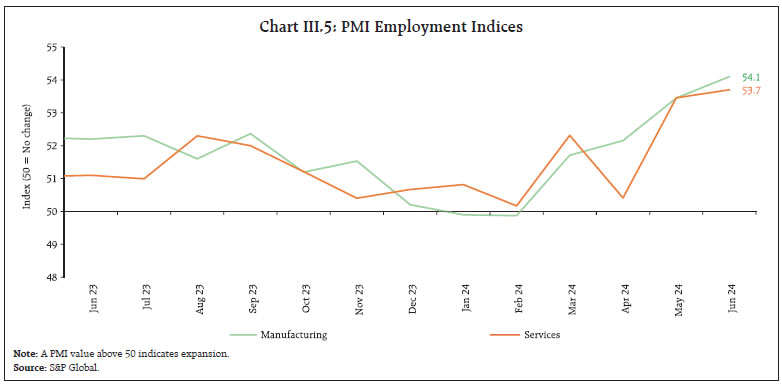  India’s merchandise exports at US$ 35.2 billion grew by 2.5 per cent (y-o-y) in June 2024 due to a favourable base effect, despite a sequential (m-o-m) decline (Chart III.7). The export expansion was broad-based, as 19 out of 30 major commodities (accounting for 62.6 per cent of the export basket) registered y-o-y increases. Engineering goods, electronic goods, drugs and pharmaceuticals, coffee, and organic and inorganic chemicals supported export growth in June, while petroleum products, other cereals, meat, dairy and poultry products, marine products, and gems and jewellery dragged down growth (Chart III.8). 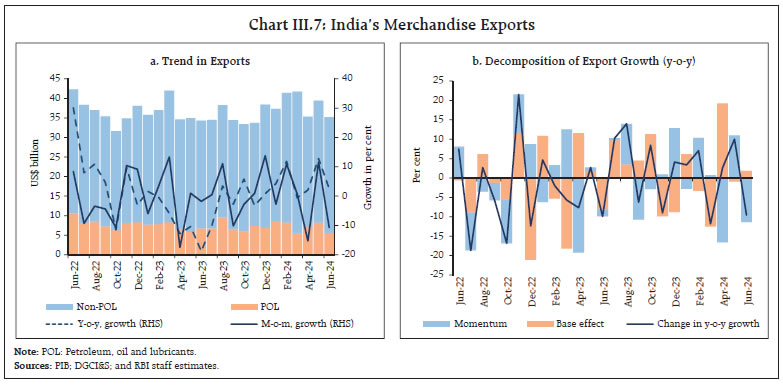 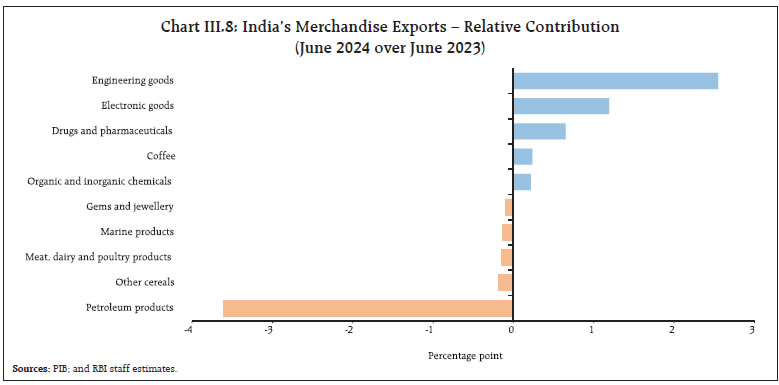 In Q1:2024-25, India’s merchandise exports expanded by 5.8 per cent to US$ 110.0 billion, primarily led by the drivers that were evident in the June 2024 outturn. Merchandise imports at US$ 56.2 billion expanded by 5.0 per cent (y-o-y) in June, aided by a positive base effect (Chart III.9). Among the 30 major commodities, 21 commodities (accounting for 71.8 per cent of the import basket) registered growth on a y-o-y basis in June. Petroleum, crude and products, electronic goods, non-ferrous metals, machinery, and artificial resins contributed positively, while gold, coal, fertilisers, pearls, precious and semi-precious stones and chemical materials and products were the main drags (Chart III.10). 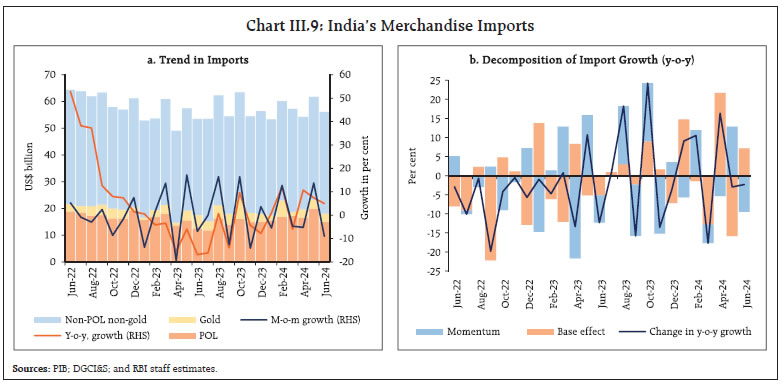 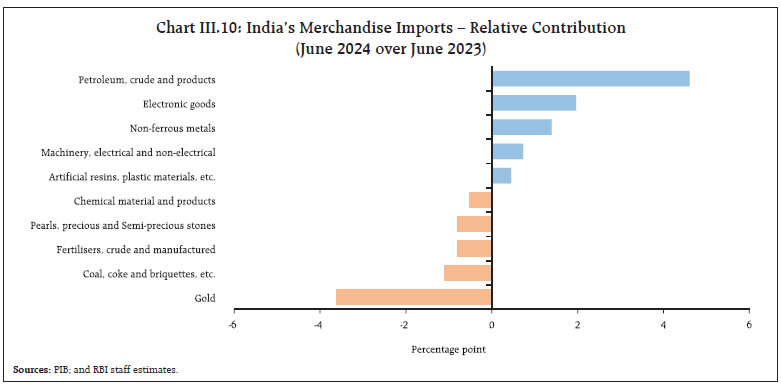 In Q1:2024-25, India’s merchandise imports increased by 7.6 per cent (y-o-y) to US$ 172.2 billion, mainly led by petroleum products, electronic goods, non-ferrous metals, vegetable oil and pulses. The merchandise trade deficit widened to US$ 21.0 billion in June 2024 from US$ 19.2 billion in June 2023. The share of POL in the total merchandise trade deficit declined to 45.4 per cent from 52.6 per cent in May 2024 (Chart III.11). 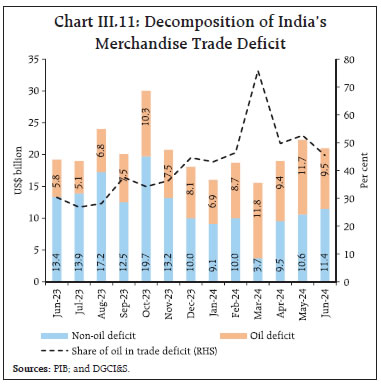 In Q1:2024-25, India’s merchandise trade deficit widened to US$ 62.3 billion from US$ 56.2 billion a year ago. Petroleum products were the largest source of the deficit, followed by electronic goods (Chart III.12). 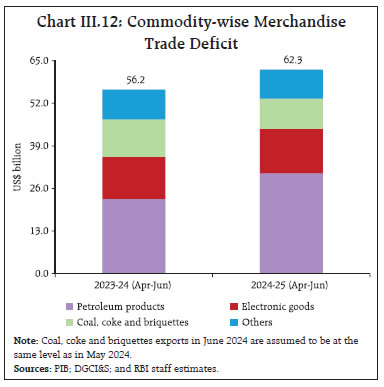 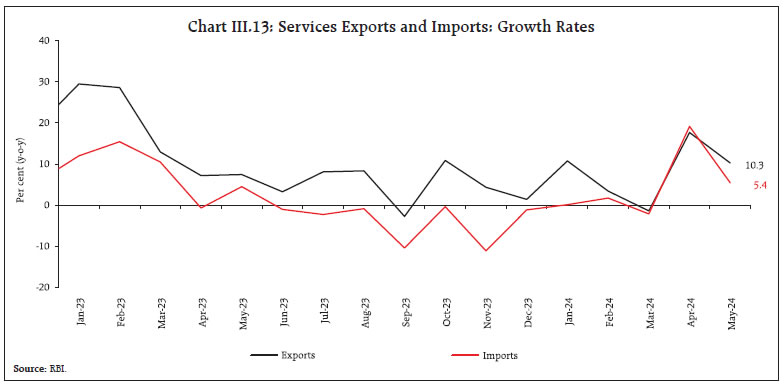 In May 2024, services exports at US$ 29.8 billion grew by 10.3 per cent (y-o-y), whereas services imports expanded by 5.4 per cent (y-o-y) to US$ 16.7 billion (Chart III.13). Consequently, net services export earnings rose by 17.1 per cent (y-o-y) to US$ 13.0 billion in May 2024. The key deficit indicators of the Union Government, viz., gross fiscal deficit (GFD), revenue deficit (RD) and primary deficit (PD) witnessed an improvement during April-May 2024 relative to the corresponding period of the previous year. The GFD came down to 3 per cent of the budget estimates (BE) as against 11.8 per cent of BE a year ago (Chart III.14a). Moreover, a fiscal surplus was posted in May 2024 after a gap of 22 months (Chart III.14b). This improvement in the financial position of the central government during April-May 2024 occurred on the back of a strong and broad-based growth in revenue receipts. On the other hand, the total expenditure of the central government remained flat at ₹6.2 lakh crore during April-May 2024 vis-à-vis the corresponding period of the previous year, mainly attributable to the model code of conduct enforced from March 7, 2024 to June 4, 2024 in the run-up to the general elections of 2024. 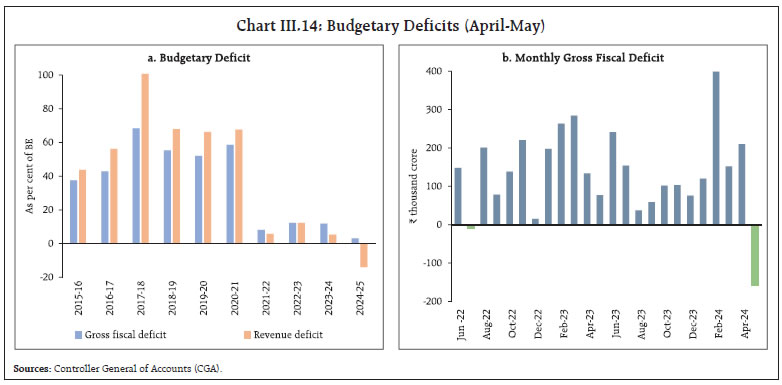 On the receipts side, gross tax revenue recorded a growth of 15.8 per cent during April-May 2024, with direct and indirect taxes registering y-o-y increases of 24.6 per cent and 8.0 per cent, respectively. Under direct taxes, corporation tax recorded a contraction of 19.8 per cent, but income tax increased by 41.6 per cent y-o-y. Under indirect taxes, GST collections and customs duty recorded a growth of 10.5 per cent and 3.8 per cent, respectively (Chart III.15a). Non-tax revenue receipts recorded a y-o-y growth of 86.9 per cent during April-May 2024 on the back of higher than budgeted surplus transfer from the Reserve Bank (Chart III.15b). On the other hand, non-debt capital receipts contracted by 30.2 per cent during April-May 2024. 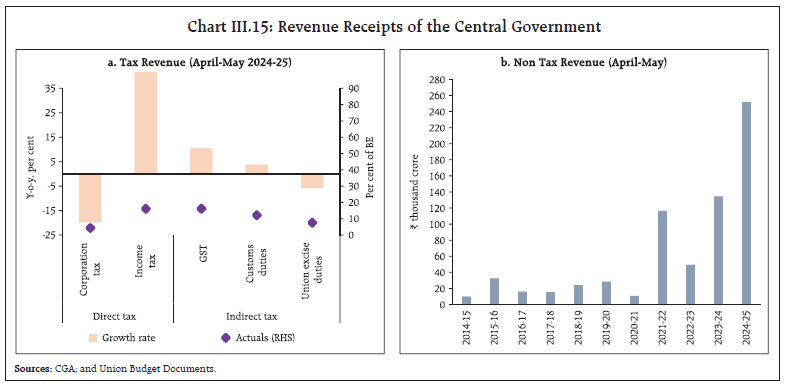 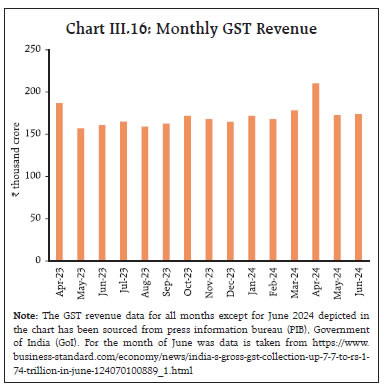 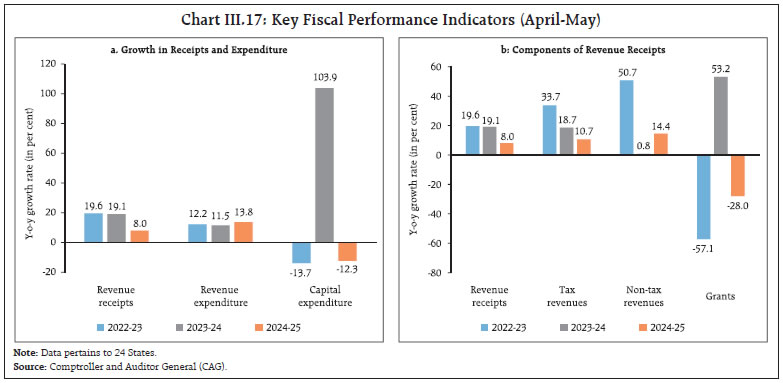 Gross GST collections (Centre plus States) for the month of June 2024 stood at ₹1.74 lakh crore15, growing at 7.7 per cent on a y-o-y basis (Chart III.16). The gross GST collections during April-June 2024 grew by 10.3 per cent to ₹5.57 lakh crore, reflecting buoyant economic activity, improved tax compliance and effective enforcement by tax authorities. As per the data available for April-May 2024, growth in States’ revenue receipts moderated, primarily due to slowdown in tax revenues and contraction in grants from the Union government. In contrast, non-tax revenue picked up sharply. On the expenditure side, revenue expenditure grew marginally, but capital expenditure contracted during April-May 2024 (Chart III.17). Within States’ own tax revenue, the growth in States’ goods and services tax (SGST) moderated from a high base while sales tax/VAT and state excise duties increased y-o-y (Chart III.18). 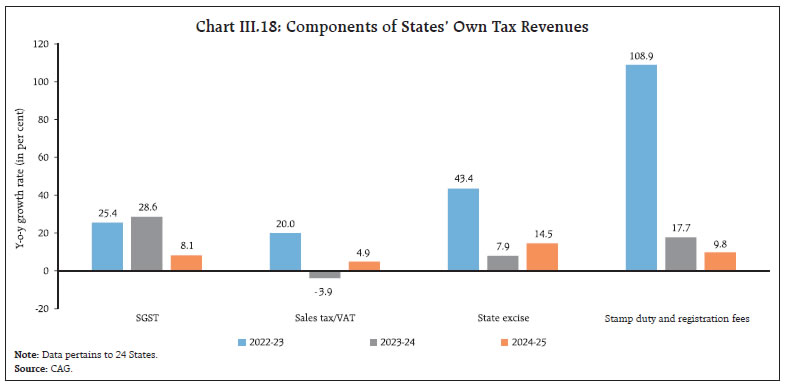 As in the previous year, the Union government has released an additional instalment of tax devolution to the States in June to accelerate capital spending. During April-June 2024, the total amount devolved to States has been ₹ 2.80 lakh crore as against ₹ 2.37 lakh crore a year ago.16,17 Aggregate Supply The southwest monsoon (SWM) covered the whole of India six days ahead of its normal date of July 08. The cumulative SWM rainfall during June 01- July 10, 2024 at the all-India level remained at its long period average (LPA) as compared with 2 per cent above the LPA during the corresponding period of the previous year. The gradual strengthening of Maden Julien Oscillation (MJO)18 and subsequent formation of a rain favouring low pressure system over northern Bay of Bengal towards the end of June helped the monsoon’s progress after a stall in mid-June (Chart III.19a). Consequently, the cumulative kharif sowing stood at 378.7 lakh hectares (as on July 5, 2024), 34.6 per cent of the full season normal acreage and 14.1 per cent higher than on the corresponding date of the previous year (Chart III.19b). Going forward, the Indian Meteorological Department’s (IMD’s) forecast of above normal rainfall during July in most parts of the country augurs well for replenishment of reservoir levels and further progress of kharif sowing (Charts III.20 and III.21). The higher cloud cover during July is also likely to bring down the temperature after intensified heatwaves since March. 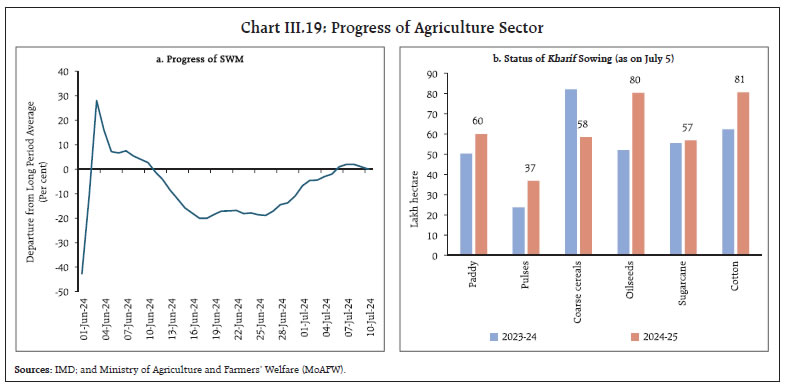 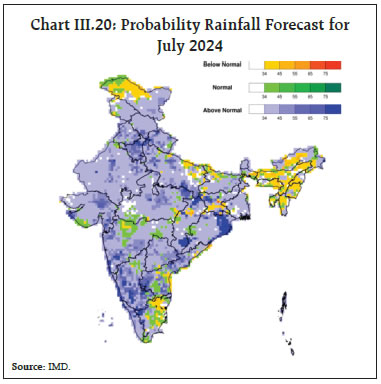 As of July 01, 2024 the buffer stocks of rice (including unmilled paddy equivalent) and wheat stood at 485.0 lakh tonnes (3.6 times the norm) and 282.6 lakh tonnes (at par with the norm), respectively. Public procurement of paddy till July 10, 2024 (at 521.9 lakh tonnes) remained 8.2 per cent below its level on the corresponding date of the previous year. Wheat procurement was 1.5 per cent higher than a year ago at 266.0 lakh tonnes, but lower than the season’s procurement target of 300-320 lakh tonnes. Accordingly, the Centre has imposed a pan India stock limit on wheat with immediate effect on June 24, 2024 till March 31, 2025 across traders, wholesalers, retailers and processors. Further, open market sale of wheat are planned from August 01, 202419. Similarly, stock limits have also been imposed on tur and chana, including kabuli chana, with effect from June 21 until September 30, 2024. 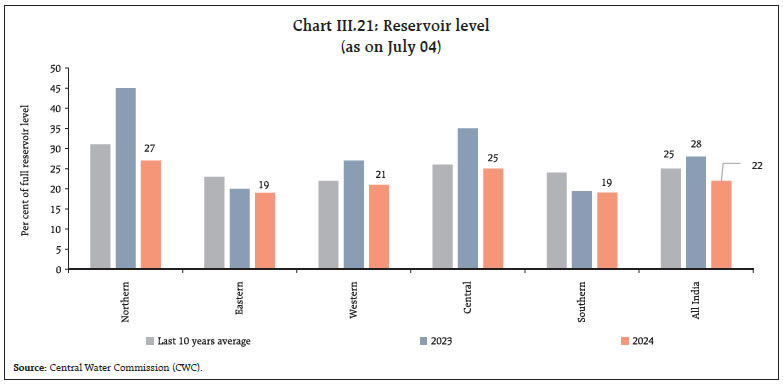  Minimum support prices (MSPs) were announced for 14 major kharif crops for the marketing season 2024-25 (Oct-Sep) on June 19, 2024. The MSPs have been revised upwards in the range of 1.4 per cent to 12.7 per cent (Chart III.22). For most of the crops, the increase is in line with the rise in cost of production. India’s manufacturing PMI reading rose to 58.3 in June 2024 due to an uptick in new orders and output (Chart III.23a). The PMI for services increased to 60.5 in June 2024 from 60.2 in May. Future activity (business expectations), however, fell to an 11-month low owing to market uncertainty and price competition (Chart III.23b).  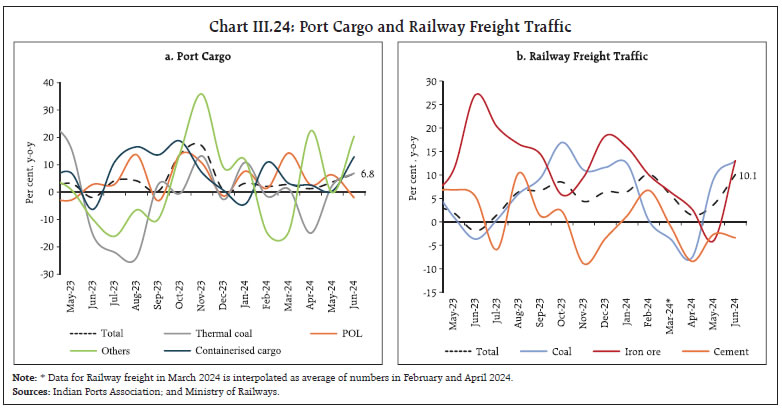 Indicators of freight transport remained bouyant in June 2024. Traffic at major ports recorded an expansion of 6.8 per cent, led by containerised and other miscalleneous cargo (Chart III.24a). Railway freight traffic also accelerated in June, driven by a surge in coal and iron ore traffic (Chart III.24b). The construction sector showed mixed signals as steel consumption recorded 19.1 per cent y-o-y growth in June 2024, while cement production has been on a declining trajectory for the last two months (Chart III.25). 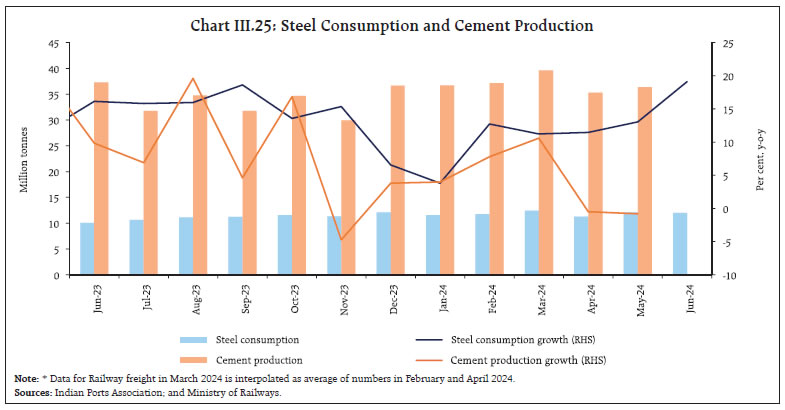  Available high frequency indicators for the services sector reflect the resilience of economic activity in June 2024 (Table III.I). Inflation Headline inflation, as measured by y-o-y changes in the all-India consumer price index (CPI)20, edged up to 5.1 per cent in June 2024 from 4.8 per cent in May (Chart III.26). The 28 bps increase in inflation came from a positive momentum of 133 bps, which more than offset a favourable base effect of 106 bps. The m-o-m increase in overall CPI was on account of positive momentum of 269 bps in food, 6 bps in fuel and 12 bps in core group (i.e., excluding food and fuel). Food inflation (y-o-y) firmed up to 8.4 per cent in June from 7.9 per cent in May as the positive price momentum more than offset a favourable base effect. In terms of sub-groups, inflation edged up in cereals, milk and products, fruits, sugar and prepared meals while meat and fish, eggs, pulses and spices registered a moderation. Vegetable prices continued to record a double-digit y-o-y increase. Edible oils and fats recorded a lower rate of deflation (Chart III.27).  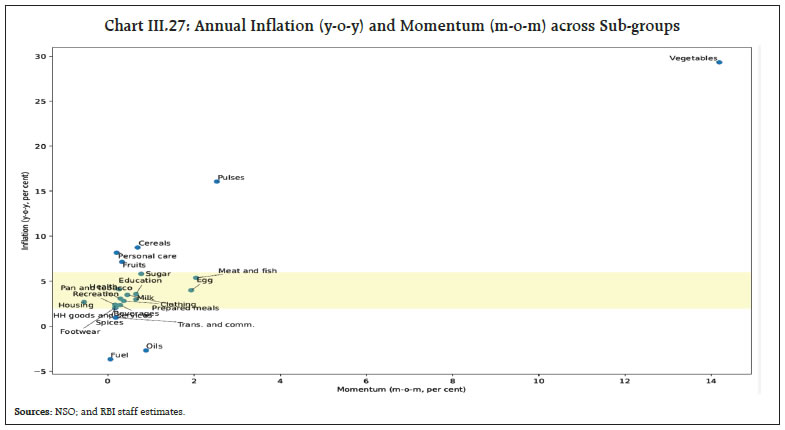 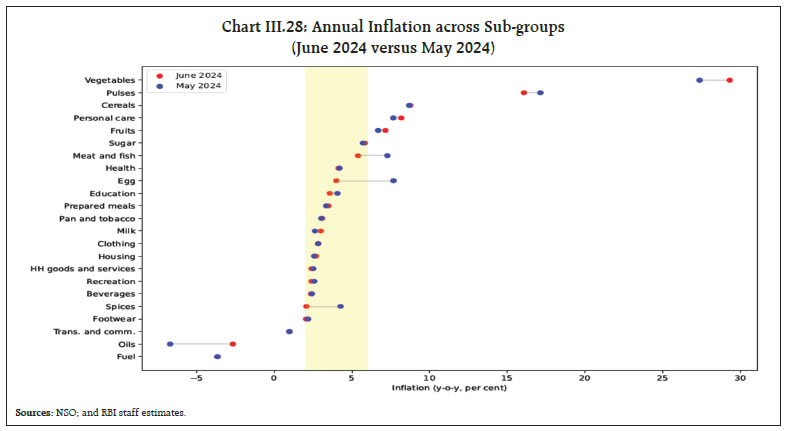 Fuel and light deflation remained unchanged at (-)3.7 per cent in June. While growth in kerosene and electricity prices moderated, deflation in LPG prices continued. 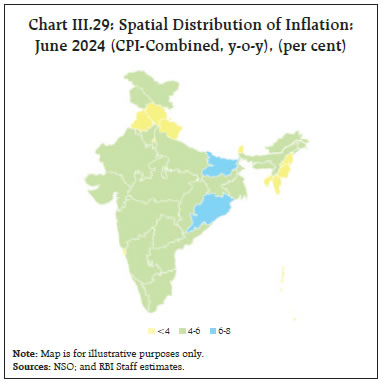 Core inflation remained unchanged at 3.1 per cent in June. In terms of sub-groups, inflation edged up in pan, tobacco and intoxicants, housing and personal care and effects, while it registered a softening in respect of household goods and services, health, recreation and amusement, and education, and remained steady in clothing and footwear, and transport and communication (Chart III.28). In terms of the regional distribution, rural inflation stood at 5.7 per cent in June 2024, higher than urban inflation at 4.4 per cent. Majority of the states registered inflation less than 6 per cent (Chart III.29). High frequency food price data for July so far (up to 12th) show that cereal prices increased, mainly driven by wheat. Pulses prices also registered an increase, mainly due to gram and arhar/tur. Edible oil prices too recorded increases, especially mustard and groundnut oils (Chart III.30).  Amongst key vegetables, tomato, onion and potato prices recorded sequential upticks in July so far (Chart III.30c). This has been mainly driven by a notable decline in arrivals, possibly reflecting the impact of weather anomalies like heatwaves and unseasonal rains21 in major production areas (Chart III.31).  Retail selling prices of petrol increased while those for diesel declined at the margin in July so far (up to 12th) as prices changed in Mumbai and Kolkata.22 Kerosene prices registered a marginal increase while LPG prices were kept unchanged (Table III.2). The PMIs for June 2024 indicated moderate increases in input costs across manufacturing and service firms. Selling prices, on the other hand, increased in the manufacturing sector while they eased for the services sector (Chart III.32). After remaining in surplus in the early part of June 2024, system liquidity turned into a deficit in the second half of the month due to advance tax payments and goods and services tax (GST) related outflows amidst sluggish government spending. It again turned into surplus from June 28, 2024 with the usual drawdown in government cash balances at the month-end. Reflecting these shifts, the average daily net injection under the liquidity adjustment facility (LAF) averaged ₹0.12 lakh crore during June 16 – July 10, 2024 as against ₹0.73 lakh crore during May 16 – June 15, 2024 (Chart IV.1). During June 16-28, 2024 the Reserve Bank injected liquidity into the banking system through four fine-tuning variable rate repo (VRR) operations of 3 to 6 days maturity, cumulatively amounting to ₹2.75 lakh crore to augment system liquidity. The demand for funds was robust as reflected in the high bid-cover ratios for these operations. The Reserve Bank conducted a 3-day VRR auction on June 28 instead of its main operation as it expected liquidity conditions to flip and improve significantly. Liquidity conditions did turn into surplus at end-June and July (up to July 10). Accordingly, the Reserve Bank conducted eight variable rate reverse repo (VRRR) auctions of overnight to 4 days maturity in July, cumulatively absorbing ₹2.17 lakh crore from the system.  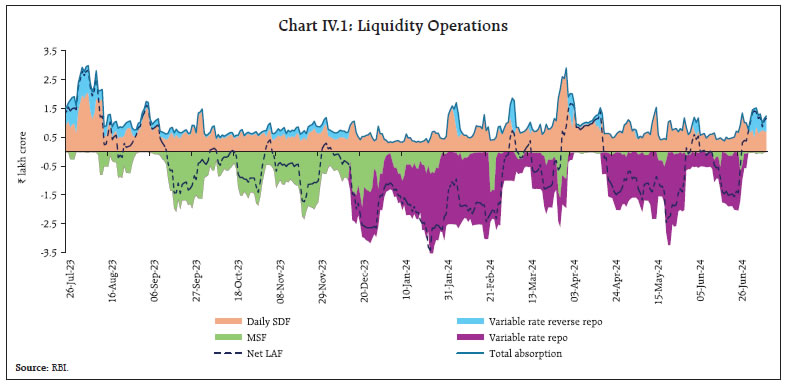 Borrowings under the marginal standing facility (MSF) increased to a daily average of ₹12,440 crore during June 16 to July 10, 2024 as compared with ₹10,910 crore during May 16 to June 15, 2024. Of the average total absorption at ₹0.88 lakh crore during June 16 to July 10, 2024, the placement of funds under the standing deposit facility (SDF) constituted 76 per cent as compared with 94 per cent during May 16 to June 15, 2024. The remaining amount was mopped up through fine-tuning VRRR operations. The weighted average call rate (WACR) – the operating target of monetary policy – broadly remained in the middle of the LAF corridor and averaged 6.59 per cent during June 16 to July 10, 2024 as compared with 6.57 per cent during May 16 – June 15, 2024 (Chart IV.2a). Rates in the collateralised segment – the triparty and market repo – moved in tandem with the WACR. On an average basis, the triparty repo rate was same as the policy repo rate and market repo rate traded 4 bps above the policy repo rate during June 16 to July 10, 2024 (Chart IV.2b). Across the term money market segment, yields on 3-month treasury bills (T-bills) and rates on certificates of deposit (CDs) softened while those on commercial paper (CP) for non-banking financial companies (NBFCs) remained stable during June 16 to July 10, 2024. The yield on 3-month T-bills softened in response to reduced supply in June 2024. The average risk premia in the money market (3-month CP minus 91-days T-bill) hardened to 99 bps during June 16 – July 10, 2024 from 92 bps during May 16 – June 15, 2024. Furthermore, the term spread (10 year G-Sec yield minus 91-days T-bill rate) widened to 20 bps during June 16 – July 10, 2024 from 14 bps during May 16 – June 15, 2024. 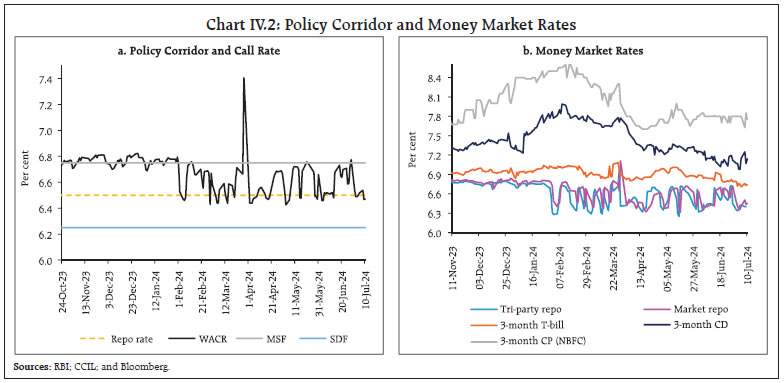 In the primary market, fund mobilisation through issuances of CDs picked up momentum in May-June following a slack in April. Banks issued CDs worth ₹2.65 lakh crore during 2024-25 (up to June 28), higher than ₹1.45 lakh crore in the corresponding period of the previous year (Chart IV.3). A decline in short term rates in June prompted banks to increase CD issuances to meet funding gaps. Issuances of CPs at ₹3.8 lakh crore during 2024-25 (up to June 30) were similar to activity in the segment in the corresponding period of the previous year.  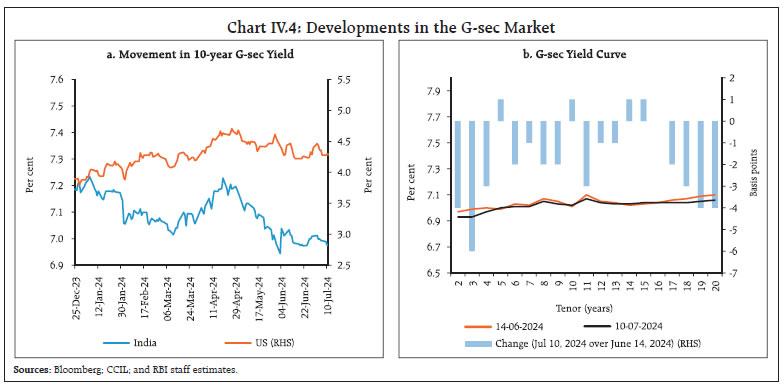 The yield on the 10-year Indian benchmark (7.10 GS 2034) government security (G-sec) remained rangebound at 6.97-7.01 per cent during June 16 to July 10, 2024 (Chart IV.4a). G-sec yields remained broadly stable across the term structure (Chart IV.4b). India’s inclusion in the JP Morgan’s Government Bond Index-Emerging Markets (GBI-EM) has begun on June 28, 2024. Over a 10-month period, the weight of Indian bonds would increase by 1 per cent every month, eventually reaching 10 per cent by March 2025. Corporate bond yields and risk premia hardened across maturity profiles and rating spectrums during June 16 to July 9, 2024 (Table IV.1). During June 16-July 10, the yield on 3 year AAA rated corporate bond remained in the range of 7.65-7.75 per cent and that of 5 year AAA rated corporate bond was in the range of 7.62-7.74 per cent.23 Reserve money (RM), excluding the first-round impact of change in the cash reserve ratio (CRR), recorded a growth of 8.1 per cent (y-o-y) as on July 5, 2024 (6.6 per cent a year ago) [Chart IV.5]. Currency in circulation (CiC), the largest component of RM, increased by 6.1 per cent (y-o-y) as on July 5, 2024 from 3.0 per cent as on May 17, 2024, on account of the base effect of the withdrawal of ₹2000 banknotes24 – 97.87 per cent has been returned to the banking system, mostly in the form of deposits (as on June 28, 2024). 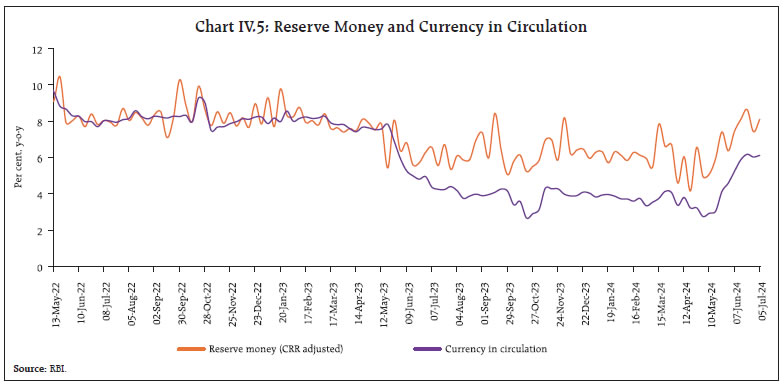 On the sources side (assets), RM comprises net domestic assets (NDA) and net foreign assets (NFA) of the Reserve Bank. Foreign currency assets (accounting for more than 90 per cent of NFA) recorded double digit growth of 10.3 per cent (y-o-y) as on July 5, 2024. Gold, a component of NFA, increased by 31.5 per cent – the highest growth recorded since March 2022 (Chart IV.6). Money supply (M3) rose by 9.7 per cent (y-o-y) as on June 28, 2024 (11.3 per cent a year ago).25 Aggregate deposits with banks, the largest component of M3, increased by 10.2 per cent (12.4 per cent a year ago). Scheduled commercial banks’ (SCBs’) credit growth declined from 15.5 per cent in the previous fortnight to 13.9 per cent as on June 28, 2024 (16.2 per cent a year ago) [Chart IV.7]. 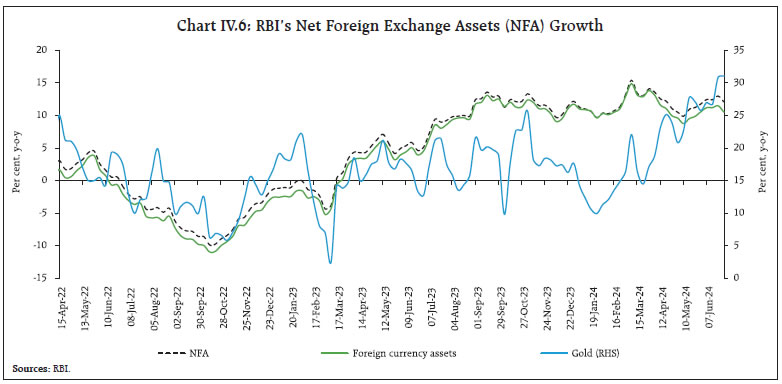 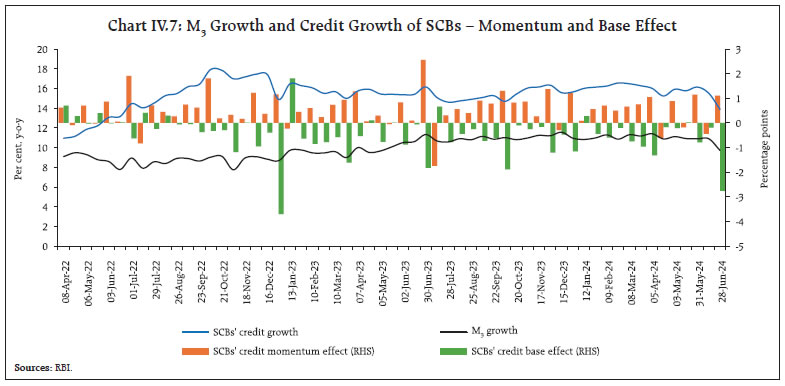 SCBs’ deposit growth (excluding the impact of the merger26), which recorded an increase in the wake of withdrawal of ₹2000 banknotes, has remained in double digits since April 2023 (Chart IV.8). As on June 28, 2024 the system level incremental credit-deposit ratio was 101 per cent (Chart IV.9). With the statutory requirements for CRR and statutory liquidity ratio (SLR) at 4.5 per cent and 18 per cent, respectively, around 77 per cent of deposits were available with the banking system for credit expansion as on June 28, 2024. The deposit base was supplemented by CDs issuances. 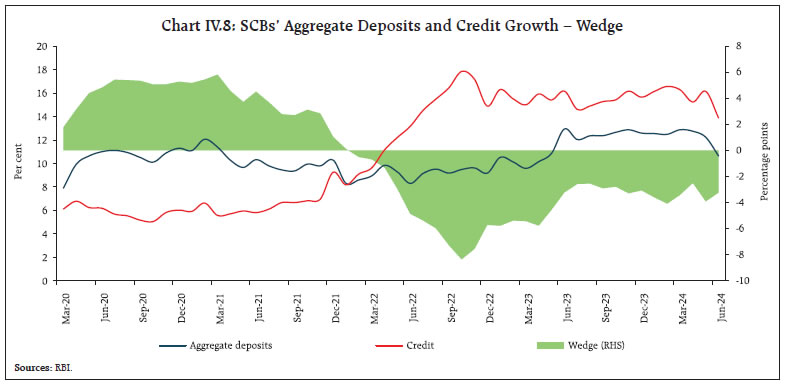 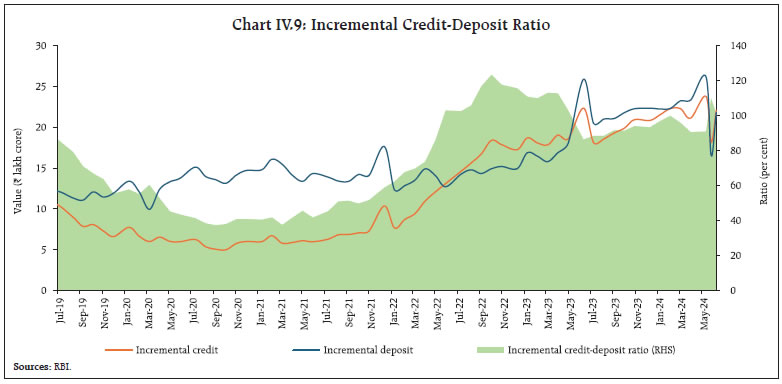 In response to the 250 bps policy rate hike since May 2022, SCBs have revised their repo-linked external benchmark-based lending rates (EBLRs) upwards. The 1-year median marginal cost of funds-based rate (MCLR) of SCBs increased to 168 bps during May 2022–June 2024. Consequently, weighted average lending rates (WALRs) on fresh and outstanding rupee loans increased by 188 bps and 111 bps, respectively, during May 2022 to May 2024. In case of deposits, weighted average domestic term deposit rates (WADTDRs) on fresh and outstanding deposits increased by 244 bps and 190 bps, respectively, during the same period (Chart IV.10). 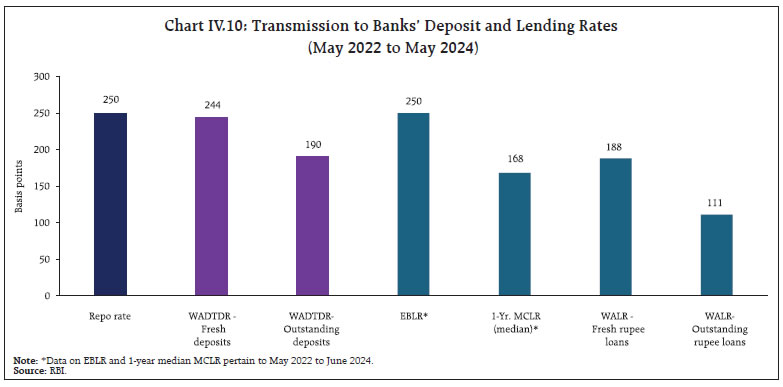  Amongst domestic banks, the increases in deposit and lending rates were higher in the case of public sector banks (PSBs), except for outstanding loans during the period May 2022 to May 2024 (Chart IV.11). The lending rates of PSBs remained lower than those of private sector banks (PVBs) while their deposit rates were higher. The Government of India kept rates on small savings schemes unchanged for Q2:2024-25. Rates on various schemes are now aligned with the formula-based rates except for public provident funds and five-year recurring deposits. 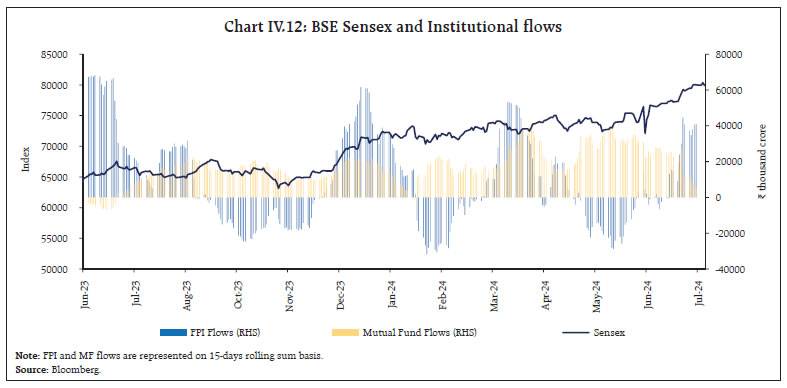 During June-July 2024 so far, the Indian equity market scaled fresh highs and the benchmark index BSE Sensex increased by 9.1 per cent to close at 80,717 on July 16, 2024 (Chart IV.12). Following heightened volatility in early June, indices gained as markets took solace from softer-than-expected domestic as well as US inflation prints for May 2024. During the second half of June, notwithstanding weak global cues amidst political uncertainty in Europe, indices continued to trend upwards amidst strong momentum in the banking and financial sector stocks and encouraging high-frequency domestic PMI data. This was further supported by India’s current account turning into surplus in Q4:2023-24. In July, the BSE Sensex crossed a fresh milestone of 80,000 supported by gains in information technology (IT) sector stocks and dovish commentary by the US Fed Chair. After rising sharply in early June, the India VIX declined during the second half and stabilised in the first half of July to settle at 14.2 on July 16, 2024. Since June 2024, both foreign portfolio investors (FPIs) as well as mutual funds made net purchases in the Indian equity market to the tune of ₹48,342 and ₹34,598 crore, respectively (up to July 12, 2024).
Against the backdrop of strong macroeconomic fundamentals and an ebullient equity market, several Small and Medium Enterprise (SME) Initial Public Offerings (IPOs) have opened with substantial listing day returns, fuelling investor interest as reflected in significant oversubscription (Box I). With a view to standardising the opening price discovery/ equilibrium price across exchanges during the special pre-open session for the SME IPO platform, the National Stock Exchange (NSE) decided to put an overall cap of up to 90 per cent over the issue price for listing of SME IPOs (with effect from July 4, 2024).33 Gross inward foreign direct investment (FDI) at US$ 15.2 billion during April-May 2024 was higher than US$ 12.3 billion recorded a year ago (Chart IV.13a). More than 80 per cent of the gross FDI inflows were concentrated in sectors such as manufacturing, financial services, computer services, business services, and electricity and other energy. Major source countries included Mauritius, Singapore, the Netherlands, the US and Cyprus, accounting for more than 80 per cent of the flows. Net FDI at US$ 7.1 billion in April-May 2024 more than doubled from US$ 3.4 billion a year ago, due to a rise in gross inflows and a moderation in repatriation. Amidst volatile financial conditions, amplifying geopolitical tensions and deepening geo-economic fragmentation, global FDI flows at US$ 1.3 trillion recorded a decline of 2 per cent (y-o-y) in 2023 (Chart IV.13b).34 The moderation occurred across geographies except in some European economies. Excluding them, the contraction in global flows was sharper at 10 per cent. 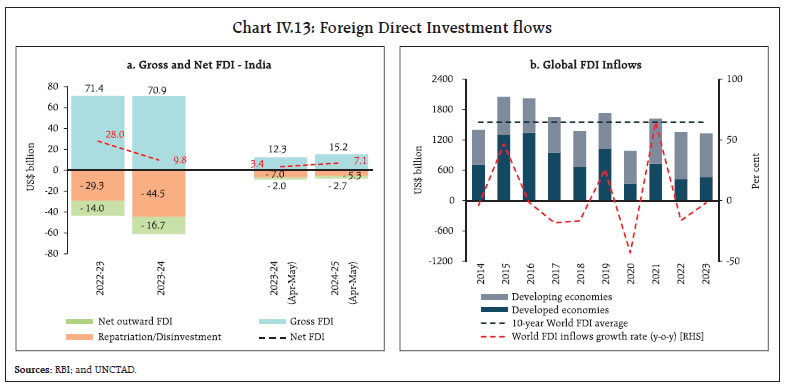 Global greenfield projects recorded a modest growth, driven by a rise in manufacturing project announcements, breaking the decade long trend of slowdown. Despite moderation in FDI inflows during 2023, India remained among the top 5 destination countries for both greenfield projects and international project finance deals. FPIs turned net buyers in Indian financial markets, with net inflows amounting to US$ 5.3 billion in June 2024 after two consecutive months of net outflows (Chart IV.14a). Equities reversed a two-month selling trajectory, with net FPI inflows of US$ 3.1 billion as market volatility subsided. In contrast, most peer economies recorded net outflows in the equity segment in June (Chart IV.14b). Financial services, telecommunications, and consumer services sectors attracted the highest FPI equity inflows during the month. The debt segment continues to draw FPI inflows and is estimated to attract around US$ 20 billion to US$ 40 billion35 within 18-21 months since the announcement of inclusion of Indian Government Bonds in the JP Morgan’s GBI-EM starting June 28, 2024. The prospects for FPI debt inflows appear optimistic as India is going to be included in other global indices.36 Net FPI inflows in July 2024 (up to July 15) were to the tune of US$ 3.0 billion. 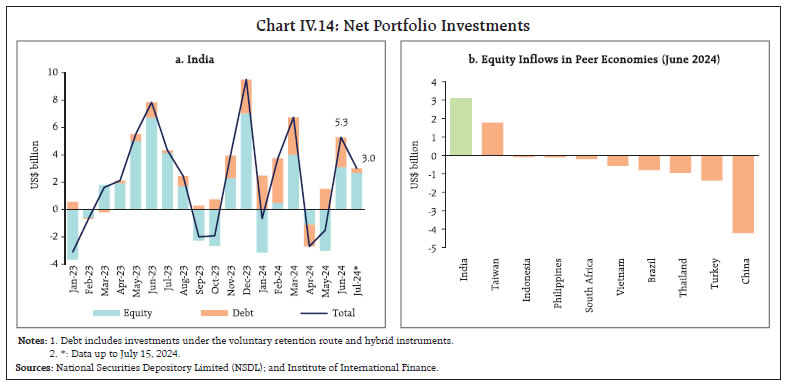 Non-resident deposits recorded net inflows of US$ 2.7 billion in April-May 2024 as compared to US$ 0.6 billion a year ago, led by higher inflows in all three accounts namely, Non-Resident (External) Rupee Accounts [NR(E)RA], Non-Resident Ordinary (NRO) and Foreign Currency Non-Resident [FCNR(B)] accounts. Continuing the pick-up recorded in Q4:2023-24, external commercial borrowing (ECB) gross disbursements stood higher at US$ 6.7 billion during the first two months of Q1:2024-25 (US$ 5.5 billion in April-May 2023), notwithstanding the sequential moderation in new registrations and disbursements. With inflows outpacing outflows, net flows continue to be positive (Chart IV.15). 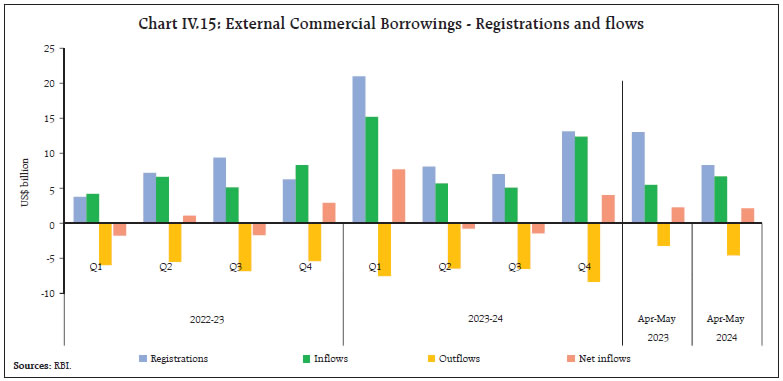 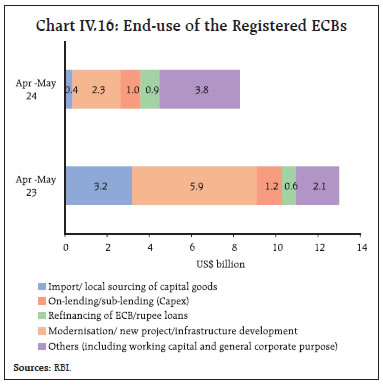 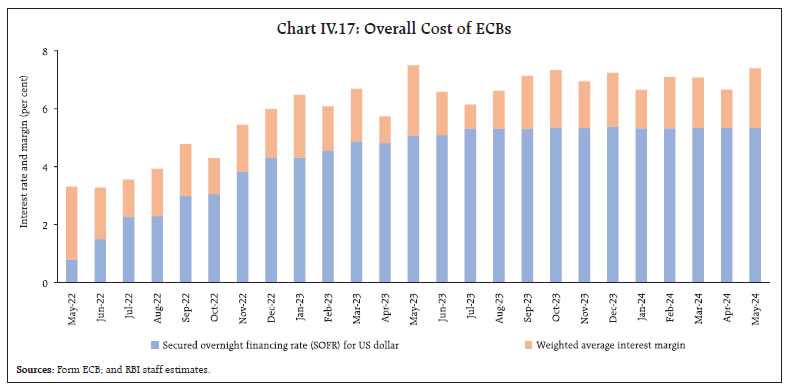 A large portion of the ECBs raised during April-May 2024 were intended for new projects, modernisation and infrastructure development (Chart IV.16). The weighted average margin over the stable benchmark rate rose by 73 bps, pushing up the overall cost of ECB loans in May 2024 (Chart IV.17). India’s net international investment position (IIP) improved to US$ (-) 361.7 billion during Q4:2023-24 on the back of an expansion in reserves, currency and deposits and outward FDI, which was moderately offset by an increase in inward FDI and external debt liabilities (IV.18). As a result, the ratio of India’s international assets to international liabilities improved to 74.0 per cent in March 2024. The net IIP to GDP (at current market prices) ratio also improved to (-) 10.3 per cent in March 2024 against (-) 11.3 per cent a year ago. 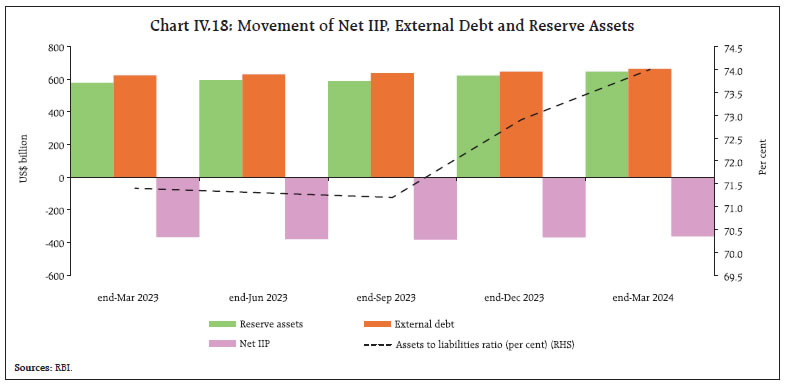 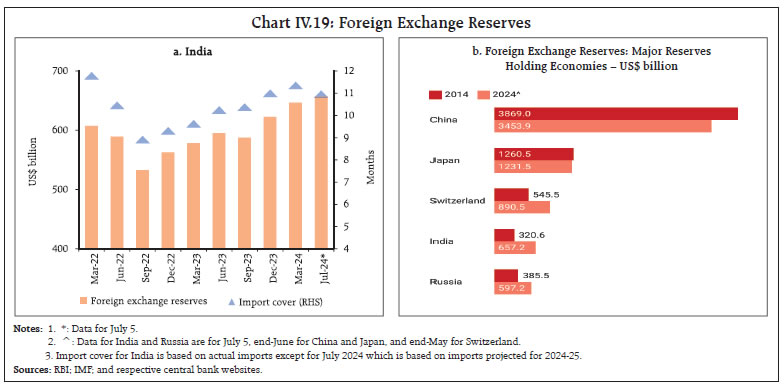 India’s foreign exchange reserves rose by US$ 34.7 billion in 2024 to reach an all-time high level of US$ 657.2 billion on July 5, 2024 equivalent of around 11 months of imports projected for 2024-25, and about 99 per cent of total external debt outstanding at end-March 2024 (Chart IV.19a). At present, India remains the fourth highest foreign exchange reserves holder in the world (Chart IV.19b). 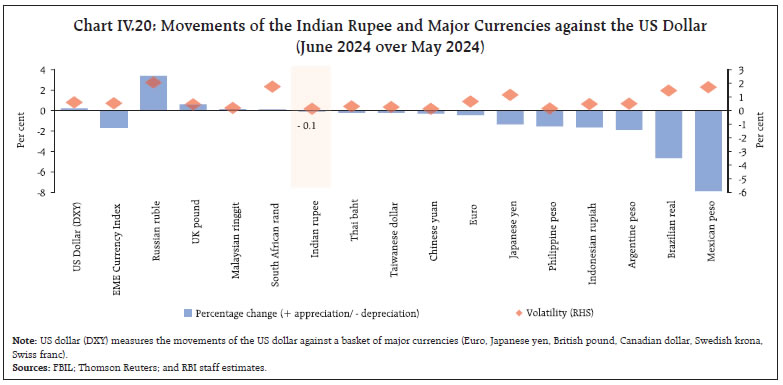 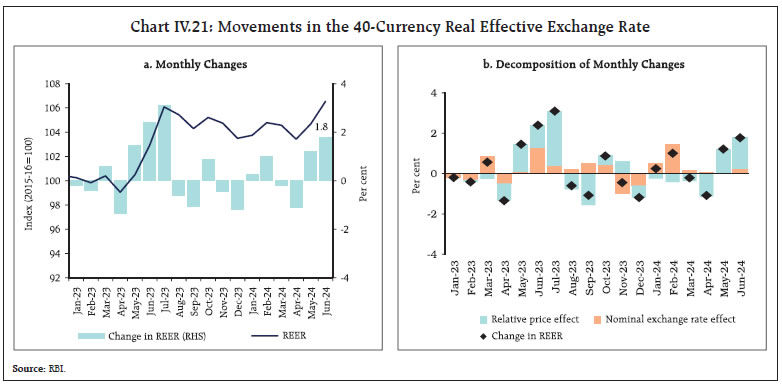 The Indian rupee (INR) depreciated by 0.1 per cent (m-o-m) vis-à-vis the US dollar in June 2024 as emerging market currencies faced depreciating pressures on the back of the strengthening US dollar and rising commodity prices. The INR, however, remained one of the least volatile major currencies during the month (Chart IV.20). In terms of the 40-currency real effective exchange rate (REER), the INR appreciated by 1.8 per cent (m-o-m) in June 2024, majorly due to the positive relative price differentials (Chart IV.21). India’s current account balance (CAB) recorded a surplus of 0.6 per cent of GDP in Q4:2023-24 as against a deficit of 1.0 per cent in Q3:2023-24 and 0.2 per cent in Q4:2022-23. A moderating merchandise trade deficit along with robust services exports and remittance receipts led to the surplus in the current account (Chart IV.22). 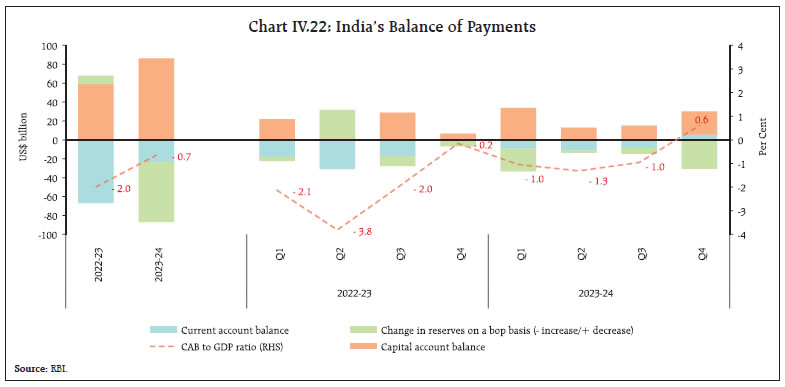 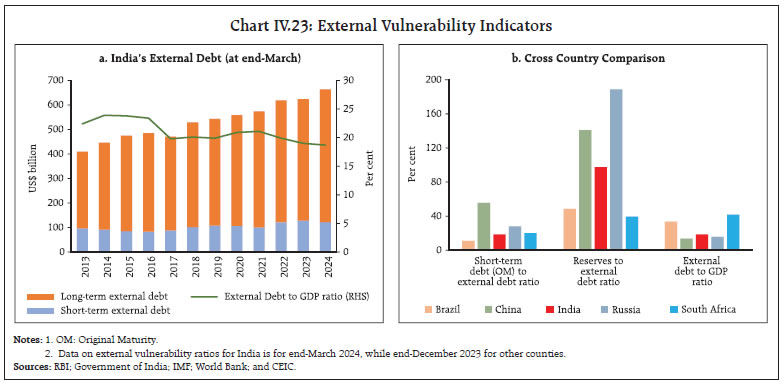 During 2023-24 as a whole, the current account deficit (CAD) moderated to 0.7 per cent of GDP from 2.0 per cent a year ago, led by a decline in the merchandise trade deficit. There was an accretion of US$ 63.7 billion to the foreign exchange reserves (excluding valuation effects) during 2023-24 as net capital inflows – dominated by strong FPI inflows and banking capital – exceeded the CAD. India’s external debt rose by US$ 39.7 billion from end-March 2023 to US$ 663.8 billion at end-March 2024, while the external debt to GDP ratio moderated to 18.7 per cent from 19.0 per cent a year ago (Chart IV.23a). Key external vulnerability indicators of India remained at sustainable levels and fared well relative to its peers (Chart IV.23b). 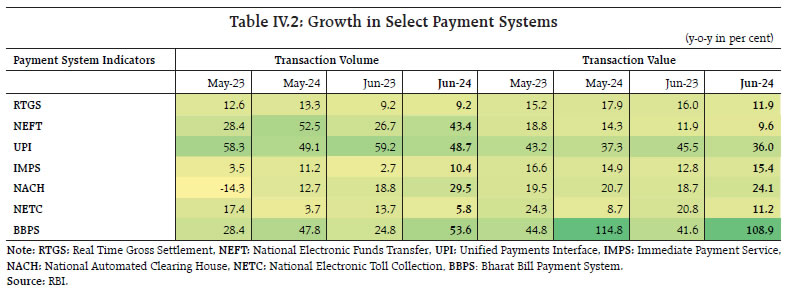 Payment Systems Digital payment system indicators across all major categories exhibited sustained growth (y-o-y) in June 2024, primarily led by the Bharat Bill Payment System (BBPS) and the Unified Payments Interface (UPI) [Table IV.2]. The BBPS maintained steady growth during June 2024, reflecting increased penetration on account of simplified bill payments through a seamless, secure, and efficient platform that caters to the needs of both customers and billers.37 In June 2024, the UPI recorded robust growth (y-o-y), albeit with a marginal dip sequentially. With regard to other payment system indicators, the rate of growth of Real Time Gross Settlement (RTGS) and National Electronic Funds Transfer (NEFT) slowed in June 2024 relative to May. Digitalisation continued to strengthen, driven by robust growth (y-o-y) in payment systems infrastructure – a pick-up in the number of credit cards (17.7 per cent), point-of-sale (PoS) terminals deployed (10.6 per cent), Bharat quick response (QR) codes (10.4 per cent) and UPI QR codes (23.7 per cent) in May 2024. In order to provide further impetus to expanding the international reach of Indian payment systems, the Reserve Bank joined Project Nexus, a multilateral international initiative to enable instant cross-border retail payments by interlinking domestic fast payments systems (FPSs) of four Association of Southeast Asian Nations (ASEAN) countries (Malaysia, Philippines, Singapore, and Thailand); and India.38 The platform is expected to play an important role in making retail cross-border payments efficient, faster, and more cost effective. A meeting of Governor, RBI with the Managing Director (MD) and Chief Executive Officers (CEOs) of PSBs and PVBs was held on July 3, 2024 in which issues pertaining to robust cybersecurity controls, managing third-party risks, customer awareness and education initiatives, measures to curb digital frauds were discussed at length.39 The National Payments Corporation of India’s (NPCI) wholly owned subsidiary, NPCI International Payments Ltd. (NIPL), in partnership with Network International (Network) enabled40 the acceptance of QR code-based UPI payments via Network’s PoS terminals in the United Arab Emirates (UAE). This would facilitate seamless and secure cross-border transactions for Indian tourists and Non-Resident Indians (NRIs) across Network’s vast merchant network in the UAE. UPI’s reach across international platforms was further extended with NIPL’s partnership41 with Lyra that enabled secure and convenient UPI transactions at Galeries Lafayette’s flagship store in Paris. Conclusion Against this background, it is useful to take stock of the conduct of monetary policy in the context of its goals. The cumulative increase in the policy rate, took the level of the policy rate to 6.5 per cent by February 2023, followed by a prolonged pause. This policy approach has yielded some gains in the form of CPI headline inflation dipping into the tolerance band since September 2023. Yet, disinflation has been grudging and uneven and headline inflation remains closer to 5 per cent than to the target of 4 per cent in its latest readings in spite of historically low readings on core inflation and sustained deflation in fuel prices. This trains the focus of the public discourse on food inflation, its nature and dynamics. The argument that food price shocks are transitory does not seem to be borne out by the actual experience over the past one year – too long a period for a shock to be termed as transitory! Superimposed on this ‘persistent’ component are sporadic spikes in prices of a range of vegetables that overlap across constituents to give the broader category of vegetables inflation an enduring character. Food prices are clearly dominating the behaviour of headline inflation and households’ inflation expectations, undermining the gains of lowering core and fuel inflation through a combination of monetary policy and supply management. While households’ current perception of inflation has been moderating, this is not being reflected in their three months ahead and one year ahead expectations which remain elevated. The accumulation of food price pressures threatens the outlook for inflation in the form of spillovers to wages, rents and expectations. Against this background, the MPC of the RBI has committed to align inflation durably to the target. Till that is achieved, the recent halting declines in inflation readings have to be regarded as work still in progress. Close to half a century ago, seminal work pointed to the phenomenon of time inconsistency.42 When monetary policy authorities committing to price stability renege on that commitment in the pursuit of short-run gains of increasing growth, they can end up losing credibility, unhinging inflation expectations and triggering a surge in inflation. This can also undermine growth sustainability. Given the high uncertainty shrouding the inflation outlook, it is prudent to eschew the temptation of time inconsistency and stay the course on the straight and narrow path of aligning inflation with the target of 4 per cent. This does not imply that inflation should reach 4 per cent and stay there before monetary policy considers a change in stance; instead, based on a careful evaluation of the balance of risks, an enduring movement towards the target should provide signals to forward-looking monetary policy to respond. In the words of Governor Shri Shaktikanta Das, “monetary policy remains squarely focused on price stability to effectively anchor inflation expectations and provide the required foundation for sustained growth over a period of time”. * This article has been prepared by Michael Debabrata Patra, G. V. Nadhanael, Shahbaaz Khan, Arpita Agarwal, Kunal Priyadarshi, Harshita Keshan, Yamini Jhamb, Harendra Behera, K M Neelima, Arjit Shivhare, Madhuresh Kumar, Rishabh Kumar, Satyendra Kumar, Khushi Sinha, Aayushi Khandelwal, Debapriya Saha, Shivam, Shelja Bhatia, Yuvraj Kashyap, Aratrika Kundu, Shaoni Nandi, Kamal Gupta, Avnish Kumar, Supriyo Mondal, Amit Pawar, Himani Shekhar, Asish Thomas George, Samir Ranjan Behera, Vineet Kumar Srivastava, and Rekha Misra. 3 UN Secretary-General’s remarks to the press on the launch of the Sustainable Development Goals (SDG) Report 2024, in New York on June 28, 2024. 4 The Economist, June 22, 2024. 5 Kantar, FMCG Pulse, Q2 2024. 6 The Economist, June 21, 2024. 7 Address by Michael Debabrata Patra, Deputy Governor, Reserve Bank of India (RBI) in the Mid-Career Training Programme for officials of the Indian Administrative Service on July 9, 2024 at the Lal Bahadur Shastri National Academy of Administration, Mussoorie. 8 Governor Shri Shaktikanta Das 11 Dr. Michael Debabrata Patra 12 Container Equipment Forecaster report. https://www.drewry.co.uk/maritime-research-opinion-browser/maritime-research-opinions/global-container-equipment-fleet-growth-picks-up-pace. 13 The Trade Monitoring Update, WTO, July 08, 2024. 14 Institute for Supply Management (ISM) data. 15 https://www.business-standard.com/economy/news/india-s-gross-gst-collection-up-7-7-to-rs-1-74-trillion-in-june-124070100889_1.html [There is no press release from Press Information Bureau (PIB) for GST collections for the month of June 2024.] 16 https://pib.gov.in/PressReleasePage.aspx?PRID=2023869#:~:text=The%20Interim%20Budget%202024%2D25,2%2C79%2C500%20crore 17 https://cga.nic.in/MonthlyReport/Published/6/2023-2024.aspx 18 As per the IMD, the MJO is one of the most important atmosphere-ocean coupled phenomena in the tropics, which has profound influence on Indian Summer Monsoon. It is characterised by an eastward spread of large regions of enhanced and suppressed tropical rainfall, mainly observed over the Indian and Pacific Ocean. Based on the place of convective activity, the period of MJO is divided into 1-8 phases with each phase roughly lasting for 7 to 8 days. 19 https://www.financialexpress.com/policy/economy-govt-to-begin-open-market-sale-of-wheat-amp-rice-from-aug-1-3549883/ 20 As per the provisional data released by the National Statistical Office (NSO) on July 12, 2024. 21 https://www.thehindu.com/incoming/unseasonal-rain-in-maharashtra-leads-to-spike-in-agrarian-distress/article68190468.ece 22 On account of changes in taxes by the state governments. 25 Excluding the impact of the merger of a non-bank with a bank (with effect from July 1, 2023). 26 Merger of HDFC Ltd with HDFC Bank effective July 1, 2023. 27 The BSE SME platform was established in March 2012, while the NSE SME platform, known as Emerge, was established in September 2012. 28 Underpricing is measured as difference between market price (first day closing price) and offer price. 29 ‘The Phenomena of Listing Returns in India: Some Exploration’ (Box-item, RBI Annual Report, 2020-21). 30 BSE Sensex is taken as the benchmark for the Mainboard IPOs and BSE Small cap is taken as benchmark for SME IPOs. 31 https://www.sebi.gov.in/enforcement/orders/feb-2024/interim-order-in-the-matter-of-v-marc-india-limited_81831.html 32 https://www.sebi.gov.in/enforcement/orders/may-2024/interim-order-in-the-matter-of-varanium-cloud-limited_83309.html 33 https://nsearchives.nseindia.com/content/circulars/SME62757.zip 34 World Investment Report 2024, United Nations Conference on Trade and Development (UNCTAD). 35 https://www.bloomberg.com/news/newsletters/2024-06-27/what-india-s-inclusion-in-jpmorgan-bond-index-means-for-its-economy-markets?sref=QF6yuiF0 36 Indian fully accessible route (FAR) bonds are to be included in the Bloomberg Emerging Market (EM) Local Currency Government Index with an initial weightage of 10 per cent starting January 2025. It has also been announced that India is to be included in the US retirement fund’s new Federal Retirement Thrift Investment Board (FRTIB) index. 37 NPCI Press Release. July 9, 2024. 38 RBI Press Release. July 1, 2024. 39 RBI Press Release. July 3, 2024. 40 NPCI Press Release. July 3, 2024. 41 NPCI Press Release. July 5, 2024. 42 Kydland, Finn E., and Edward C Prescott, “Rules Rather than Discretion: The Inconsistency of Optimal Plans”, Journal of Political Economy 85 (3): 473–492, 1977, June. |

हे पेज शेअर करा:


भारतीय रिझर्व्ह बँक मोबाईल ॲप्लिकेशन इंस्टॉल करा आणि नवीनतम बातम्यांचा त्वरित ॲक्सेस मिळवा!
आमचे अॅप इंस्टॉल करण्यासाठी QR कोड स्कॅन करा


पेज अंतिम अपडेट तारीख:


