Introduction The Interim Budget 2009-10 was presented to the Parliament on February 16, 2009 in the backdrop of uncertainties in the global economy and its attendant effects on Indian economy since mid-September 2008. The Budget has sought for Vote-on-Account to enable the Government to discharge its responsibilities and to meet all essential expenditure during the first four months of the fiscal year 2009-10. There are no new tax proposals. This was the twelfth Interim/Vote-on-Account Budget since Independence.
The thrust of the Budget is to keep the economy on the high trajectory of growth by creating demand through increased public expenditure in identified sectors which would lead to a temporary deviation from the path of fiscal consolidation, mandated under Fiscal Responsibility and Budget Management (FRBM) Act during 2008-09 and 2009-10. In this regard, the Government’s conscious decision to increase public expenditure in order to maintain the higher trajectory of growth is reflected in the number of fiscal stimulus measures announced since October, 2008 (Box 1). The emphasis is essentially on the expenditure front by allocating resources to agriculture, rural development, education, social sector, infrastructure and strengthening of credit delivery system. The medium-term objective would be to revert back to the path of fiscal consolidation with improvement in economic growth. This article is organised into three sections. Section I analyses the developments relating to revised estimates (RE) for 2008-09. * Prepared in the Division of Central Finances of the Department of Economic Analysis and Policy. This article is based on the Interim Union Budget 2009-10 presented to the Parliament on February 16, 2009. The article on Union Budget 2008-09 appeared in RBI Monthly Bulletin of May 2008.
Box 1 : Major Fiscal Stimulus measures since October 2008
October 20, 2008
The supplementary demand for grants provided an amount with net cash outgo of Rs.1,05,613 crore to mainly finance schemes/ plans announced in 2008-09 Budget but for which no provisions were made.
December 7, 2008
The three major ad valorem rates of Central Excise duty viz,14 per cent, 12 per cent and 8 per cent applicable to non-petroleum products were reduced by 4 percentage points each.
For promoting exports, pre and post-shipment export credit for labour intensive exports, i.e., textiles (including handlooms, carpets and handcrafts), leather, gems & jewellery, marine products and SME sector were provided an interest subvention of 2 per cent upto March 31, 2009 subject to minimum rate of interest of 7 per cent per annum. An additional fund of Rs.1,100 crore to ensure full refund of terminal excise duty/ central sales tax (CST) was announced. Furthermore, an additional allocation of Rs.350 crore for export incentive schemes was announced. In order to provide a contra-cyclical stimulus via plan expenditure, the Government sought for authorization of additional Plan expenditure of upto Rs 20,000 crore in the current year. In the textile sector, an additional allocation of Rs.1,400 crore was announced to clear the entire backlog of Technology Up-gradation Fund (TUF) Scheme.
In order to support the infrastructure schemes under Public Private partnership mode, Government announced to authorize the India Infrastructure Finance Company Limited (IIFCL) to raise Rs.10,000 crore through tax-free bonds by March 31, 2009
December 19, 2008
The second supplementary demand for grants provided for a gross expenditure amounting to Rs.55, 605 crore with net cash outgo of Rs.42, 480 crore.
February 24, 2009 (Post-Interim Budget)
General reduction in Excise duty rates by 4 per cent points with effect from December 7, 2008 was extended beyond March 31, 2009. In addition, the general rate of central excise duty was reduced from 10 per cent to 8 per cent. To restore the business confidence in the Services sector and to reduce the dispersal between CENVAT rate and the Service Tax with a view to move towards the stated goal of a Uniform Goods and Service Tax, the rate of service tax on taxable services was reduced from 12 per cent to 10 per cent. Section II sets out the budget estimates (BE) for 2009-10. Section III contains the concluding observations. I. Revised Estimates 2008-091
Revenue Receipts Reflecting the impact of economic slowdown and reduction in tax rates, the gross tax revenue in the RE for 2008-09 at Rs.6,27,949 crore was lower by Rs.59,766 crore (8.7 per cent) than the BE, with collections under all the major taxes showing significant declines from the budgeted level. The recently introduced taxes such as service tax, banking cash transaction tax, fringe benefit tax and taxes of UTs, which constitute a small proportion of the gross taxes, however, were higher than the budgeted level in 2008-09. Consequently, the net tax revenue [gross tax revenue less States’ share in Central taxes and amount transferred to National Calamity Contingency Fund (NCCF)] was 8.1 per cent lower than the budgeted and constituted 8.6 per cent of the GDP in 2008-09. Nontax revenue, however, was higher by 0.4 per cent than the BE due to increase in ‘other non-tax revenue’ component by 10.0 per cent. Other major components viz., dividends and profits and interest receipts, however declined by Rs.3,468 crore and Rs.99 core, respectively. Reflecting this, the revenue receipts (net) of the Centre at Rs.5, 62,173 crore would fall short of the budgeted level by 6.8 per cent. 1 All comparisons of 2008-09 in this section are with the budget estimates unless stated otherwise. Non-Debt Capital Receipts
The non-debt capital receipts comprising of recoveries of loans and advances and other miscellaneous receipts including disinvestment receipts would also decline by Rs.2,397 crore (16.3 per cent) in the 2008-09 RE. The decline would follow from non-realisation of the budgeted disinvestment proceeds by the extent of Rs.7,598 crore, despite the recoveries of loans and advances more than doubling to Rs.9,698 in 2008-09 RE.
Aggregate Expenditure With the additional expenditure provided under two supplementary demand for grants, the aggregate expenditure in the RE for 2008-09 was significantly higher by Rs.1,50,069 crore (20.0 per cent) than the BE, of which increase in revenue expenditure accounted for Rs.1,45,327 crore (96.8 per cent). The higher revenue expenditure was mainly on account of subsidies and defence in the non-plan component and rural development under plan component. Subsidies in the RE at Rs.1,29,243 crore were higher by 80.9 per cent, primarily on account of increase in fertilizer and food subsidies. Rise in defence revenue expenditure was on account of implementation of the Sixth Pay Commission award for defence personnel. With regard to capital expenditure, while the defence capital outlay declined by Rs.7,007 crore, non-defence capital outlay increased by Rs.5,790 crore. The net lending also increased by 20.2 per cent with higher loan disbursements more than offsetting the larger loan recoveries. Plan and Non-Plan Expenditure
Expenditure pattern indicates that non-Plan and Plan expenditure increased by 21.8 per cent and 16.3 per cent, respectively from the budgeted level. Under non-Plan expenditure, interest payments, interest subsidies, fertiliser subsidies and defence services increased in the RE over the budgeted level, with fertiliser subsidy alone accounting for 40.6 per cent of the increase in total non-plan expenditure. There was, however, a cutback of Rs.4,873 crore (11.3 per cent) in grants to States from the budgeted level (Table 1). Under plan expenditure, allocation for Central Plan was higher by 13.4 percent due to substantial hike in rural development. Central assistance for State and UT Plans was also higher by 24.3 per cent in the RE mainly due to hike in the allocation for externally aided projects, irrigation and Jawaharlal Nehru National Urban Renewal Mission (JNNURM).
Deficit Indicators The revised estimates for 2008-09 showed marked deterioration in all the key deficit indicators viz., revenue deficit (RD), gross fiscal deficit (GFD) and primary deficit (PD), relative to GDP over their budgeted levels. The deterioration of the deficit indicators was due to marked deceleration in tax collection as a result of economic slowdown and cut in indirect tax rates on the one hand and substantial hike in expenditure, in particular revenue expenditure, to boost aggregate demand on the other.
Table 1: Plan and Non-Plan Expenditure in 2008-09 |
( Rupees crore) |
Item |
2008-09 (BE) |
2008-09(RE) |
Variation (3 over 2) |
| |
|
|
Amount |
Per cent |
1 |
2 |
3 |
4 |
5 |
Non-Plan |
|
|
|
|
1. |
Interest Payments |
1,90,807 |
1,92,694 |
1,887 |
1.0 |
2. |
Grants to States |
43,294 |
38,421 |
-4,873 |
-11.3 |
3. |
Interest Subsidies |
2,829 |
4,063 |
1,234 |
43.6 |
4. |
Fertiliser Subsidy |
30,986 |
75,849 |
44,863 |
144.8 |
5. |
Defence Services |
1,05,600 |
1,14,600 |
9,000 |
8.5 |
Total Non-Plan Expenditure Plan |
5,07,498 |
6,17,996 |
1,10,498 |
21.8 |
1. |
Central Plan |
1,79,954 |
2,04,129 |
24,175 |
13.4 |
2. |
Central Assistance for State and UT Plans |
63,432 |
78,828 |
15,396 |
24.3 |
Total Plan Expenditure |
2,43,386 |
2,82,957 |
39,571 |
16.3 |
While the revenue receipts declined by Rs.40,762 crore (6.8 per cent) from the budgeted level, revenue expenditure increased by Rs.1,45,327 crore (22.1 per cent). As a result, RD in the RE at Rs.2,41,273 crore was higher than the budgeted level by 337.2 per cent and constituted 4.4 per cent of the GDP as against the budgeted level of 1.0 per cent (Table 2). Consequently, GFD was higher by Rs.1,93,228 crore (145.0 per cent) constituting 6.0 per cent of GDP as against the budgeted level of 2.5 per cent. Similarly, primary balance which was budgeted to be a surplus of 1.1 per cent of GDP, turned to a deficit of Rs.1,33,821 crore, constituting 2.5 per cent of GDP in the RE for 2008-09. Financing Pattern of Gross Fiscal Deficit In view of the increase in GFD by 2.4 times in the RE over the budgeted level, the net market borrowings (dated securities and 364 days Treasury Bills) has been hiked by 2.7 times of the budgeted level to Rs.2,66,539 crore. Net market borrowings would finance 81.6 per cent of the GFD as against 74.3 per cent in the BE (Table 3). There would also be substantial increase in the drawdown of cash balances to finance 9.2 per cent of the GFD as against 5.4 per cent in the BE. Contribution from National Small Savings Fund would also be higher at 3.4 per cent as against negligible amount envisaged in the BE. On the other hand, financing from external assistance in the RE was lower at 2.9 per cent of GFD than the budgeted level of 8.2 per cent. In the public account, deposits and advances would finance 3.9 per cent of GFD against the budgeted level of 6.5 per cent.
Table 2 : Increase in Deficit Indicators |
(Rupees crore) |
Item |
2008-09 (BE) |
2008-09 (RE) |
Variation |
1 |
2 |
3 |
4=3-2 |
1. |
Revenue Deficit (3-2) |
55,184 |
2,41,273 |
1,86,089 |
2. |
Revenue Receipts |
6,02,935 |
5,62,173 |
-40,762 |
| |
i. |
Tax Revenue |
5,07,150 |
4,65,970 |
-41,180 |
| |
ii. |
Non-Tax Revenue |
95,785 |
96,203 |
418 |
3. |
Revenue Expenditure |
6,58,119 |
8,03,446 |
1,45,327 |
| |
of which: |
|
|
|
| |
i. |
Subsidies |
71,431 |
1,29,243 |
57,812 |
| |
ii. |
Interest Payments |
1,90,807 |
1,92,694 |
1,887 |
4. |
Gross Fiscal Deficit (1-5+6+7) |
1,33,287 |
3,26,515 |
1,93,228 |
5. |
Other non-debt capital receipts |
10,165 |
2,567 |
-7,598 |
6. |
Capital Outlay (i+ii) |
84,522 |
83,305 |
-1,217 |
| |
i. |
Defence |
48,007 |
41,000 |
-7,007 |
| |
ii. |
Non-defence capital outlay |
36,515 |
42,305 |
5,790 |
7. |
Net Lending (i-ii) |
3,746 |
4,504 |
758 |
| |
i. |
Loans |
8,243 |
14,202 |
5,959 |
| |
ii. |
Recoveries |
4,497 |
9,698 |
5,201 |
8. |
Gross Primary Deficit (4-3(ii)) |
-57,520 |
1,33,821 |
1,91,341 |
Table 3 : Financing Pattern of Gross Fiscal Deficit |
(Rupees crore) |
Item |
2008-09 (BE) |
2008-09 (RE) |
1 |
2 |
3 |
Gross Fiscal Deficit |
1,33,287 |
3,26,515 |
(100.0) |
(100.0) |
Financed by |
|
|
Market Borrowings |
99,000 |
2,66,539 |
(74.3) |
(81.6) |
Securities against small savings |
9,873 |
1,324 |
(7.4) |
(0.4) |
External Assistance |
10,989 |
9,603 |
(8.2) |
(2.9) |
State provident fund |
4,800 |
4,800 |
(3.6) |
(1.5) |
NSSF |
53 |
11,206 |
(0.0) |
(3.4) |
Reserve Funds |
-972 |
-16,808 |
-(0.7) |
-(5.1) |
Deposit and Advances |
8,629 |
12,788 |
(6.5) |
(3.9) |
Postal Insurance and Life Annuity Funds |
4,123 |
2,594 |
(3.1) |
(0.8) |
Draw down of Cash Balances |
7,225 |
29,984 |
(5.4) |
(9.2) |
Others |
-10,433 |
4,485 |
-(7.8) |
(1.4) |
Note: Figures in parentheses are percentages to GFD. |
II. Analysis of Budget 2009-102 The Union Interim Budget for 2009-10 has been presented against the backdrop of global economic slowdown adversely impacting the Indian economy, and the consequent need to provide fiscal stimulus to contain the economic slowdown. The buoyancy in revenue collection has significantly fallen not only due to the economic slowdown but also due to tax reduction measures undertaken by the Government to provide stimulus. At the same time, the expenditure were stepped up substantially to boost the aggregate demand in the economy. With the moderation in economic growth excepted to continue well into fiscal 2009-10, to boost demand, the Interim Budget has indicated relaxing the FRBM targets during 2009-10 as well. 2 All comparisons of 2009-10 in this section are with the revised estimates for 2008-09 unless stated otherwise. Revenue Receipts
The adverse impact of economic slowdown on the revenue receipts observed during 2008-09 is expected to continue during 2009-10, though with some moderation. Revenue receipts during 2009-10 are budgeted to increase by 8.4 per cent, improving from 3.7 per cent growth recorded in 2008-09 RE. Growth of gross tax revenue would be 6.9 per cent, marginally higher than 5.9 per cent in 2008-09. Nontax revenue is expected to grow by 16.4 per cent as against the decline of 6.0 per cent in 2008-09. The net tax revenue [gross tax revenue less States share in Central taxes and amount transferred to National Calamity Contingency Fund (NCCF)] is budgeted to show an increase of 6.8 per cent over the preceding year level.
Tax Revenue The gross tax collections, relative to GDP, is budgeted to decline further to 11.1 per cent from 11.6 per cent in 2008-09, which would be lower than the level recorded in the previous two years. The growth in corporation tax collections are expected to further decelerate to 10.0 per cent in 2009-10 from 15.1 per cent in 2008-09. The growth in personal income tax, however, is estimated to accelerate to 10.0 per cent from 5.2 per cent in 2008-09, but would be far lower than the growth recorded in the recent past. Custom duty is expected to continue its decelerating trend and grow by 2.0 per cent during 2009-10. Union excise duty, however, would increase by 2.1 per cent, reversing the decline of 12.3 per cent recorded during 2008-09. Fringe benefit tax (FBT) and other taxes and duties are budgeted to experience higher buoyancy with growth rates of about 20.0 per cent. The buoyancies (percentage change in tax revenue as a ratio to percentage change in GDP) of major taxes in 2009-10, except excise duty, are budgeted to decline from the already low level observed during 2008-09 as compared with the average during 2004-05 to 2007-08 (Table 4).
Table 4: Tax-buoyancy : Major Taxes |
| |
2004-05 |
2005-06 |
2006-07 |
2007-08 |
Average |
2008-09 RE |
2009-10 BE |
1 |
2 |
3 |
4 |
5 |
6 |
7 |
8 |
Corporation Tax |
2.1 |
1.6 |
2.8 |
2.3 |
2.2 |
1.0 |
0.9 |
Income Tax |
1.3 |
1.0 |
2.3 |
2.5 |
1.8 |
1.3 |
1.0 |
Customs Duty |
1.3 |
0.9 |
2.2 |
1.4 |
1.5 |
0.3 |
0.2 |
Union Excise Duty |
0.6 |
0.9 |
0.4 |
0.4 |
0.6 |
-0.8 |
0.2 |
Service Tax |
5.6 |
4.5 |
4.2 |
2.5 |
4.2 |
1.8 |
0.5 |
Gross Tax Revenue |
1.4 |
1.4 |
1.9 |
1.8 |
1.6 |
0.4 |
0.6 |
Non-Tax Revenue Non-tax revenues (NTR) are budgeted to increase to Rs.1,11,955 crore (16.4 per cent) in 2009-10 from Rs.96,203 crore in 2008-09, reflecting higher revenues from ‘other’ nontax revenue, which is estimated to grow by 56.4 per cent. The receipts from dividends and profits, which are other major component of NTR, are expected to decline to Rs.36,985 crore from Rs.39,736 crore in 2008-09. Continuing its declining trend, the interest receipts are estimated to decline to Rs.19,000 crore from Rs.19,036 crore. Non-Debt Capital Receipts
The recoveries of loans and advances from the State Governments and CPSUs are estimated to improve marginally to Rs.9,725 crore in 2009-10 from Rs.9,698 crore in 2008-09. Disinvestment proceeds are budgeted to decline to Rs.1,120 crore from Rs.2,567 crore in 2008-09.
Aggregate Expenditure
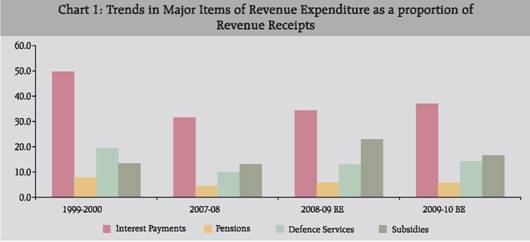
The Government has envisaged containing the growth of aggregate expenditure during 2009-10 to 5.8 per cent, as against the sharp rise of 33.0 per cent during 2008-09. This lower growth in aggregate expenditure would mainly emanate from revenue expenditure which is budgeted to grow lower by 5.6 per cent compared to 35.1 per cent growth in 2008-09. Containment of subsidies, in particular fertilizer subsidy, would be an important contributing factor to the slower growth in revenue expenditure during 2009-10 (Table 5). Consequently, the total subsidies are budgeted to decline by 21.9 per cent in 2009-10 as against the sharp growth of 82.2 per cent in 2008-09. With the rise in GFD, interest payments at Rs.2,25,511 crore are estimated to show higher increase of Rs.32,817 crore (or 17.0 per cent) from Rs.21,664 crore (or 12.7 per cent) in 2008-09. The ratios of interest payments, pensions and defence to revenue receipts increased, as these items primarily contributed to the increase in revenue expenditure in the 2009-10 BE over the 2008-09 RE (Chart 1).
Table 5: Major Subsidies |
(Rupees crore) |
Items |
2007-08 |
2008-09 (RE) |
2009-10 (BE) |
1 |
2 |
3 |
4 |
Subsidies |
|
|
|
of which: |
70,926 |
1,29,243 |
1,00,932 |
(1.5) |
(2.4) |
(1.7) |
i. Food |
31,328 |
43,627 |
42,490 |
(0.7) |
(0.8) |
(0.7) |
ii. Fertiliser |
32,490 |
75,849 |
49,980 |
(0.7) |
(1.4) |
(0.8) |
iii. Petroleum |
2,820 |
2,877 |
3,109 |
(0.1) |
(0.1) |
(0.1) |
iv. Interest subsidy |
2,311 |
4,063 |
2,609 |
(0.0) |
(0.1) |
(0.0) |
v. Other subsidies |
1,977 |
2,827 |
2,744 |
(0.0) |
(0.1) |
(0.0) |
Note: Figures in brackets are percentages to GDP. |
The increase in capital expenditure is also budgeted to grow lower at 7.8 per cent in 2009-10 over 2008-09 (RE) compared to 17.9 per cent increase in 2008-09. The total capital outlay is budgeted to increase by Rs.12,724 crore or 15.3 per cent in 2009-10 over 2008-09 (RE). While the defence capital outlay is estimated to increase by Rs.13,824 crore over 2008-09 (RE), the non-defence capital outlay declined by Rs.1,100 crore over 2008-09 (RE).
Plan and Non-Plan Expenditure An analysis of the expenditure pattern shows that there would be significant moderation in the growth of both non-Plan and Plan components, with the moderation in the latter being far more than the former. The increase in the non-Plan expenditures would mainly arise due to interest payments and defence. The increase in interest payments would reflect substantial hike in government borrowings and special securities issued to Oil Marketing Companies and fertiliser companies during 2008-09. Sizeable rise in budgeted non-Plan expenditure in defence services owe to enhanced provision for normal growth in pay and allowances and maintenance expenditure; and for modernisation of defence services. The Budget also proposes to provide higher grants to the States (Table 6).
Sector-Wise Expenditure The Budget has stated that adequate funds would be ensured for social sector, rural development, and infrastructure sectors during 2009-10. The allocations are: National Rural Employment Guarantee Scheme (Rs.30,100 crore); national programme of Mid-day Meals in schools (Rs.8,000 crore); Sarva Shiksha Abhiyan (Rs.13,100 crore); National Rural Health Mission (Rs.12,070 crore); Integrated Child Development Scheme (Rs.6,705 crore); Rajiv Gandhi Rural Drinking Water Mission (Rs.7,400 crore); Rural Sanitation Programme (Rs.1,200 crore); Bharat Nirman (Rs.40,900 crore) for building rural infrastructure; and Jawaharlal Nehru National Urban Renewal Mission (Rs.11,842 crore).
Table 6: Plan and Non-Plan Expenditure in 2009-10 |
(Rupees crore) |
Item |
2008-09 (RE) |
2009-10 (BE) |
Amount |
(Per cent) |
1 |
2 |
3 |
4 |
5 |
Interest Payments |
1,92,694 |
2,25,511 |
32,817 |
17.0 |
Grants to States |
37,255 |
45,576 |
8,321 |
22.3 |
Food Subsidy |
43,627 |
42,490 |
-1,137 |
-2.6 |
Interest Subsidies |
4,063 |
2,609 |
-1,454 |
-35.8 |
Police |
20,711 |
25,673 |
4,962 |
24.0 |
Agriculture and allied services |
5,891 |
2,364 |
-3,527 |
-59.9 |
Pensions |
32,690 |
34,980 |
2,290 |
7.0 |
Defence Expenditure |
1,14,600 |
1,41,703 |
27,103 |
23.7 |
Grants to States and Uts |
38,421 |
46,626 |
8,205 |
21.4 |
Other Communication Services |
1,676 |
1,885 |
209 |
12.5 |
Capital Outlay |
13,694 |
12,778 |
-916 |
-6.7 |
Other non-plan expenditure |
1,12,674 |
85,887 |
-26,787 |
-23.8 |
Total Non-Plan |
6,17,996 |
6,68,082 |
50,086 |
8.1 |
Central Plan |
2,04,129 |
2,08,450 |
4,321 |
2.1 |
Central Assistance for State and UT Plans |
78,828 |
76,699 |
-2,129 |
-2.7 |
Total Plan |
2,82,957 |
2,85,149 |
2,192 |
0.8 |
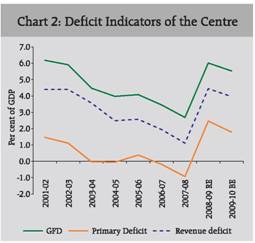
Deficit Indicators The Union Interim Budget for 2009-10 has indicated about relaxation of the FRBM targets for 2008-09 and 2009-10 to provide a boost to demand. However, as a medium term objective, it has recognised the need to revert to fiscal consolidation process at the earliest. The key deficit indicators, viz., RD, GFD and PD, as per cent of GDP, are budgeted at 4.0 per cent, 5.5 per cent and 1.8 per cent in 2009-10, somewhat lower than 4.4 per cent, 6.0 per cent and 2.5 per cent, respectively, in preceding year, but way above the FRBM targets (Chart 2).
RD is budgeted to decline by Rs.2,739 crore in 2009-10 with higher tax receipts more than offsetting the increase in revenue expenditure. GFD, however, is budgeted to increase by Rs.6,320 crore mainly due to higher provisioning for defence capital outlays (Table 7). The deterioration in deficit indicators has been associated with a distinct deterioration in the quality indicator, i.e., sharp rise in the RD to GFD ratio, indicating pre-emption of resources from borrowings for current consumption. This ratio, which fell continuously from 79.7 per cent in 2003-04 to 41.4 per cent in 2007-08, rose to 73.9 per cent in 2008-09 and is estimated at 71.7 per cent in 2009-10, a level that prevailed in 2001-02 (Chart 3).
Table 7 : Movement in Deficit Indicators |
(Rupees crore) |
Item |
2008-09 (RE) |
2009-10 (BE) |
Variation |
1 |
3 |
4 |
5=4-3 |
1. |
Revenue Deficit (3-2) |
2,41,273 |
2,38,534 |
-2,739 |
2. |
Revenue Receipts (i+ii) |
5,62,173 |
6,09,551 |
47,378 |
| |
i. |
Tax Revenue |
4,65,970 |
4,97,596 |
31,626 |
| |
ii. |
Non-Tax Revenue |
96,203 |
1,11,955 |
15,752 |
3. |
Revenue Expenditure |
8,03,446 |
8,48,085 |
44,639 |
| |
of which: |
|
|
|
| |
i. |
Subsidies |
1,29,243 |
1,00,932 |
-28,311 |
| |
ii. |
Interest Payments |
1,92,694 |
2,25,511 |
32,817 |
4. |
Gross Fiscal Deficit (1-5+6+7) |
3,26,515 |
3,32,835 |
6,320 |
5. |
Other receipts |
2,567 |
1,120 |
-1,447 |
6. |
Capital Outlay (i+ii) |
83,305 |
96,029 |
12,724 |
| |
i. |
Defence |
41,000 |
54,824 |
13,824 |
| |
ii. |
Non-defence capital outlay |
42,305 |
41,205 |
-1,100 |
7. |
Net lending |
4,504 |
-608 |
-5,112 |
| |
i. |
Loans |
14,202 |
9,117 |
-5,085 |
| |
ii. |
Recoveries |
9,698 |
9,725 |
27 |
8. |
Gross Primary Deficit (4-3(ii)) |
1,33,821 |
1,07,324 |
-26,497 |
Financing of Gross Fiscal Deficit
An analysis of the financing pattern of GFD reveals that the Government envisages financing most part of the deficit during 2009-10 through market borrowings (dated securities and 364-days Treasury Bills). Net market borrowings would finance 92.7 per cent of the GFD in 2009-10 as against 81.6 per cent in 2008-09. No drawdown of cash balances is envisaged during 2009-10, which financed 9.2 per cent of GFD during 2008-09. External borrowings and securities against small savings would finance 4.8 per cent and 4.0 per cent of GFD in 2009-10, as against 2.9 per cent and 0.4 per cent in 2008-09, respectively (Table 8).
Market Borrowings (Gross)
Taking into account the repayments of market loans (Rs.53,136 crore) and 364-day Treasury Bills (Rs.39,951 crore), the gross market borrowings are placed at Rs.4,01,734 crore in 2009-10. The disbursements under Market Stabilisation Scheme is budgeted at Rs.48,036 crore in 2009-10 with no fresh issuances under the scheme.
Devolution and Transfer of Resources to States and Union Territories The devolution pattern of resources to the State Governments and Union Territories shows an increase in net resource transfer by 6.1 per cent to Rs.3,11,146 crore in 2009-10. With the expected slowdown in the gross tax collection due to economic slowdown, the taxes transferred to the States and Union Territories would increase by 6.9 per cent to Rs.1,71,197 crore. Grants would increase by 8.8 per cent to Rs.1,39,336 crore, with the non-Plan and Plan components rising by 21.4 per cent, 3.4 per cent, respectively (Table 9).
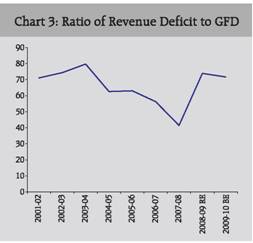
Table 8: Financing Pattern of Gross Fiscal Deficit |
(Rupees crore) |
Item |
2008-09 (RE) |
2009-10 (BE) |
1 |
2 |
3 |
Gross Fiscal Deficit |
3,26,515 |
3,32,835 |
Financed by |
|
|
Market Borrowings |
2,66,539 |
3,08,647 |
(81.6) |
(92.7) |
Securities issued against Small Savings |
1,324 |
13,255 |
(0.4) |
(4.0) |
External Assistance |
9,603 |
16,047 |
(2.9) |
(4.8) |
State Provident Fund |
4,800 |
5,000 |
(1.5) |
(1.5) |
NSSF |
11,206 |
1,022 |
(3.4) |
(0.3) |
Reserve Funds |
-16,808 |
-3,358 |
-(5.1) |
-(1.0) |
Deposit and Advances |
12,788 |
9,026 |
(3.9) |
(2.7) |
Postal Insurance and Life Annuity Funds |
2,594 |
2,672 |
(0.8) |
(0.8) |
Draw down of Cash Balances |
29,984 |
0 |
(9.2) |
(0.0) |
Others |
4,486 |
-19,477 |
(1.4) |
-(5.9) |
Note: Figures in parentheses are percentages to GFD. |
Eleventh Plan Projections vis-a-vis the Budget Estimates for 2009-10 The projections indicated in the Approach Paper to the Eleventh Plan for the major fiscal indicators vis-a-vis the BE for 2009-10 are set out in Table 10. It is observed that the total expenditure and key deficit indicators would exceed the Eleventh Plan projections for 2009-10. Gross budgetary support to Plan would, however, be lower than the projected even though the revenue component would be substantially higher than the Eleventh Plan projections for 2009-10 (Table 10).
Table 9: Resource Transfer to States and Union Territories |
(Amount in Rupees crore) |
Tax |
2008-09 (RE) |
2009-10 (BE) |
Variation (BE over RE) (Per cent) |
1 |
2 |
3 |
4 |
States and UTs Share of Taxes and Duties |
1,60,179 |
1,71,197 |
6.9 |
Grants |
1,28,072 |
1,39,336 |
8.8 |
Non-Plan |
38,421 |
46,627 |
21.4 |
Plan |
89,651 |
92,709 |
3.4 |
Loans |
7,118 |
3,274 |
-54.0 |
Non-Plan |
89 |
89 |
0.0 |
Plan |
7,029 |
3,185 |
-54.7 |
Recovery of Loan and Advances |
2,008 |
2,661 |
32.5 |
Net Resource Transfers |
2,93,361 |
3,11,146 |
6.1 |
UT: Union Territories. |
Table 10:Eleventh Plan Projections vis-a-vis the Budget Estimates |
(As per cent to GDP) |
Item |
2009-10 |
Eleventh Plan Projections |
Budget Estimates |
1 |
2 |
3 |
Centre |
|
|
1. |
Gross Budgetary Support to Plan |
4.97 |
4.74 |
| |
of which |
|
|
| |
Plan revenue Expenditure |
2.87 |
4.12 |
2. |
Total Non-Plan |
8.86 |
11.10 |
| |
of which |
|
|
| |
(i) |
Interest Payments |
2.98 |
3.75 |
| |
(ii) |
Defence |
2.30 |
2.35 |
| |
(iii) |
Non-Plan States grants to |
0.62 |
0.77 |
| |
(iv) |
Subsidies |
0.96 |
1.68 |
3. |
Total Expenditure |
13.83 |
15.83 |
4. |
Gross tax revenue |
12.18 |
11.15 |
| |
less: Share of States |
3.32 |
2.84 |
5. |
Net Tax to Centre |
8.86 |
8.26 |
6. |
Non-tax Revenue |
1.76 |
1.86 |
7. |
Total Revenue Receipts |
10.62 |
10.12 |
8. |
Gross Fiscal Deficit |
3.00 |
5.53 |
9. |
Revenue Deficit |
0.00 |
3.96 |
III. Concluding Observations Several important developments having significant economic and budgetary implications have taken place since the presentation of the Union Budget 2008-09 in February, 2008. In the first half of the current fiscal year, rising prices in the world commodity markets, including petroleum products, required Government to take various fiscal and administrative measures in concert with monetary policy initiatives by the Reserve Bank of India to reduce the impact of inflationary pressures in the economy. Various tax reduction measures were undertaken to reduce the impact of global price rise on Indian economy. At the same time, Government also made higher provisions for food and fertiliser subsidies to minimise the adverse effect of inflation on the vulnerable sections of the society. In the second half of 2008-09, in the aftermath of global financial turmoil, additional spending coupled with further tax cuts were undertaken to propel growth. It may, however, be noted that a significant part of the additional spending was for items announced in the budget 2008-09 but no provision was made for. All these measures led to sharp deterioration in all the deficit indicators during 2008-09 from those envisaged in budget estimates.
The interim budget has to be seen in the context in which it has been placed. With the world economy faced with recessionary trend, as a fall out of the financial turmoil, India will also face moderation in the levels of economic activities. The actual fiscal outcomes during 2008-09 and 2009-10 would crucially hinge upon the level of economic growth, which at the present juncture appears to be highly uncertain. The present budget being a Vote-on-Account, the Government has not made any tax proposals and sought sanction of expenditure for four months. The major tax and expenditure measures, if any, could only be expected in the Regular Budget by the new Government at the Centre after election. Hence, the budget estimates may be taken as indicative. However, it may be noted that after the presentation of the interim budget 2009-10, Government on February 24, 2009 announced further cuts in excise and service tax rates to support growth. The deviation of fiscal deficits during 2008-09 and 2009-10 from the FRBM targets may be visualised in this context under the exclusion clause of exceptional circumstances. |
| |
Statement 1: Budget at a Glance |
(Rs. crore) |
Items |
2007-08 (Actuals) |
2008-09 (Budget Estimates) |
2008-09 (Revised Estimates) |
2009-10 (Budget Estimates) |
1 |
2 |
3 |
4 |
5 |
1. |
Revenue Receipts (i+ii) |
541,925 |
602,935 |
562,173 |
609,551 |
| |
i) |
Tax Revenue (Net to Centre) |
439,547 |
507,150 |
465,970 |
497,596 |
| |
ii) |
Non-tax Revenue |
102,378 |
95,785 |
96,203 |
111,955 |
| |
|
of which: |
|
|
|
|
| |
|
Interest Receipts |
21,060 |
19,135 |
19,036 |
19,000 |
2. |
Capital Receipts |
136,498 * |
147,949 |
338,780 |
343,680 |
| |
of which: |
|
|
|
|
| |
i) |
Market Borrowings |
130,600 |
99,000 |
266,539 |
308,647 |
| |
ii) |
Recoveries of Loans |
5,100 |
4,497 |
9,698 |
9,725 |
| |
iii) |
Disinvestment of equity in PSUs |
4,486 * |
10,165 |
2,567 |
1,120 |
3. |
Total Receipts (1+2) |
678,423 * |
750,884 |
900,953 |
953,231 |
4. |
Revenue Expenditure (i + ii) |
594,494 |
658,119 |
803,446 |
848,085 |
| |
i) |
Non-Plan |
420,922 |
448,352 |
561,790 |
599,736 |
| |
ii) |
Plan |
173,572 |
209,767 |
241,656 |
248,349 |
5. |
Capital Expenditure (i + ii) |
82,707 # |
92,765 |
97,507 |
105,146 |
| |
i) |
Non-Plan |
51,197 # |
59,146 |
56,206 |
68,346 |
| |
ii) |
Plan |
31,510 |
33,619 |
41,301 |
36,800 |
6. |
Total Non-Plan Expenditure (4i + 5i) |
472,119 # |
507,498 |
617,996 |
668,082 |
| |
of which: |
|
|
|
|
| |
i) |
Interest Payments |
171,030 |
190,807 |
192,694 |
225,511 |
| |
ii) |
Defence |
91,681 |
105,600 |
114,600 |
141,703 |
| |
iii) |
Subsidies |
70,926 |
71,431 |
129,243 |
100,932 |
7. |
Total Plan Expenditure (4ii + 5ii) |
205,082 |
243,386 |
282,957 |
285,149 |
8. |
Total Expenditure (6+7=4+5) |
677,201 # |
750,884 |
900,953 |
953,231 |
9. |
Revenue Deficit (4-1) |
52,569 |
55,184 |
241,273 |
238,534 |
| |
|
(1.1) |
(1.0) |
(4.4) |
(4.0) |
10. |
Gross Fiscal Deficit (8-(1+2ii+2iii)) |
125,690 *# |
133,287 |
326,515 |
332,835 |
| |
|
(2.7) |
(2.5) |
(6.0) |
(5.5) |
11. |
Gross Primary Deficit (10-6i) |
-45,340 *# |
-57,520 |
133,821 |
107,324 |
| |
|
-(1.0) |
-(1.1) |
(2.5) |
(1.8) |
* : Net of transfer of profit from RBI to the Union Government amounting to Rs.34,309 crore.
# : Net of acquisition cost of RBI’s stake in State Bank of India (SBI) at Rs.35,531 crore.
Note : 1. Capital Receipts are net of repayments.
2. Market borrowings include dated securities and 364 day Treasury Bills.
Source : Budget documents of Government of India, 2009-10. |
|
| |
Statement 1: Budget at a Glance (Concld.) |
(Rs. crore) |
Items |
Variations |
| |
Col.4 over Col. 3 |
Col.4 over Col. 2 |
Col.5 over Col. 4 |
| |
Amount |
Per cent |
Amount |
Per cent |
Amount |
Per cent |
1 |
6 |
7 |
8 |
9 |
10 |
11 |
1. |
Revenue Receipts (i+ii) |
-40,762 |
-6.8 |
20,248 |
3.7 |
47,378 |
8.4 |
| |
i) |
Tax Revenue (Net to Centre) |
-41,180 |
-8.1 |
26,423 |
6.0 |
31,626 |
6.8 |
| |
ii) |
Non-tax Revenue |
418 |
0.4 |
-6,175 |
-6.0 |
15,752 |
16.4 |
| |
|
of which: |
|
|
|
|
|
|
| |
|
Interest Receipts |
–99 |
-0.5 |
-2,024 |
-9.6 |
-36 |
-0.2 |
2. |
Capital Receipts |
190,831 |
129.0 |
202,282 |
148.2 |
4,900 |
1.4 |
| |
of which: |
|
|
|
|
|
|
| |
i) |
Market Borrowings |
167,539 |
169.2 |
135,939 |
104.1 |
42,108 |
15.8 |
| |
ii) |
Recoveries of Loans |
5,201 |
115.7 |
4,598 |
90.2 |
27 |
0.3 |
| |
iii) |
Disinvestment of equity in PSUs |
-7,598 |
-74.7 |
-1,919 |
-42.8 |
-1,447 |
-56.4 |
3. |
Total Receipts (1+2) |
150,069 |
20.0 |
222,530 |
32.8 |
52,278 |
5.8 |
4. |
Revenue Expenditure (i + ii) |
145,327 |
22.1 |
208,952 |
35.1 |
44,639 |
5.6 |
| |
i) |
Non-Plan |
113,438 |
253 |
140,868 |
33.5 |
37,946 |
6.8 |
| |
ii) |
Plan |
31,889 |
15.2 |
68,084 |
39.2 |
6,693 |
2.8 |
5. |
Capital Expenditure (i + ii) |
4,742 |
5.1 |
14,800 |
17.9 |
7,639 |
7.8 |
| |
i) |
Non-Plan |
-2,940 |
-5.0 |
5,009 |
9.8 |
12,140 |
21.6 |
| |
ii) |
Plan |
7,682 |
22.9 |
9,791 |
31.1 |
-4,501 |
-10.9 |
6. |
Total Non-Plan Expenditure (4i + 5i) |
110,498 |
21.8 |
145,877 |
30.9 |
50,086 |
8.1 |
| |
Of which: |
|
|
|
|
|
|
| |
i) |
Interest Payments |
1,887 |
1.0 |
21,664 |
12.7 |
32,817 |
17.0 |
| |
ii) |
Defence |
9,000 |
8.5 |
22,919 |
25.0 |
27,103 |
23.7 |
| |
iii) |
Subsidies |
57,812 |
80.9 |
58,317 |
82.2 |
-28,311 |
-21.9 |
7. |
Total Plan Expenditure (4ii + 5ii) |
39,571 |
16.3 |
77,875 |
38.0 |
2,192 |
0.8 |
8. |
Total Expenditure (6+7=4+5) |
150,069 |
20.0 |
223,752 |
33.0 |
52,278 |
5.8 |
9. |
Revenue Deficit (4-1) |
186,089 |
337.2 |
188,704 |
359.0 |
-2,739 |
-1.1 |
10. |
Gross Fiscal Deficit (8-(1+2ii+2iii)) |
193,228 |
145.0 |
200,825 |
159.8 |
6,320 |
1.9 |
| |
|
|
|
|
|
|
|
11. |
Gross Primary Deficit (10-6i) |
191,341 |
-332.7 |
179,161 |
-395.1 |
-26,497 |
-19.8 |
|
| |
Statement 2 : Transactions on Revenue Account |
(Rs. crore) |
Items |
2007-08 (Actuals) |
2008-09 (Budget Estimates) |
2008-09 (Revised Estimates) |
2009-10 (Budget Estimates) |
1 |
2 |
3 |
4 |
5 |
I. |
Revenue Receipts (A+B) |
541,925 |
602,935 |
562,173 |
609,551 |
| |
A. |
Tax Revenue(Net to Centre)(a-b-c) |
439,547 |
507,150 |
465,970 |
497,596 |
| |
|
a) |
Gross Tax Revenue |
593,147 |
687,715 |
627,949 |
671,293 |
| |
|
|
of which : |
(12.6) |
(12.7) |
(11.6) |
(11.1) |
| |
|
|
1. |
Corporation Tax |
192,911 |
226,361 |
222,000 |
244,200 |
| |
|
|
2. |
Personal Income Tax |
102,644 |
120,604 |
108,000 |
118,800 |
| |
|
|
3. |
Customs Duty |
104,119 |
118,930 |
108,000 |
110,187 |
| |
|
|
4. |
Union Excise Duty |
123,611 |
137,874 |
108,359 |
110,604 |
| |
|
|
5. |
Service Tax |
51,301 |
64,460 |
65,000 |
68,900 |
| |
|
|
6. |
Securities Transaction Tax |
8,576 |
9,000 |
5,500 |
6,325 |
| |
|
|
7. |
Banking Cash Transaction Tax |
586 |
550 |
600 |
50 |
| |
|
|
8. |
Taxes of UTs (Net of Assignments |
|
|
|
|
| |
|
|
|
to Local Bodies) |
1,324 |
1451 |
1,590 |
1,602 |
| |
|
|
9. |
Fringe Benefit Tax |
7,098 |
8160 |
8,500 |
10,200 |
| |
|
|
10. |
Other Taxes and Duties |
8,075 |
8,485 |
8,900 |
10,625 |
| |
|
b) |
States’ Share |
151,800 |
178,765 |
160,179 |
171,197 |
| |
|
c) |
Surcharge transferred to NCCF# |
1,800 |
1,800 |
1,800 |
2,500 |
| |
B. |
Non-Tax Revenue |
102,378 |
95,785 |
96,203 |
111,955 |
| |
|
of which : |
|
|
|
|
| |
|
1. |
Interest Receipts |
21,060 |
19,135 |
19,036 |
19,000 |
| |
|
2. |
Dividends and Profits |
34,499 |
43,204 |
39,736 |
36,985 |
| |
|
3. |
External Grants |
2,723 |
1,795 |
2,748 |
2,136 |
| |
|
4. |
Non-tax Receipts of UTs |
811 |
815 |
749 |
754 |
| |
|
5. |
Other Non-Tax Revenue |
43,285 |
30,836 |
33,934 |
53,080 |
II. |
Revenue Expenditure (A+B) |
594,494 |
658,119 |
803,446 |
848,085 |
| |
A. |
Non-Plan Expenditure |
420,922 |
448,352 |
561,790 |
599,736 |
| |
|
of which : |
|
|
|
|
| |
|
1. |
Interest Payments |
171,030 |
190,807 |
192,694 |
225,511 |
| |
|
2. |
Defence Revenue Expenditure |
54,219 |
57,593 |
73,600 |
86,879 |
| |
|
3. |
Subsidies |
70,926 |
71,431 |
129,243 |
100,932 |
| |
|
4. |
Non-Plan Grants to States and UTs |
35,769 |
43,294 |
38,421 |
46,626 |
| |
B. |
Plan Expenditure (1+2) |
173,572 |
209,767 |
241,656 |
248,349 |
| |
|
1. |
Central Plan |
119,666 |
151,417 |
171,633 |
176,348 |
| |
|
2. |
Central Assistance for State and UT Plans |
53,906 |
58,350 |
70,023 |
72,001 |
III. |
Revenue Deficit (-)/Surplus(+) [ I-II ] |
-52,569 |
-55,184 |
-241,273 |
-238,534 |
# : NCCF: National Calamity Contingency Fund.
Note : Figures in parentheses are percentages to GDP.
Source: Budget Documents of the Government of India, 2009-10. |
|
| |
Statement 2: Transactions on Revenue Account (Concld.) |
(Rs. crore) |
Items |
Variations |
Col.4 over Col. 3 |
Col.4 over Col. 2 |
Col.5 over Col. 4 |
Amount |
Per cent |
Amount |
Per cent |
Amount |
Per cent |
1 |
6 |
7 |
8 |
9 |
10 |
11 |
I. |
Revenue Receipts (A+B) |
-40,762 |
-6.8 |
20,248 |
3.7 |
47,378 |
8.4 |
| |
A. |
Tax Revenue(Net to Centre)(a-b-c) |
-41,180 |
-8.1 |
26,423 |
6.0 |
31,626 |
6.8 |
| |
|
a) |
Gross Tax Revenue |
-59,766 |
-8.7 |
34,802 |
5.9 |
43,344 |
6.9 |
| |
|
|
of which : |
|
|
|
|
|
|
| |
|
|
1. |
Corporation Tax |
-4,361 |
-1.9 |
29,089 |
15.1 |
22,200 |
10.0 |
| |
|
|
2. |
Personal Income Tax |
-12,604 |
-10.5 |
5,356 |
5.2 |
10,800 |
10.0 |
| |
|
|
3. |
Customs Duty |
-10,930 |
-9.2 |
3,881 |
3.7 |
2,187 |
2.0 |
| |
|
|
4. |
Union Excise Duty |
-29,515 |
-21.4 |
-15,252 |
-12.3 |
2,245 |
2.1 |
| |
|
|
5. |
Service Tax |
540 |
0.8 |
13,699 |
26.7 |
3,900 |
6.0 |
| |
|
|
6. |
Securities Transaction Tax |
-3,500 |
-38.9 |
-3,076 |
-35.9 |
825 |
15.0 |
| |
|
|
7. |
Banking Cash Transaction Tax |
50 |
9.1 |
14 |
2.4 |
-550 |
-91.7 |
| |
|
|
8. |
Taxes of UTs (Net of Assignments |
|
|
|
|
|
|
| |
|
|
|
to Local Bodies) |
139 |
9.6 |
266 |
20.1 |
12 |
0.8 |
| |
|
|
9. |
Fringe Benefit Tax |
340 |
4.2 |
1,402 |
19.8 |
1,700 |
20.0 |
| |
|
|
10. |
Other Taxes and Duties |
415 |
4.9 |
825 |
10.2 |
1,725 |
19.4 |
| |
|
b) |
States’ Share |
-18,586 |
-10.4 |
8,379 |
5.5 |
11,018 |
6.9 |
| |
|
c) |
Surcharge transferred to NCCF# |
0 |
0.0 |
0 |
0.0 |
700 |
38.9 |
| |
B. |
Non-Tax Revenue |
418 |
0.4 |
-6,175 |
-6.0 |
15,752 |
16.4 |
| |
|
of which : |
|
|
|
|
|
|
| |
|
1. |
Interest Receipts |
–99 |
-0.5 |
-2,024 |
-9.6 |
-36 |
-0.2 |
| |
|
2. |
Dividends and Profits |
-3,468 |
-8.0 |
5,237 |
15.2 |
-2,751 |
-6.9 |
| |
|
3. |
External Grants |
953 |
53.1 |
25 |
0.9 |
-612 |
-22.3 |
| |
|
4. |
Non-tax Receipts of UTs |
–66 |
-8.1 |
-62 |
-7.6 |
5 |
0.7 |
| |
|
5. |
Other Non-Tax Revenue |
3,098 |
10.0 |
-9,351 |
-21.6 |
19,146 |
56.4 |
II. |
Revenue Expenditure (A+B) |
145,327 |
22.1 |
208,952 |
35.1 |
44,639 |
5.6 |
| |
A. |
Non-Plan Expenditure |
113,438 |
25.3 |
140,868 |
33.5 |
37,946 |
6.8 |
| |
|
of which : |
|
|
|
|
|
|
| |
|
1. |
Interest Payments |
1,887 |
1.0 |
21,664 |
12.7 |
32,817 |
17.0 |
| |
|
2. |
Defence Revenue Expenditure |
16,007 |
27.8 |
19,381 |
35.7 |
13,279 |
18.0 |
| |
|
3. |
Subsidies |
57,812 |
80.9 |
58,317 |
82.2 |
-28,311 |
-21.9 |
| |
|
4. |
Non-Plan Grants to States and UTs |
-4,873 |
-11.3 |
2,652 |
7.4 |
8,205 |
21.4 |
| |
B. |
Plan Expenditure (1+2) |
31,889 |
15.2 |
68,084 |
39.2 |
6,693 |
2.8 |
| |
|
1. |
Central Plan |
20,216 |
13.4 |
51,967 |
43.4 |
4,715 |
2.7 |
| |
|
2. |
Central Assistance for State and UT Plans |
11,673 |
20.0 |
16,117 |
29.9 |
1,978 |
2.8 |
III. |
Revenue Deficit (-)/Surplus(+) [ I-II ] |
-186,089 |
337.2 |
-188,704 |
359.0 |
2,739 |
-1.1 |
|
| |
Statement 3: Transactions on Capital Account |
(Rs. crore) |
Items |
2007-08 (Actuals) |
2008-09 (Budget Estimates) |
2008-09 (Revised Estimates) |
2009-10 (Budget Estimates) |
1 |
2 |
3 |
4 |
5 |
I. Capital Receipts (1 to 10) |
136,498* |
147,949 |
338,780 |
343,680 |
| |
1. |
Market Borrowings |
130,600 |
99,000 |
266,539 |
308,647 |
| |
2. |
Securities against Small Savings |
-11,302 |
9,873 |
1,323 |
13,256 |
| |
3. |
State Provident Funds |
3,897 |
4,800 |
4,800 |
5,000 |
| |
4. |
Special Deposits |
— |
— |
— |
— |
| |
5. |
Reserve Funds and Deposits |
-5,634 |
7,657 |
-4,020 |
5,669 |
| |
6. |
NSSF |
-174 |
53 |
11,206 |
1,021 |
| |
7. |
Recovery of Loans and Advances |
5,100 |
4,497 |
9,698 |
9,725 |
| |
8. |
Disinvestment of Equity Holding in |
|
|
|
|
| |
|
Public Sector Enterprises |
4,487 * |
10,165 |
2,567 |
1,120 |
| |
9. |
External Borrowings |
9,315 |
10,989 |
9,603 |
16,047 |
| |
10 |
Others |
209 |
915 |
37,064 |
-16,805 |
II. |
Capital Expenditure (1+2) |
82,707 # |
92,765 |
97,507 |
105,146 |
| |
1. |
Non Plan Expenditure |
51,197 # |
59,146 |
56,206 |
68,346 |
| |
|
of which: |
|
|
|
|
| |
|
Defence Capital |
37,462 |
48,007 |
41,000 |
54,824 |
| |
2. |
Plan Expenditure (i+ii) |
31,510 |
33,619 |
41,301 |
36,800 |
| |
|
i) Central Plan |
23,802 |
28,537 |
32,496 |
32,102 |
| |
|
ii) Central Assistance for State and UT Plans |
7,708 |
5,082 |
8,805 |
4,698 |
III. |
Capital Surplus(+)/Deficit(-) [I-II] |
+53,791 |
+55,184 |
+241,273 |
+238,534 |
— : Not available.
* : Excludes an amount of Rs.34,309 crore on account of transaction relating to transfer of RBI’s stake in SBI to the Government.
# : Net of acquisition cost of RBI’s stake in State Bank of India (SBI) at Rs.35,531 crore.
Note : 1) Capital Receipts are net of repayments.
2) Market borrowings include dated securities and 364-day Treasury Bills.
Source: Budget documents of Government of India, 2009-2010. |
|
| |
Statement 3: Transactions on Capital Account (Concld.) |
(Rs. crore) |
Items |
Variations |
Col.4 over Col. 3 |
Col.4 over Col. 2 |
Col.5 over Col. 4 |
Amount |
Per cent |
Amount |
Per cent |
Amount |
Per cent |
1 |
6 |
7 |
8 |
9 |
10 |
11 |
I. |
Capital Receipts (1 to 10) |
190,831 |
129.0 |
202,282 |
148.2 |
4,900 |
1.4 |
| |
1. |
Market Borrowings |
167,539 |
169.2 |
135,939 |
104.1 |
42,108 |
15.8 |
| |
2. |
Securities against Small Savings |
-8,550 |
-86.6 |
12,625 |
-111.7 |
11,933 |
902.0 |
| |
3. |
State Provident Funds |
0 |
0.0 |
903 |
23.2 |
200 |
4.2 |
| |
4. |
Special Deposits |
— |
— |
— |
— |
— |
— |
| |
5. |
Reserve Funds and Deposits |
-11,677 |
-152.5 |
1,614 |
-28.6 |
9,689 |
-241.0 |
| |
6. |
NSSF |
11,153 |
21,043.4 |
11,380 |
-6,540.2 |
-10,185 |
-90.9 |
| |
7. |
Recovery of Loans and Advances |
5,201 |
115.7 |
4,598 |
90.2 |
27 |
0.3 |
| |
8. |
Disinvestment of Equity Holding in |
|
|
|
|
|
|
| |
|
Public Sector Enterprises |
-7,598 |
-74.7 |
-1,920 |
-42.8 |
-1,447 |
-56.4 |
| |
9. |
External Borrowings |
-1,386 |
-12.6 |
288 |
3.1 |
6,444 |
67.1 |
| |
10. |
Others |
36,149 |
3,950.7 |
36,855 |
17,634.0 |
-53,869 |
-145.3 |
II. |
Capital Expenditure (1+2) |
4,742 |
5.1 |
14,800 |
17.9 |
7,639 |
7.8 |
| |
1. |
Non Plan Expenditure |
-2,940 |
-5.0 |
5,009 |
9.8 |
12,140 |
21.6 |
| |
|
of which: |
|
|
|
|
|
|
| |
|
Defence Capital |
-7,007 |
-14.6 |
3,538 |
9.4 |
13,824 |
33.7 |
| |
2. |
Plan Expenditure (i+ii) |
7,682 |
22.9 |
9,791 |
31.1 |
-4,501 |
-10.9 |
| |
|
i) Central Plan |
3,959 |
13.9 |
8,694 |
36.5 |
-394 |
-1.2 |
| |
|
ii) Central Assistance for State and UT Plans |
3,723 |
73.3 |
1,097 |
14.2 |
-4,107 |
-46.6 |
III. |
Capital Surplus(+)/Deficit(-) [I-II] |
186,089 |
337.2 |
187,482 |
348.5 |
-2,739 |
-1.1 |
|
| |
Statement 4: Financing of Gross Fiscal Deficit of the Central Government |
|
(Rs. crore)
|
Year |
Internal Finance |
External Finance |
Total Finance/ Gross Fiscal Deficit (5+6) |
Market Borrowings # |
Other Borrowings @ |
Draw Down of Cash Balances * |
Total (2+3+4) |
1 |
2 |
3 |
4 |
5 |
6 |
7 |
1990-91 |
8,001 |
22,103 |
11,347 |
41,451 |
3,181 |
44,632 |
(17.9) |
(49.5) |
(25.4) |
(92.9) |
(7.1) |
(100.0) |
1991-92 |
7,510 |
16,539 |
6,855 |
30,904 |
5,421 |
36,325 |
(20.7) |
(45.5) |
(18.9) |
(85.1) |
(14.9) |
(100.0) |
1992-93 |
3,676 |
18,866 |
12,312 |
34,854 |
5,319 |
40,173 |
(9.2) |
(47.0) |
(30.6) |
(86.8) |
(13.2) |
(100.0) |
1993-94 |
28,928 |
15,295 |
10,960 |
55,183 |
5,074 |
60,257 |
(48.0) |
(25.4) |
(18.2) |
(91.6) |
(8.4) |
(100.0) |
1994-95 |
20,326 |
32,834 |
961 |
54,121 |
3,582 |
57,703 |
(35.2) |
(56.9) |
(1.7) |
(93.8) |
(6.2) |
(100.0) |
1995-96 |
34,001 |
16,117 |
9,807 |
59,925 |
318 |
60,243 |
(56.4) |
(26.8) |
(16.3) |
(99.5) |
(0.5) |
(100.0) |
1996-97 |
19,093 |
31,469 |
13,184 |
63,746 |
2,987 |
66,733 |
(28.6) |
(47.2) |
(19.8) |
(95.5) |
(4.5) |
(100.0) |
1997-98 |
32,499 |
56,257 |
-910 |
87,846 |
1,091 |
88,937 |
(36.5) |
(63.3) |
-(1.0) |
(98.8) |
(1.2) |
(100.0) |
1998-99 |
68,988 |
42,650 |
-209 |
111,429 |
1,920 |
113,349 |
(60.9) |
(37.6) |
-(0.2) |
(98.3) |
(1.7) |
(100.0) |
1999-2000 |
62,076 |
40,597 |
864 |
103,537 |
1,180 |
104,717 |
(59.3) |
(38.8) |
(0.8) |
(98.9) |
(1.1) |
(100.0) |
2000-01 |
73,431 |
39,077 |
-1,197 |
111,311 |
7,505 |
118,816 |
(61.8) |
(32.9) |
-(1.0) |
(93.7) |
(6.3) |
(100.0) |
2001-02 |
90,812 |
46,038 |
-1,496 |
135,354 |
5,601 |
140,955 |
(64.4) |
(32.7) |
-(1.1) |
(96.0) |
(4.0) |
(100.0) |
2002-03 |
104,126 |
50,997 |
1,883 |
157,006 |
-11,934 |
145,072 |
(71.8) |
(35.2) |
(1.3) |
(108.2) |
-(8.2) |
(100.0) |
2003-04 |
88,870 |
51,833 |
-3,942 |
136,761 |
-13,488 |
123,273 |
(72.1) |
(42.0) |
-(3.2) |
(110.9) |
-(10.9) |
(100.0) |
2004-05 |
50,940 & |
68,231 |
-8,130 |
111,041 |
14,753 |
125,794 |
(40.5) |
(54.2) |
-(6.5) |
(88.3) |
(11.7) |
(100.0) |
2005-06 |
106,241 & |
53,610 |
-20,888 |
138,963 |
7,472 |
146,435 |
(72.6) |
(36.6) |
-(14.3) |
(94.9) |
(5.1) |
(100.0) |
2006-07 |
114,801 & |
14,782 |
4,518 |
134,101 |
8,472 |
142,573 |
(80.5) |
(10.4) |
(3.2) |
(94.1) |
(5.9) |
(100.0) |
2007-08 |
130,600 & |
-39,597 |
26,594 |
117,597 |
9,315 |
126,912 |
(102.9) |
-(31.2) |
(21.0) |
(92.7) |
(7.3) |
(100.0) |
2008-09 (RE) |
266,539 & |
20,389 |
29,984 |
316,912 |
9,603 |
326,515 |
(81.6) |
(6.2) |
(9.2) |
(97.1) |
(2.9) |
(100.0) |
2009-10 (BE) |
308,647 & |
8,141 |
0 |
316,788 |
16,047 |
332,835 |
(92.7) |
(2.4) |
(0.0) |
(95.2) |
(4.8) |
(100.0) |
RE : Revised Estimates. BE : Budget Estimates.
# : Includes dated securities and 364-days Treasury Bills.
@ : Other borrowings includes small savings, state provident funds, special deposits, reserve funds, etc. For the years 1999-2000 to 2001-02, small savings and public provident fund are represented by National Savings Fund (NSSF)’s investment in Central Government special securities and hence form part of Centre’s internal debt.
* : Prior to 1997-98, represents variations in 91-day Treasury Bills issued net of changes in cash balances with the Reserve Bank.
& : Exclusive of amount raised under Market Stabilisation Scheme.
Note : Figures in parentheses represent percentages to total finance (gross fiscal deficit).
Source : Central Government Budget Documents. |
|
| |
|
Statement 5: Central Plan Outlay by Heads of Development
|
|
(Rs. crore)
|
Items |
2008-09 (Budget Estimates) |
2008-09 (Revised Estimates) |
2009-10 (Budget Estimates) |
Variation |
Col. 3 over Col. 2 |
Col. 4 over Col. 3 |
Amount |
Per cent |
Amount |
Per cent |
1 |
2 |
3 |
4 |
5 |
6 |
7 |
8 |
1. |
Agriculture |
10,074 |
9,969 |
10,136 |
-105 |
-1.0 |
167 |
1.7 |
| |
|
(2.7) |
(2.6) |
(2.4) |
|
|
|
|
2. |
Rural Development* |
23,831 |
48,884 |
42,774 |
25,053 |
105.1 |
-6,110 |
-12.5 |
| |
|
(6.3) |
(12.6) |
(10.3) |
|
|
|
|
3. |
Irrigation and Flood Control |
411 |
367 |
439 |
–44 |
-10.7 |
72 |
19.6 |
| |
|
(0.1) |
(0.1) |
(0.1) |
|
|
|
|
4. |
Energy of which : |
93,815 |
98,877 |
114,537 |
5,062 |
5.4 |
15,660 |
15.8 |
| |
|
(25.0) |
(25.5) |
(27.6) |
|
|
|
|
| |
a) Power |
45,238 |
40,512 |
55,919 |
-4,726 |
-10.4 |
15,407 |
38.0 |
| |
|
(12.0) |
(10.4) |
(13.5) |
|
|
|
|
| |
b) Petroleum |
42,450 |
53,147 |
53,043 |
10,697 |
25.2 |
-104 |
-0.2 |
| |
|
(11.3) |
(13.7) |
(12.8) |
|
|
|
|
5. |
Industry and Minerals |
28,836 |
27,193 |
33,830 |
-1,643 |
-5.7 |
6,637 |
24.4 |
| |
|
(7.7) |
(7.0) |
(8.1) |
|
|
|
|
6. |
Transport ** |
84,177 |
78,269 |
86,218 |
-5,908 |
-7.0 |
7,949 |
10.2 |
| |
|
(22.4) |
(20.2) |
(20.7) |
|
|
|
|
7. |
Communications |
21,937 |
20,237 |
16,680 |
-1,700 |
-7.7 |
-3,557 |
-17.6 |
| |
|
(5.8) |
(5.2) |
(4.0) |
|
|
|
|
8. |
Science, Technology and Environment |
9,283 |
8,547 |
9,552 |
-736 |
-7.9 |
1,005 |
11.8 |
| |
|
(2.5) |
(2.2) |
(2.3) |
|
|
|
|
9. |
Social Services # |
95,919 |
89,692 |
94,289 |
-6,227 |
-6.5 |
4,597 |
5.1 |
| |
|
(25.5) |
(23.1) |
(22.7) |
|
|
|
|
10. |
Others |
7,202 |
6,043 |
7,236 |
-1,159 |
-16.1 |
1,193 |
19.7 |
| |
|
(1.9) |
(1.6) |
(1.7) |
|
|
|
|
Total (1 to 10) |
375,485 |
388,078 |
415,691 |
12,593 |
3.4 |
27,613 |
7.1 |
| |
(100.0) |
(100.0) |
(100.0) |
|
|
|
|
To be financed by : |
|
|
|
|
|
|
|
1. |
Budgetary Support |
179,954 |
204,128 |
208,450 |
24,174 |
13.4 |
4,322 |
2.1 |
| |
|
(47.9) |
(52.6) |
(50.1) |
|
|
|
|
2. |
Internal and Extra Budgetary Resources (IEBR) of Public Social Enterprises, etc. |
195,531 |
183,950 |
207,241 |
-11,581 |
-5.9 |
23,291 |
12.7 |
| |
|
(52.1) |
(47.4) |
(49.9) |
|
|
|
|
* : Includes provision for rural housing but excludes provision for rural roads.
** : Includes provision for rural roads.
# : Excludes provision for rural housing.
Note : Figures in parentheses represent percentages to total.
Source : Budget documents of Government of India, 2009-10. |
|
| |
Statement 6: Resources Transferred to States and Union Territory Governments |
(Rs. crore) |
Items |
2008-09 (Budget Estimates) |
2008-09 (Revised Estimates) |
2009-10 (Budget Estimates) |
Variation |
Col. 3 over Col. 2 |
Col. 4 over Col. 3 |
Amount |
Per cent |
Amount |
Per cent |
1 |
2 |
3 |
4 |
5 |
6 |
7 |
8 |
A. |
State’s Share in Central Taxes and Duties |
178,765 |
160,179 |
171,197 |
-18,586 |
-10.4 |
11,018 |
6.9 |
B. |
Total Grants (i+ii) |
124,746 |
128,072 |
139,336 |
3,326 |
2.7 |
11,264 |
8.8 |
| |
i) Plan |
81,452 |
89,651 |
92,709 |
8,199 |
10.1 |
3,058 |
3.4 |
| |
ii) Non-Plan |
43,294 |
38,421 |
46,627 |
-4,873 |
-11.3 |
8,206 |
21.4 |
C. |
Total Non-Plan Loans * |
89 |
89 |
89 |
0 |
0.0 |
0 |
0.0 |
D. |
Plan Loans (i+ii) |
4,026 |
7,029 |
3,185 |
3,003 |
74.6 |
-3,844 |
-54.7 |
| |
i) Assistance for States & Union Territory Plans |
3,868 |
7,029 |
3,185 |
3,161 |
81.7 |
-3,844 |
-54.7 |
| |
ii) Assistance for Central & Centrally Sponsored Plan Schemes |
158 |
0 |
0 |
-158 |
-100.0 |
0 |
— |
E. |
Gross Transfers (A to D) |
307,626 |
295,369 |
313,807 |
-12,257 |
-4.0 |
18,438 |
6.2 |
F. |
Recovery of Loans & Advances |
2,666 |
2,008 |
2,661 |
-658 |
-24.7 |
653 |
32.5 |
G. |
Net Resources transferred to States & UT Governments (E-F) |
304,960 |
293,361 |
311,146 |
-11,599 |
-3.8 |
17,785 |
6.1 |
* : Net of recovery of short-term loans and advances.
Source: Budget documents of Government of India, 2009-10. |
|
| |
Statement 7: Interest Payments by the Central Government |
(Rs. crore) |
Item |
1990-91 (Accounts) |
2000-2001 (Accounts) |
2001-2002 (Accounts) |
2002-2003 (Accounts) |
2003-2004 (Accounts) |
2004-05 (Accounts) |
1 |
2 |
3 |
4 |
5 |
6 |
7 |
I. |
Interest Payments on Internal Debt |
9,814 |
57,605 |
66,035 |
75,176 |
82,620 |
86,380 |
| |
of which : |
|
|
|
|
|
|
| |
i) On Market Loans* |
6,366 |
46,214 |
55,024 |
62,559 |
68,765 |
69,852 |
| |
ii) On Treasury Bills** |
3,392 |
6,395 |
6,453 |
6,151 |
3,542 |
2,165 |
| |
iii) On Marketable securities issued in conversion of special securities |
— |
2,399 |
2,399 |
3,067 |
6,263 |
7,753 |
II. |
Interest on External debt |
1,834 |
4,413 |
4,285 |
4,252 |
3,139 |
2,808 |
III. |
Interest on Small Savings Deposits, Certificates and PPF @ |
4,128 |
21,477 |
22,471 |
23,379 |
20,503 |
18,950 |
IV. |
Interest on State Provident Funds |
885 |
3,879 |
3,794 |
3,913 |
3,733 |
4,425 |
V. |
Interest on Special Deposits of Non-Government Provident Funds etc. |
3,876 |
12,575 |
14,259 |
13,625 |
13,161 |
12,892 |
VI. |
Interest on Reserve Funds |
112 |
161 |
129 |
229 |
352 |
541 |
VII. |
Interest on Other Obligations |
325 |
854 |
567 |
1,214 |
1,400 |
1,592 |
VIII. |
Others # |
524 |
2,260 |
2,633 |
3,099 |
7,286 |
654 |
Total Interest Payments (I to VIII) |
21,498 |
103,224 |
114,173 |
124,887 |
132,194 |
130,958 |
* : Represents dated securities.
** : Also includes special securities issued to RBI in conversion of Treasury Bills.
@ : Since 1999-2000, these payments form part of internal debt.
# : Includes inter alia, interest on insurance and pension funds, bonus on field deposits and interest on other deposits and accounts.
Note : 1. The data are taken from Finance Accounts and Expenditure Budget volume 2 and the aggregate figures for interest payments may not tally for some years with the data produced elsewhere.
2. Since 1999-2000, interest on small savings represent interest on Central Government special securities issued to the NSSF.
Source : Finance Accounts and Budget documents of the Government of India. |
|
| |
Statement 7: Interest Payments by the Central Government (Concld.) |
(Rs. crore) |
Items |
2005-06 (Accounts) |
2006-07 (Accounts) |
2007-08 (Revised Estimates) |
2008-09 (Revised Estimates) |
2009-10 (Budget Estimates) |
1 |
8 |
9 |
10 |
11 |
12 |
I. |
Interest Payments on Internal Debt |
85,533 |
107,294 |
121,068 |
137,454 |
161,804 |
| |
of which : |
|
|
|
|
|
| |
i) On Market Loans* |
66,500 |
84,146 |
92,022 |
99,821 |
134,154 |
| |
ii) On Treasury Bills** |
3,990 |
5,740 |
8,202 |
11,245 |
11,200 |
| |
iii) On Marketable securities issued in conversion of special securities |
7,066 |
5,715 |
6,198 |
5,533 |
5,286 |
II. |
Interest on External debt |
3,173 |
3,867 |
3,890 |
4,159 |
4,313 |
III. |
Interest on Small Savings Deposits, Certificates and PPF @ |
18,029 |
18,055 |
17,219 |
17,311 |
17,269 |
IV. |
Interest on State Provident Funds |
4,950 |
5,044 |
5,591 |
6,057 |
6,654 |
V. |
Interest on Special Deposits of Non-Government Provident Funds etc. |
12,874 |
12,448 |
12,481 |
11,188 |
11,179 |
VI. |
Interest on Reserve Funds |
717 |
883 |
1,197 |
1,249 |
967 |
VII. |
Interest on Other Obligations |
1,345 |
2,451 |
5,754 |
8,867 |
14,996 |
VIII |
Others # |
3,411 |
230 |
4,771 |
6,409 |
8,329 |
Total Interest Payments (I to VIII) |
130,032 |
150,272 |
171,971 |
192,694 |
225,511 |
|
| |
|
Statement 8: Outstanding Liabilities of Central Government
|
|
(Rs. crore)
|
Year (End March) |
Internal Debt |
Of which: Market Loans |
Small Savings, Deposits & Provident Funds |
Other Accounts+ |
Reserve Fund and Deposits++ |
Total Domestic Liabilities (2+4+5+6) |
External Liabilities* |
Total Liabilities (7+8) |
1 |
2 |
3 |
4 |
5 |
6 |
7 |
8 |
9 |
1990-91 |
1,54,004 |
70,520 |
61,771 |
45,336 |
21,922 |
2,83,033 |
31,525 |
3,14,558 |
(27.0) |
(12.4) |
(10.8) |
(8.0) |
(3.8) |
(49.7) |
(5.5) |
(55.2) |
1991-92 |
1,72,750 |
78,023 |
69,682 |
51,818 |
23,464 |
3,17,714 |
36,948 |
3,54,662 |
(26.4) |
(11.9) |
(10.6) |
(7.9) |
(3.6) |
(48.5) |
(5.6) |
(54.2) |
1992-93 |
1,99,100 |
81,693 |
77,005 |
59,797 |
23,753 |
3,59,655 |
42,269 |
4,01,924 |
(26.5) |
(10.9) |
(10.2) |
(7.9) |
(3.2) |
(47.8) |
(5.6) |
(53.4) |
1993-94 |
2,45,712 |
1,10,611 |
87,877 |
72,477 |
24,556 |
4,30,623 |
47,345 |
4,77,968 |
(28.4) |
(12.8) |
(10.1) |
(8.4) |
(2.8) |
(49.7) |
(5.5) |
(55.2) |
1994-95 |
2,66,467 |
1,30,908 |
1,06,435 |
85,787 |
28,993 |
4,87,682 |
50,929 |
5,38,611 |
(26.2) |
(12.9) |
(10.5) |
(8.4) |
(2.9) |
(48.0) |
(5.0) |
(53.0) |
1995-96 |
3,07,869 |
1,63,986 |
1,21,425 |
92,010 |
33,680 |
5,54,983 |
51,249 |
6,06,232 |
(25.8) |
(13.8) |
(10.2) |
(7.7) |
(2.8) |
(46.6) |
(4.3) |
(50.9) |
1996-97 |
3,44,476 |
1,84,100 |
1,38,955 |
1,00,088 |
37,919 |
6,21,437 |
54,239 |
6,75,676 |
(25.0) |
(13.4) |
(10.1) |
(7.3) |
(2.8) |
(45.1) |
(3.9) |
(49.0) |
1997-98 |
3,88,998 |
2,16,598 |
1,67,780 |
1,24,087 |
42,097 |
7,22,962 |
55,332 |
7,78,294 |
(25.5) |
(14.2) |
(11.0) |
(8.1) |
(2.8) |
(47.3) |
(3.6) |
(51.0) |
1998-99 |
4,59,696 |
2,85,585 |
2,06,458 |
1,26,802 |
41,595 |
8,34,552 |
57,254 |
8,91,806 |
(26.3) |
(16.3) |
(11.8) |
(7.2) |
(2.4) |
(47.7) |
(3.3) |
(50.9) |
1999-2000 |
7,14,254 # |
3,55,862 |
66,406 # |
1,34,425 |
47,508 |
9,62,592 |
58,437 |
10,21,029 |
(36.6) |
(18.2) |
(3.4) |
(6.9) |
(2.4) |
(49.3) |
(3.0) |
(52.3) |
2000-01 |
8,03,698 |
4,28,793 |
96,344 |
1,44,020 |
58,535 |
11,02,597 |
65,945 |
11,68,542 |
(38.2) |
(20.4) |
(4.6) |
(6.9) |
(2.8) |
(52.4) |
(3.1) |
(55.6) |
2001-02 |
9,13,061 |
5,16,517 |
1,44,511 |
1,64,157 |
73,133 |
12,94,862 |
71,546 |
13,66,408 |
(40.1) |
(22.7) |
(6.3) |
(7.2) |
(3.2) |
(56.8) |
(3.1) |
(60.0) |
2002-03 |
10,20,689 |
6,19,105 |
2,26,400 |
1,72,374 |
80,126 |
14,99,589 |
59,612 |
15,59,201 |
(41.6) |
(25.2) |
(9.2) |
(7.0) |
(3.3) |
(61.1) |
(2.4) |
(63.5) |
2003-04 |
11,41,706 |
7,07,965 |
2,88,378 |
1,68,094 |
92,376 |
16,90,554 |
46,124 |
17,36,678 |
(41.4) |
(25.7) |
(10.5) |
(6.1) |
(3.4) |
(61.4) |
(1.7) |
(63.0) |
2004-05 |
12,75,971 & |
7,58,995 |
3,90,477 |
1,74,107 |
92,989 |
19,33,544 |
60,878 |
19,94,422 |
(40.5) |
(24.1) |
(12.4) |
(5.5) |
(3.0) |
(61.4) |
(1.9) |
(63.3) |
2005-06 |
13,89,758& |
8,62,370 |
4,79,761 |
1,86,921 |
1,09,462 |
21,65,902 |
94,243 |
22,60,145 |
(38.7) |
(24.0) |
(13.4) |
(5.2) |
(3.1) |
(60.4) |
(2.6) |
(63.0) |
2006-07 |
15,44,975& |
9,72,801 |
5,39,450 |
2,20,160 |
1,31,295 |
24,35,880 |
1,02,716 |
25,38,596 |
(37.4) |
(23.6) |
(13.1) |
(5.3) |
(3.2) |
(59.0) |
(2.5) |
(61.5) |
2007-08 |
18,08,359 & |
10,92,468 |
5,53,620 |
2,36,373 |
1,27,043 |
27,25,395 |
1,12,031 |
28,37,426 |
(38.3) |
(23.1) |
(11.7) |
(5.0) |
(2.7) |
(57.7) |
(2.4) |
(60.1) |
2008-09 RE |
20,14,451& |
13,58,940 |
5,56,723 |
3,20,508 |
1,22,759 |
30,14,441 |
1,21,634 |
31,36,075 |
(42.6) |
(25.0) |
(10.3) |
(5.9) |
(2.3) |
(55.6) |
(2.2) |
(57.8) |
2009-10 BE |
22,70,822 & |
16,77,587 |
5,50,967 |
3,18,700 |
1,28,452 |
32,68,941 |
1,37,681 |
34,06,622 |
(37.7) |
(27.9) |
(9.2) |
(5.3) |
(2.1) |
(54.3) |
(2.3) |
(56.6) |
RE : Revised Estimates. BE : Budget Estimates.
+ : Include mainly Postal Insurance and Life Annuity Fund, borrowings under Compulsory Deposits and Income-Tax Annuity Deposits, Special Deposits of non-Government Provident Funds.
++ : Include Depreciation Reserve Fund of Railways, Dept. of Posts and Dept. of Telecommunications, Deposits of Local Funds, Departmental and Judicial Deposits, Civil Deposits, etc.
* : At historical exchange-rate.
# : The sharp increase in internal debt and corresponding decline in small savings and provident funds in 1999-2000 is due to conversion of other liabilities(small savings, deposits and public provident funds) amounting to Rs.1,80,273 crore into Central Government securities. Since 1999-2000, Small Savings represent liabilities under National Small Savings fund(NSSF) excluding NSSF investment in the Central Government’s special securities.
& : Include amount raised under Market Stabilisation Scheme.
Note : Figures in parentheses are percentages to GDP.
Source : Budget Documents of the Government of India. |
|
| |
Statement 9: Key Fiscal Indicators |
(Rs. crore) |
Item |
2000-01 (Accounts) |
2001-02 (Accounts) |
2002-03 (Accounts) |
2003-04 (Accounts) |
2004-05 (Accounts) |
2005-06 (Accounts) |
1 |
2 |
3 |
4 |
5 |
6 |
7 |
1. |
Gross Fiscal Deficit |
1,18,816 |
1,40,955 |
1,45,072 |
1,23,273 |
1,25,794 |
1,46,435 |
| |
|
(5.7) |
(6.2) |
(5.9) |
(4.5) |
(4.0) |
(4.1) |
2. |
Revenue Deficit |
85,234 |
1,00,162 |
1,07,879 |
98,261 |
78,338 |
92,300 |
| |
|
(4.1) |
(4.4) |
(4.4) |
(3.6) |
(2.5) |
(2.6) |
3. |
Net RBI Credit to Centre |
6,705 |
-5,150 |
-28,399 |
-76,065 |
-60,177 |
28,417 |
| |
|
(0.3) |
-(0.2) |
-(1.2) |
-(2.8) |
-(1.9) |
(0.8) |
4. |
Gross Primary Deficit |
19,502 |
33,495 |
27,268 |
-815 |
-1,140 |
13,805 |
| |
|
(0.9) |
(1.5) |
(1.1) |
(0.0) |
(0.0) |
(0.4) |
5. |
Subsidies |
26,838 |
31,210 |
43,533 |
44,323 |
45,957 |
47,522 |
| |
of which : |
(1.3) |
(1.4) |
(1.8) |
(1.6) |
(1.5) |
(1.3) |
| |
i) Food |
12,060 |
17,499 |
24,176 |
25,181 |
25,798 |
23,077 |
| |
|
(0.6) |
(0.8) |
(1.0) |
(0.9) |
(0.8) |
(0.6) |
| |
ii) Fertiliser |
13,800 |
12,595 |
11,015 |
11,847 |
15,879 |
18,460 |
| |
|
(0.7) |
(0.6) |
(0.4) |
(0.4) |
(0.5) |
(0.5) |
| |
iii) Petroleum |
.. |
.. |
5,225 |
6,351 |
2,956 |
2,683 |
| |
|
|
|
(0.2) |
(0.2) |
(0.1) |
(0.1) |
6. |
Defence Expenditure |
49,622 |
54,266 |
55,662 |
60,066 |
75,856 |
80,549 |
| |
|
(2.4) |
(2.4) |
(2.3) |
(2.2) |
(2.4) |
(2.2) |
7. |
Interest Payments |
99,314 |
1,07,460 |
1,17,804 |
1,24,088 |
1,26,934 |
1,32,630 |
| |
|
(4.7) |
(4.7) |
(4.8) |
(4.5) |
(4.0) |
(3.7) |
8. |
Total Non-Plan Expenditure |
2,42,923 |
2,61,116 |
3,01,778 |
3,48,923 |
3,65,960 |
3,65,100 |
| |
|
(11.6) |
(11.5) |
(12.3) |
(12.7) |
(11.6) |
(10.2) |
9. |
Budgetary Support to Public Enterprises * |
10,493 |
13,488 |
15,232 |
15,982 |
17,005 |
17,362 |
| |
|
(0.5) |
(0.6) |
(0.6) |
(0.6) |
(0.5) |
(0.5) |
10. |
Interest Receipts |
32,811 |
35,538 |
37,622 |
38,538 |
32,387 |
22,032 |
| |
|
(1.6) |
(1.6) |
(1.5) |
(1.4) |
(1.0) |
(0.6) |
11. |
Interest Payments as per cent of revenue receipts |
51.6 |
53.4 |
51.0 |
47.0 |
41.5 |
38.2 |
12. |
Revenue Deficit as per cent of Gross Fiscal Deficit |
71.7 |
71.1 |
74.4 |
79.7 |
62.3 |
63.0 |
13. |
Net RBI Credit to Centre as per cent of Gross Fiscal Deficit |
5.6 |
-3.7 |
-19.6 |
-61.7 |
-47.8 |
19.4 |
.. : Not available / applicable.
* : Figures relate to revised estimates for years prior to 2008-09. Note : Figures in parentheses are percentages to GDP.
Source : Budget documents of the Government of India. |
|
| |
Statement 9: Key Fiscal Indicators (Concld.) |
(Rs. crore) |
Items |
2006-07 (Accounts) |
2007-08 (Accounts) |
2008-09 (Budget Estimates) |
2008-09 (Revised Estimates) |
2009-10 (Budget Estimates) |
1 |
8 |
9 |
10 |
11 |
12 |
1. |
Gross Fiscal Deficit |
1,42,573 |
1,26,912 |
1,33,287 |
3,26,515 |
3,32,835 |
| |
|
(3.5) |
(2.7) |
(2.5) |
(6.0) |
(5.5) |
2. |
Revenue Deficit |
80,222 |
52,569 |
55,184 |
2,41,273 |
2,38,534 |
| |
|
(1.9) |
(1.1) |
(1.0) |
(4.4) |
(4.0) |
3. |
Net RBI Credit to Centre |
-3,024 |
-1,16,772 |
.. |
.. |
.. |
| |
|
-(0.1) |
-(2.5) |
.. |
.. |
.. |
4. |
Gross Primary Deficit |
-7,699 |
-44,118 |
-57,520 |
1,33,821 |
1,07,324 |
| |
|
-(0.2) |
-(0.9) |
-(1.1) |
(2.5) |
(1.8) |
5. |
Subsidies |
57,125 |
70,926 |
71,431 |
1,29,243 |
1,00,932 |
| |
of which : |
(1.4) |
(1.5) |
(1.3) |
(2.4) |
(1.7) |
| |
i) Food |
24,014 |
31,328 |
32,667 |
43,627 |
42,490 |
| |
|
(0.6) |
(0.7) |
(0.6) |
(0.8) |
(0.7) |
| |
ii) Fertiliser |
26,222 |
32,490 |
30,986 |
75,849 |
49,980 |
| |
|
(0.6) |
(0.7) |
(0.6) |
(1.4) |
(0.8) |
| |
iii) Petroleum |
2,699 |
2,820 |
2,884 |
2,877 |
3,109 |
| |
|
(0.1) |
(0.1) |
(0.1) |
(0.1) |
(0.1) |
6. |
Defence Expenditure |
85,510 |
91,681 |
1,05,600 |
1,14,600 |
1,41,703 |
| |
|
(2.1) |
(1.9) |
(1.9) |
(2.1) |
(2.4) |
7. |
Interest Payments |
1,50,272 |
1,71,030 |
1,90,807 |
1,92,694 |
2,25,511 |
| |
|
(3.6) |
(3.6) |
(3.5) |
(3.6) |
(3.7) |
8. |
Total Non-Plan Expenditure |
4,13,527 |
5,07,650 |
5,07,498 |
6,17,996 |
6,68,082 |
| |
|
(10.0) |
(10.7) |
(9.4) |
(11.4) |
(11.1) |
9. |
Budgetary Support to Public Enterprises * |
20,635 |
19,636 |
19,440 |
23,553 |
22,181 |
| |
|
(0.5) |
(0.4) |
(0.4) |
(0.4) |
(0.4) |
10. |
Interest Receipts |
22,524 |
21,060 |
19,135 |
19,036 |
19,000 |
| |
|
(0.5) |
(0.4) |
(0.4) |
(0.4) |
(0.3) |
11. |
Interest Payments as per cent of revenue receipts |
34.6 |
31.6 |
31.6 |
34.3 |
37.0 |
12. |
Revenue Deficit as per cent of Gross Fiscal Deficit |
56.3 |
41.4 |
41.4 |
73.9 |
71.7 |
13. |
Net RBI Credit to Centre as per cent of Gross Fiscal Deficit |
-2.1 |
-92.0 |
.. |
.. |
.. |
|