
VII. Macroeconomic Outlook - आरबीआय - Reserve Bank of India


VII. Macroeconomic Outlook
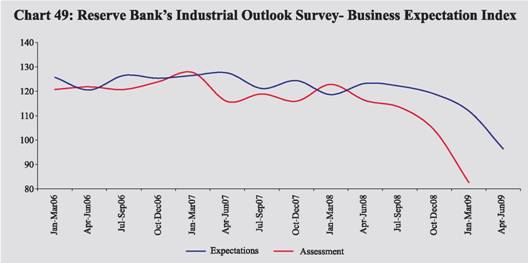
An assessment of the economic conditions at the current juncture indicates that the global economic conditions deteriorated sharply during 2008 and the forecasts of the various international agencies point to deepening of recessionary conditions during 2009. Reflecting global developments and their impact on the Indian economy, as well as domestic cyclical factors, the various surveys of economic activity point towards prevalence of less than optimistic sentiment for the outlook of the Indian economy in the coming months. VII.1 Macroeconomic outlook of the Indian economy, based on various business expectations surveys, continues to exhibit the persistence of less than normal sentiments. The professional forecasters’ survey conducted by the Reserve Bank in December 2008 suggested further moderation in economic activity in 2008-09. As reported by the respondents, the downside risks to growth seem to have amplified due to projected global economic recession, deterioration in global financial markets and slowdown in domestic demand. The knock-on impact of global downturn is visible as the main drivers of the growth process in the Indian economy have moderated during the third quarter of 2008-09. Business Expectations Surveys VII.2 Business Confidence Index (BCI) of the National Council of Applied Economic Research (NCAER) quarterly business expectations survey (67th round) declined sharply from 119.9 in October 2008 to 91.4 in January 2009. Thus, the BCI lost 28.5 points (23.8 per cent) in January 2009 over its October 2008 level. According to the quarterly business expectations survey of the Confederation of Indian Industry (CII), the business confidence index (CII-BCI) for October 2008-March 2009 has also declined both over the preceding six months as well as over the corresponding period of the previous year (Table 70). The decline reflected uncertainties about global economic outlook and concerns about high cost of funds. The Dun and Bradstreet Business Optimism Index for the second quarter of 2009 declined marginally to 93.8, the lowest since its introduction in the fourth quarter of 2002. This followed a sharp decline by 31 per cent during the first quarter of 2009. The index also reported a decline of 39.0 per cent over the corresponding quarter of last year. Except for inventory levels, all the other indices (volume of sales, net profits, new orders, selling prices and employee levels) registered a decline in the second quarter of 2009 over the previous quarter. VII.3 According to the Reserve Bank’s Industrial Outlook Survey of manufacturing companies in the private sector, the business expectations indices based on the assessment for January-March 2009 and expectations for April-June 2009 declined sharply by 20.7 per cent and 13.9 per cent, respectively, over the previous quarters. Similar trend was observed in these indices when compared with the corresponding quarters of the previous year (Chart 49).
VII.4 The optimism for the quarters January-March 2009 and April-June 2009 on major business sentiment indicators such as overall business situation, overall financial situation, production, order books, capacity utilisation, employment, exports, imports and profit margin significantly declined as compared to a year ago. The raw material cost eased substantially during January-March 2009 and significantly higher net proportion of respondents viewed that there would be a ‘decline’ in selling prices from the respective levels in the previous quarter (Table 71). The industry-wise breakup showed that while the net sentiments on ‘overall business situation’ for the sample companies were negative for the quarter January-March 2009. The industry groups, viz., food products, pharmaceuticals and cement show positive sentiment with more companies expecting growth than those expecting contraction. For April-June 2009, the overall net sentiment for all industries except textiles is positive. The size-wise breakup shows that the contraction in the quarter January-March 2009 in ‘overall business situation’ is across the board. Moderate growth is expected across the various companies for the quarter April-June 2009. The expectations are less optimistic for smaller companies as compared to their bigger counterparts. VII.5 The ABN-AMRO Purchasing Managers’ Index (PMI) for March 2009 was at 49.5, just below the neutral 50.0 mark, pointing to a weakening in the health of the Indian manufacturing industry, although the index indicated fractional improvement for the third straight month. Despite some gain in output index since January 2009, manufacturers continued to report decline in new orders from domestic and foreign clients due to global financial and economic conditions. The New Orders Index, a leading indicator of the activity for the next month at 49.5, is marginally lower than the neutral mark but improved significantly from a low of 45.9 in February 2009. Export orders further declined to 43.6 during the same month. Such a decline signals the possibility of further weakening of activity in the manufacturing sector. Low production and stock depletion strategies have led to declines in both pre and post-production stocks. These trends have mainly reflected in the deteriorating outlook for the manufacturing sector. Survey of Professional Forecasters1 VII.6 The results of professional forecasters survey conducted by the Reserve Bank in March 2009 suggested moderation in economic activity for 2008-09 on the whole (Table 72). Between the sixth round of survey conducted in December 2008 and seventh round survey in March 2009, median forecast of real GDP growth for 2008-09 was revised downwards to 6.6 per cent from 6.8 per cent. The sectoral growth rate forecast for the agriculture sector was revised downwards from 3 per cent to 1.6 per cent and for industry, from 4.9 per cent to 4.1 per cent. However, the sectoral growth rate forecast for services was revised upwards from 9.0 per cent in the last survey to 9.3 per cent in the current survey. According to this survey the median forecast of real GDP growth for 2009-10 has also been revised downwards to 5.7 per cent from 6.0 per cent. 1 Introduced by the Reserve Bank from the quarter ended September 2007. The forecasts made in the section are that of professional forecasters and not that of the Reserve Bank. VII.7 Forecasts by select agencies for real GDP growth in 2009-10 are set out in Table 73. |
||||||||||||||||||||||||||||||||

हे पेज शेअर करा:


भारतीय रिझर्व्ह बँक मोबाईल ॲप्लिकेशन इंस्टॉल करा आणि नवीनतम बातम्यांचा त्वरित ॲक्सेस मिळवा!


