 IST,
IST,


RBI WPS (DEPR): 04/2023: Impact of Foreign Direct Investment on Profitability: Evidence from the Indian Corporate Sector
| RBI Working Paper Series No. 04 Impact of Foreign Direct Investment on Profitability: Evidence from the Indian Corporate Sector Haridwar Yadav, Vishal Shinde and Samir Kumar Das@ Abstract *The paper empirically assesses the impact of foreign direct investment (FDI) on the capital structure and profitability of Indian companies. Using a multivariate GMM panel regression model and a novel panel data set constructed by taking data from RBI releases on FDI companies along with data on company financials from the Prowess database from 2013-14 to 2018-19, the paper finds that an increase in the share of FDI in equity raises profitability of the FDI-receiving companies. The FDI also influences the capital structure of the company by bringing down leverage. The age and size of a company may also determine profitability, i.e., older and smaller companies are likely to be less profitable. JEL Classification: F2, F6, G3, O2 Key Words: Foreign Direct Investment (FDI), capital structure, profitability, Ordinary Least Square (OLS) method, Arellano-Bond model Introduction Foreign direct investment (FDI) plays an important role in enhancing the performance of the corporate sector, as it involves not just providing stable funding, but also technology, knowledge, skills, and know-how that make domestic firms more efficient and cost-effective. The foreign direct investor establishes a ‘lasting interest’ in the enterprise, influencing its management. According to the International Monetary Fund (IMF), lasting interest refers to owning at least 10 per cent of the voting rights of an enterprise1. Hence, under FDI, the investor has a say in the day-to-day activities of the company. Typically, inflows of FDI are higher for an economy having good prospects of growth and a skilled workforce. The Indian private corporate sector contributes around 50 per cent of the economy’s total gross capital formation2. The contribution of this sector has expanded sizeably since the liberalisation of the Indian economy (from 16.1 per cent in 1990-913) and has been attracting both domestic and foreign investors over the years. India has liberalised, privatised and globalised its economy through delicensing of many industries, trade liberalisation, reforms in the banking sector, capital market liberalisation and fiscal restructuring (Murali, 1999). The 1990s witnessed an overhaul in industrial financing in India, with industries achieving increased access to domestic and foreign funding. The overseas investment policy in the pre-liberalisation period was of restrictive nature (Rakhi, 2000). With the announcement of the New Industrial Policy, 1991 by the Government of India, overseas investment policy gradually eased. Under the automatic route, FDI up to 51 per cent was allowed in 34 priority sectors. The Foreign Exchange Regulation Act (FERA), 1973 was replaced with Foreign Exchange Management Act (FEMA), 1999 to facilitate foreign trade, payments, and the foreign exchange market. During 2000-05, defence production, insurance and print media sectors were opened to FDI up to 26 per cent. In single brand retail, FDI up to 51 per cent was allowed in 2006. The FDI limit in the insurance sector was increased further from 26 per cent to 49 per cent in 2014. The policy regarding FDI was further liberalised in 2019 to allow 100 per cent FDI in many sectors and up to 26 per cent FDI was allowed in digital media. Sources of overseas funds such as external commercial borrowings (ECBs), including the issuance of foreign currency convertible bonds (FCCBs), rupee-denominated bonds (RDBs), etc., increased since liberalisation. Foreign direct investment (FDI) inflows increased from less than US$ 1 billion in 1990-91 to US$55 billion in 2020-214. The recent data released by the Reserve Bank of India (RBI) on the finances of FDI companies reveal that sales of the select FDI-receiving companies expanded by a meagre rate of 0.2 per cent in 2020-21 as compared with the growth of 1.3 per cent in the previous year. However, the operating profits improved due to a steeper contraction in expenditure vis-à-vis sales. Total borrowings of these companies accelerated in 2020-21 resulting in higher leverage. Nearly 56 per cent of funds were utilised for fixed investment by these companies as compared to 73 per cent in the previous year. The financial strategies on the capital structure adopted by the companies reflect a lot about their financing pattern and are considered important in corporate finance due to their influence on return and risk for the shareholders. The selection of the right financial strategy may ease the burden on the firm in terms of the high cost of capital, which may increase the net present value of the proposal and make it profitable. For the long-term survival of the firms, an effective financing decision with an objective of sustainable profitability is vital. In view of the special nature of FDI companies, this paper examines the impact of FDI on the capital structure and profitability of FDI companies. The paper is organised as follows. Section II contains a review of relevant literature. Section III discusses the data and methodology used in the paper. Section IV brings out the stylised facts about FDI companies. Section V contains the empirical analysis and Section VI concludes. Modigliani and Miller (1958) highlighted the first irrelevance of capital structure. Since then, several contributions have been made regarding different aspects of capital structure. Donaldson (1961) in his paper “Pecking order theory” indicated that a firm should first opt for internal funds before external sources. Myers (1984) in his work “Modified Pecking Order Theory” emphasised that companies prioritise their sources of financing and prefer internal financing. If the external financing is needed, the debt will be chosen, and equity will be the last resort. Baner (2004) found that leverage has a negative relationship with profitability. Chakraborty (2010) showed that profitability is negatively related to debt ratio. Ambadkar (2019) found that debt ratios are negatively associated with profitability. With regard to the relationship between Foreign Direct Investment and profitability for software companies in Ireland, Buckley (2001) found that foreign direct investment has a positive impact on profits. Rutkowski (2008) observed that FDI increases profitability, strengthens domestic enterprises, and reduces concentration in those countries. Sakikabara et al. (2008) found the effect of the size of FDI on profitability for companies in all regions of Japan. Abor (2010) found that higher FDI leads to higher productivity. Bhatnagar (2013) found that FDI contributed to maximisation of profits after tax and the earning per share in the telecom sector in India. Musah (2018) based on his work in Ghana found that FDI had a positive impact on the profitability of companies. Mahapatra et al. (2019) revealed a significant impact of FDI on the productivity and profitability of the banking sector. It is evident that the literature on this subject has been limited in the Indian context, and has been largely sector-specific. This paper adds to this literature by assessing the impact of FDI on the profitability of the Indian corporate sector using the RBI and Prowess data on FDI companies. We use the data released on FDI companies by the RBI and supplement these data with a panel of common companies from 2013-14 to 2018-19 drawn from the Prowess database maintained by the Centre for Monitoring of the Indian Economy (CMIE). The sample selection is largely driven by data availability. After removing outliers, a total of 2,275 FDI companies are considered for analysis. We cover the FDI-receiving companies broadly across all manufacturing and services sectors. Our sample forms about 25-30 per cent of the RBI data, making it fairly representative. Based on theoretical underpinnings and the available literature on the topic, we test the panel regression model on the following lines. We first evaluate the relationship between FDI and the capital structure of companies. By using the ordinary least squares (OLS) method, we estimate the impact of the share of FDI in equity on the capital structure of the companies with the following specification: 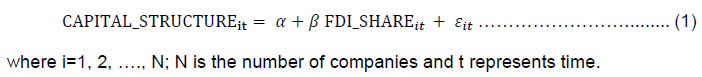 Capital structure is captured by debt to equity ratio, long-term debt to total net assets ratio and short-term debt to total net assets ratio and total outside liabilities to total net assets. These measures of capital structure are standard in nature and have been used in the literature. Debt-to-equity ratio is defined as the ratio of long-term debt to total net worth of a company. A high level of debt in comparison to equity is riskier as the company may have to sell its assets to meet its debt obligations. Long-term debt to total assets portrays the financial condition of a company and the company’s ability to repay its debt. A low ratio reflects the good financials of the company. Similarly, short-term debt to total assets reflects the percentage of a company's assets that have to be liquidated to repay its short-term debt. The total outside liabilities to total income ratio measures the total leverage employed by the company to its total net worth. Excessive leverage may be detrimental to the company as it may hamper the ability of the company to repay its obligations during periods of stress. Given our major interest in understanding the impact of FDI on profitability, we analyse this relation in both OLS and dynamic panel specifications. The two specifications can be illustrated as follows:  Under the dynamic panel specification as given in model (3), ΔYit is the dependent variable measured as the change in profitability in terms of return on equity (ROE) and return on assets (ROA), where N reflects the number of companies and t represents time. The dynamic panel specification is used to address the issue of endogeneity. Endogeneity can arise due to simultaneity, omitted variables, measurement error, or autoregression with autocorrelated errors. In principle, the share of FDI in the equity of the company has an impact on its profitability. In turn, profitability may also impact the share of FDI in equity. The endogeneity problems can be mitigated by using the dynamic panel generalised method of moments (GMM) to find consistent estimates of parameters of the equation in profitability ratios and share of FDI in equity of the companies. More specifically, we use the GMM method for the dynamic panel regression. Under the GMM method, the data is first differenced before estimation to eliminate the fixed effects. Blundell and Bond (1998) established that the system GMM by adding additional moment conditions/restrictions allows lagged first differences as instruments in the levels equations and this modifies any bias using the standard GMM estimator. The introduction of certain lags of the dependent variable limits the problem of omitted variables and helps in obtaining white noise residuals. In model (3), the impact of a change in the FDI share in equity (FDI_SHARE) on profitability is evaluated by Σβj, the main coefficients of interest. The share of FDI in equity helps in evaluating the role of FDI in each company by comparing the level of FDI portion of the equity with non-FDI portion of equity. ΔXit-j are changes in company-specific characteristics. We have used four characteristics of the companies, denoted by the vector X, as control variables, which include (i) Size (log of total assets); (ii) Liquidity Ratio (current assets/current liabilities); (iii) Tangibility (net fixed assets to total assets); and (iv) Age of the company. The selection of these dependent variables is guided by the literature on this subject. To illustrate, Nanda and Panda (2018) and Vătavua (2015) used liquidity measured by current assets divided by current liabilities. Abor (2005), Chadha and Sharma (2015), Dawar (2014), Gill et al. (2011), Majumdar and Sen (2010), Singh and Bansal (2016) and Yazdanfar and Öhman (2014) included firm size as the control variable. They employed either sales or assets as a proxy of the firm size. We use the natural logarithm of total net assets as a measure of size. Chadha and Sharma (2015), Dawar (2014), Vătavua (2015) and Singh and Bansal (2016) used tangibility as a control variable in their studies. In this paper, tangibility is measured as net fixed assets to total net assets. Majumdar and Sen (2010), Dawar (2014) and Yazdanfar and Öhman (2014) employed the age of a company as the control variable. The age of a company up to the year 2018-19 is calculated from the year of incorporation and age in years so calculated is used as a proxy for age in this paper. IV. Stylised Facts about FDI Companies Data on the capital structure of FDI and non-FDI receiving companies in the Indian private corporate sector exhibit very interesting facts during the period 2013-14 to 2018-19. Chart 1 shows a broadly increasing trend in debt-to-equity ratio of non-FDI companies and a decreasing trend for that of FDI-receiving companies. As FDI companies have a cushion of investible funds in the form of equity investment by foreign investors, they typically decide their financial strategies by considering financing conditions in the economy. If debt funding is comparatively cheaper than equity investment, they may prefer debt financing or vice-versa. The lowering of the debt-to-equity ratio of FDI companies may be broadly explained by the trend of increasing FDI in India. 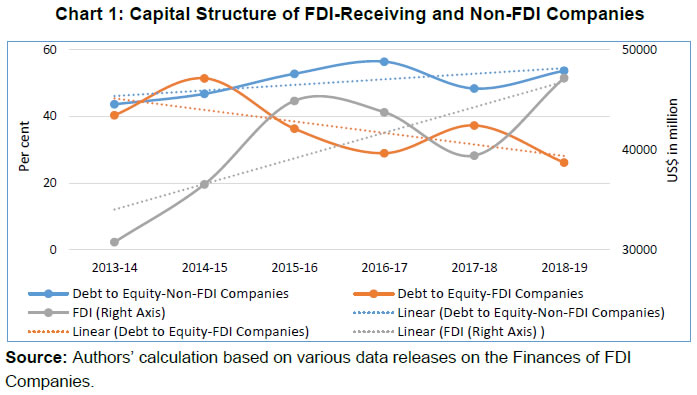 Sector-wise composition of companies presented in Chart 2 reveals that a majority of the companies belong to the services and manufacturing sector. Destination-wise, more than 80 per cent of companies have received FDI from ten countries, viz., the US, Mauritius, Singapore, Japan, UK, Germany, Netherlands, Switzerland, and United Arab Emirates. 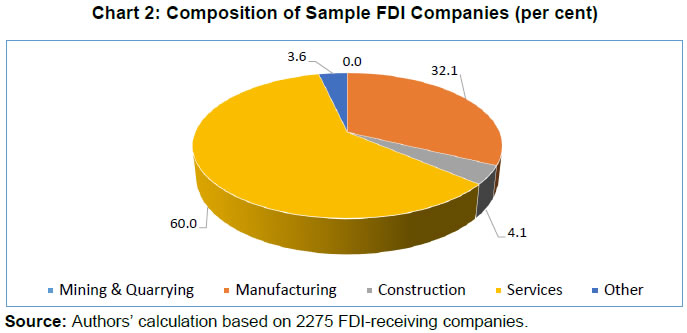 Borrowing is one of the important sources of financing business activities of these companies. However, the contribution of borrowings in asset financing has decreased over the years; the share of borrowings to total assets decreased from 22.9 per cent in 2013-14 to 14.3 per cent in 2018-19 (Chart 3). Importantly, long-term borrowings are mostly preferred by these companies in financing their business activities. At the aggregate level, the share of long-term borrowings in total borrowings of these companies amplified from 64 per cent in 2013-14 to 70.6 per cent in 2018-19. 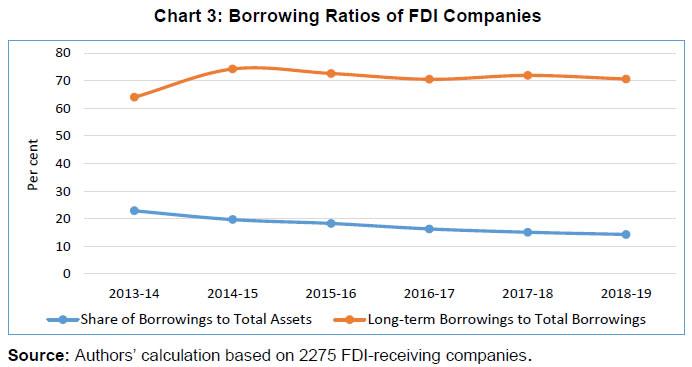 All the measures of capital structure of FDI receiving companies, such as, debt-to-equity ratio, long-term debt to total net assets ratio, short-term debt to total net assets ratio and total outside liabilities to total net asset ratio have shown a decreasing trend during the study period. The trend indicates a lesser dependency on debt financing by FDI receiving companies to run their businesses over the period of the study (Chart 4). Profitability ratios of FDI receiving companies, viz., return on assets (ROA) and return on equity (ROE) improved in 2014-15 before stabilising during the last three years (Chart 5). Both the return on assets and return on income remained range bound between 7.0 per cent and 7.5 per cent during the last three years whereas the return on equity hovered between 14.5 per cent and 14.8 per cent. 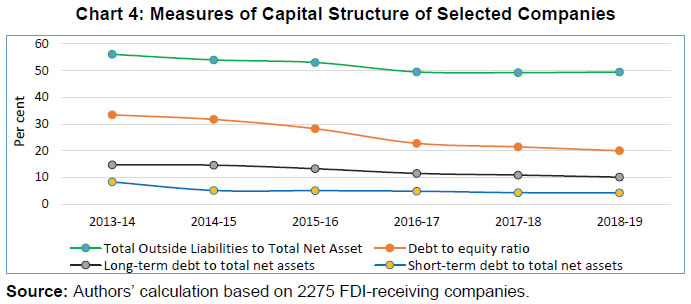 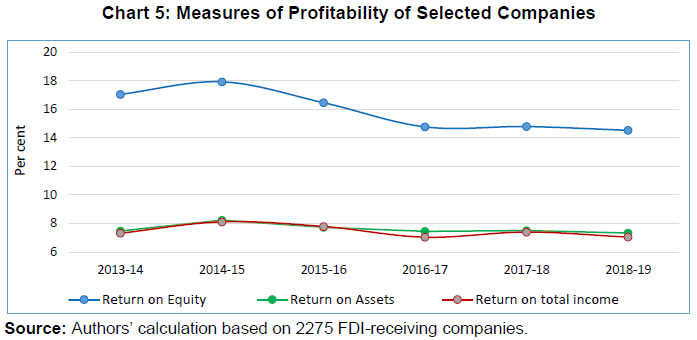 V.1 Impact of the Share of FDI in Equity on Capital Structure One of the objectives of the paper is to analyse the impact of FDI on the capital structure of FDI-receiving companies. Panel Granger Causality tests show uni-directional causality from the share of FDI in equity to the three measures of capital structure, viz., debt to equity ratio (DETR), long-term debt to total net assets ratio (LTD_TNA) and short-term debt to total net assets ratio (STD_TNA). A summary of statistics in respect of the variables used for econometric analysis is presented in Appendix Table A1. Before estimating the relationship between these variables using the OLS specification, the stationarity of all these variables has been tested. The tests based on four types of panel unit root tests i.e., Levin, Lin & Chu Test, Im, Pesaran and Shin Test, ADF–Fisher Test and PP-Fisher Test show that all the variables are stationary in levels (Appendix Table A2). Using specification (1), the impact of the share of FDI in equity on various measures of capital structure is estimated (Table 1). The regression results show a negative and statistically significant effect of the share of FDI in equity on both debt-to-equity ratio, long-term debt to total assets ratio and short-term debt to total assets ratio (Table 1). In other words, higher the FDI in equity, lower is the leverage of such FDI-receiving companies, corroborating the findings in the literature. V.2 Impact of the Share of FDI in Equity on Profitability The relation between FDI in equity and profitability forms the core of our analysis. Before embarking on the regression, we estimate the Granger causality between these two series. The panel Granger causality tests show that there is a bi-directional relationship from “share of FDI in equity” (FDI_SHARE) to both the profitability ratios, viz., “return on assets” (ROA) as well as “return on equity” (ROE). Furthermore, the stationarity of all the variables, such as, return on assets (ROA), return on equity (ROE) and share of FDI in equity (FDI_SHARE) has also been tested. Four types of panel unit root tests i.e., Levin, Lin & Chu Test, Im, Pesaran and Shin Test, ADF – Fisher Test and PP – Fisher Test show that all series are stationary (Appendix Table A3). Using specifications as given in equation 2 earlier, the impact of the share of FDI in equity on various measures of profitability has been estimated (Table 2). The regression shows that an increase in the share of FDI in equity increases both returns on assets and return on equity, again corroborating the literature on this subject. To address the endogeneity concern, a dynamic panel regression is estimated using the GMM specification to obtain more consistent and robust estimates (Table 3). The results corroborate our findings as under the OLS specification. They show that the share of FDI in equity is positively associated with both profitability ratios, viz., return on assets and return on equity. The other controls in the specification also bring forth certain interesting findings. First, the age of a company is negatively associated with its profitability, suggesting that older companies are likely to have lower profitability. This is because FDI in younger companies provides the much-needed stable funding, and technological knowhow which can make their operations more cost-effective, and thereby enhances profitability. The size of the company is positively associated with profitability, suggesting that larger FDI-receiving companies are likely to have higher profitability; this finding is in line with the existing literature. This is because in larger companies, the management is often more focused on preserving/improving its reputation, which helps in attracting greater FDI. Larger companies are better placed to take advantage of the increased FDI funding owing to the economies of scale and the cost-effective nature of their operations. And hence, FDI plays a greater role in enhancing the profitability of larger companies as compared to smaller companies. The tangibility of the company is negatively associated with both the return on assets and return on equity, possibly owing to higher depreciation and debt servicing pressures that may be associated with higher tangibility. As expected, the liquidity ratio is positively associated with profitability ratios. The second-order serial correlation and Sargan tests have been used to check the overall fit of the GMM specification. Both tests indicate that our model fits the data. The share of FDI in equity is found to be negatively associated with the capital structure, which is captured by debt-to-equity ratio, long-term debt to total assets and short-term debt to total assets ratio. In other words, an increase in FDI results in a decrease in the leverage of the company. More importantly, the paper finds that FDI plays an important part in the profitability of the firms; it impacts the profitability of FDI-receiving companies positively. In the paper, this relation was corroborated both by the OLS and GMM specifications. Apart from the FDI share in equity, the size of the company and liquidity ratios also positively impact profitability, but the age of the company has a negative impact on the same. The findings of this paper are largely consistent with the literature on this subject. The paper makes a useful contribution to the relatively limited literature on the overall association of FDI and profitability in the Indian context. @ Haridwar Yadav (hyadav@rbi.org.in), Vishal Shinde and Samir Kumar Das are from the Department of Statistics and Information Management, Reserve Bank of India. * The views expressed in the paper are those of the authors and do not represent the views of the institution they affiliated with. Authors are grateful to Ajit R. Joshi, Ravi Shankar and Supriya Majumdar for their guidance and support. We are also grateful to Pallavi Chavan, Priyanka Upreti, and Akanksha Handa, DRG, DEPR. Authors gratefully acknowledge the participants of the DEPR Study Circle seminar and an anonymous referee for their comments for improving the content of the paper. 1 As per Balance of Payments and International Investment Position Compilation Guide 6 (BPM 6), Appendix 4: Foreign Direct Investment pp-372 (https://www.imf.org/external/pubs/ft/bop/2007/bop6comp.htm) 2 https://pib.gov.in/PressReleasePage.aspx?PRID=1693302#:~:text=16., per cent in 2019-20 3 Authors’ calculation based on National Account Data. 4 RBI’s Bulletin for May 2021 dated 17th May 2021 (Table No. 34 – Foreign Investment Inflows). References Abor, J. (2010). Foreign direct investment and firm productivity: Evidence from firm- level data. Global Business and Economics Review, 12 (4), 267 – 285. Ambadkar, R.S. (2019). Capital Structure and Profitability of Foreign Direct Investment Companies in the India Manufacturing Sector. International Journal of Scientific & Technology Research Volume 8, Issue 07, July 2019. Banner, P. (2004). Capital Structure of Listed Companies in Visegrad Countries. Research Seminar paper presented at Seminar for Comparative Economics, LMU, Munich. Bhatnagar, V. K. (2013). Impact of foreign direct investment on the profitability: A case study of Telecom companies in India. Published in edited book, foreign direct investment in Inidan retail sector, Indus Valley Publications, Jaipur. Blundell, R. W., & Bond, S. R. (1998). Initial Conditions and Moment Restrictions in Dynamic Panel Data Models. Journal of Econometrics, 87, 115-143. Buckley, Rita. (2001). The impact of Foreign Direct Investment on the Profitability of the Software Sector in Ireland. Global Economic Analysis Conference, Purdue University, June 27-29, 2001. Bhattarai, K. and Negi, V. (2020). Foreign Direct Investment and Economic Performance of Firms in India. Studies in Microeconomics, Sage Publications. Chakraborty, I. (2010). Capital Structure in an emerging Stock Market: The case of India. International Business and Finance. 24(3), pp. 295-314. Chadha, S. & Sharma, A.K. (2015). Capital Structure and Firm Performance: Empirical Evidence from India. Vision, 19(4), pp. 295-302. Dawar, V., 2014. Agency theory, capital structure and firm performance: some Indian evidence. Managerial Finance, 40(12), pp. 1190-1206. Donaldson, G. (1961). Corporate debt capacity: A study of corporate debt policy and the determination of corporate debt capacity. Boston: Division of Research, Harvard School of Business Administration. Gill, A., Biger, N. & Mathur, N., 2011. The Effect of Capital Structure on Profitability: Evidence from the United States. International Journal of Management, December, 28(4), pp. 3-15. Mahapatra, P., Dhal, S., Mishra, N., (2021). Interdependence between International Investment and Profitability of Indian Private Sector Banks: A Pragmatic Review. Turkish Journal of Computer and Mathematics Education Vol.12 No.10 (2021), pp. 1721-1729. Majumdar, S. & Sen, K., 2010. Corporate Borrowing and Profitability in India. Managerial and Decision Economics, Volume 31, pp. 33-45. Modigliani F. and Miller M.H. (1958). The Cost of Capital, Corporation Finance and the Theory of Investment. American Economic Review, Vol.48, June, pp. 261-297. Murali, K. (1999). Disintermediation and Private Corporate Financing: An Analysis of of the New Issue (Primary) Market in India. Thesis submitted to the Jawahar Lal Nehru University in fulfilment of the requirement for award of the degree of Doctor of Philosophy Musah, A., Gakpetor, E. D., Nana, S., Kyei, K Musah, A., Gakpetor, E. D., Nana, S., Kyei, K., & Akomeah, E. (2018). Foreign Direct Investment (FDI), Economic Growth and Bank Performance in Ghana. International Journal of Finance and Accounting, 7(4): pp. 97-107. Myers, S.C. (1984). Modified Pecking Order Theory. The Journal of Finance, 39(3), pp. 575-592. Nanda, S. & Panda, A.K. (2018). The Determinants of Corporate Profitability: An Investigation of Indian Manufacturing Firms. International Journal of Emerging Markets, vol. 13, no. 1, pp. 66-86. Novotny, F. (2015). Profitability Life Cycle of Foreign Direct Investment and its Application to the Czech Republic. Czech National Bank Working Paper Series, January 2015. Rakhi (2020). Foreign Direct Investment in India. International Journal of Creative Thought, Vol. (8), Issue (8), August RBI’s Bulletin for March 2020 dt.14.05.2020 (Table No. 34 – Foreign Investment Inflow). /en/web/rbi/-/press-releases/finances-of-foreign-direct-investment-companies-2018-19-data-release-49918 Roden, D.M. & Lewellen, W.G. (1995). Corporate capital structure decisions: Evidence from leveraged buyouts. Financial Management, pp. 76-87. Rutkowski, Aleksander (2006). Inward FDI, concentration, and profitability in the CEECs: Were the domestic firms crowded out or strengthened? Transnational Corporations, Vol. 15, No. 3 (December 2006). Sakikabara, M., Yamawaki, H. (2008). What Determines the profitability of Foreign Direct Investment Companies? A Subsidiary Level Analysis of Japanese Multinationals. Managerial and decision Economics, Vol 22, Issue 2-3, march-April 2008. Singh, A. K. & Bansal, P. (2016). Impact of Financial Leverage on Firm's Performance and Valuation: A Panel Data Analysis. Indian Journal of Accounting (IJA), XLVIII (2), pp. 73-80. Taub, A.J. (1975). Taub, A.J. (1975). Determinants of the Firm’s Capital Structure. Review of Economics and Statistics, Vol. 57, pp. 410-416. Titman, S. and Wessels, R. (1988). The Determinants of Capital Structure Choice. Journal of Finance, Vol. 43, No. 1, pp. 1-19. Vătavua, S. (2015). The impact of capital structure on financial performance in Romanian listed companies. Procedia Economics and Finance, Emerging Markets Queries in Finance and Business, Volume 32, pp. 1314 – 1322. Yazdanfar, D. & Öhman, P. (2014). Debt financing and firm performance: an empirical study based on Swedish data. The Journal of Risk Finance, 16(1), pp. 102-118. Appendix |

हे पेज शेअर करा:


भारतीय रिझर्व्ह बँक मोबाईल ॲप्लिकेशन इंस्टॉल करा आणि नवीनतम बातम्यांचा त्वरित ॲक्सेस मिळवा!
आमचे अॅप इंस्टॉल करण्यासाठी QR कोड स्कॅन करा


पेज अंतिम अपडेट तारीख:


