 IST,
IST,
RBI WPS (DEPR): 11/2011: Effects of Recent Financial Crisis on Optimal Asset Allocation of Foreign Exchange Reserves
| RBI Working Paper Series No. 11 *Post financial crisis, yield in the developed sovereign markets is prevailing at very low level and consequently return generated by deployment of foreign exchange reserves have been very low together with increased risk of getting negative return more frequently.In this paper, we discuss some strategies for the central banks to create optimum portfolio depending on their level of reserve under the present low yield scenario.The optimal asset allocation during post-crisis period suggests a concentrated portfolio as against the barbell structure for pre-crisis period.We observe that central banks can get higher pick-up in return in the post-crisis scenario than in the pre-crisis scenario for the same amount of increase in duration.However, in the post-crisis period the probability of negative return will increase substantially.We have also tried to find out an alternative strategy to increase the portfolio yield and reduce the probability of negative return under this low yield scenario.We conclude that central banks with medium/ long target duration can get substantial yield and return pick-up and also reduce the probability of negative return by including the emerging Asia within the investment universe even without extending the duration. JEL Classification: C61, G01, G11, G12 Keywords: Financial Crisis, Foreign Exchange Reserve, Liquidity Tranche, Buffer Tranche, Investment Tranche, Risk, Return, Optimum Portfolio, Duration, Convexity. Section I: Introduction Central banks hold foreign exchange reserves for various reasons. As mentioned by Borio, et al (2008), some important reasons are as below:
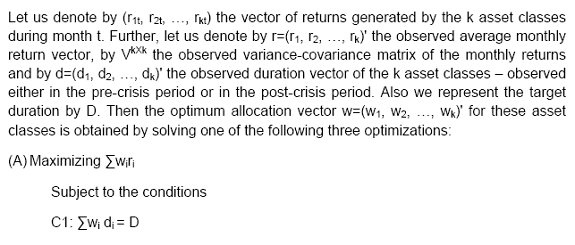
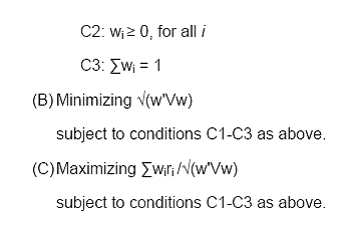
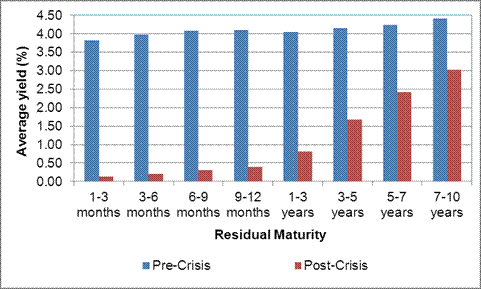
The emphasis on any particular reason, though they might be interrelated, varies from country to country depending on the economic situation faced by the country from time to time.Foreign exchange reserve also serves as a store of national wealth. Therefore, the reserves are invested in foreign securities in such a way that, whenever necessary, the reserves can be made available for above identified reasons, and also to generate reasonable return.The issue of generating reasonable return has assumed added importance due to the fact that many central banks have accumulated reserves particularly after the last Asian crisis.Thus, central banks have to dynamically adjust their foreign exchange reserves allocation depending upon the present internal and external economic situations. To map those identified reasons for holding foreign exchange reserves under the framework of strategic asset allocation exercise1, the central banks generally follow the objectives of ‘safety (capital preservation), liquidity and return’ (Borio, et al, 2008) and try to find out the optimal trade-off among these three objectives, depending on the relative emphasis on these three policy objectives. Deviating from the market portfolio recommended by the modern portfolio theory, central banks typically restrict the eligible investment universe to highly liquid government bonds (highly rated) and instruments issued by international institutions, government sponsored institutions and supranationals2 (Cardon & Coche, 2004; italics is addition of the authors) and then through optimization exercise based on risk3 -return trade-off, central banks typically try to derive the strategic asset allocations for the whole portfolio.This narrow definition of investment universe for investment of foreign exchange reserves is mostly prompted by overriding consideration of safety (from the point of view of credit risk) and liquidity. Alternatively, as against managing reserves as a single portfolio, a horizontal separation of reserves is created through creation of ‘liquidity’ and ‘investment’ tranches (IMF, 2005a and 2005b) to give focused attention on liquidity and return objectives separately4. In view of recent crisis, there is also a thought process among central banks to create a ‘buffer’ tranche which will act as a protection against ‘more than expected’ liquidity need; by creating such a tranche, the investment objective of the ‘investment’ tranche can be protected against liquidity needs under moderately extreme situation. The size of ‘liquidity’ and ‘buffer’ tranches may be determined by immediate liquidity needs5 and excess liquidity needs in a moderately extreme situation, respectively; investment of such tranches will be typically in liquid and moderately liquid instruments.In such a situation, optimization exercise will be based on the specific objective of the respective tranches. This horizontal separation of reserve may be potentially sub-optimal, but better manageable from the operational point of view. Further advantage is that the investment universe of ‘investment’ tranche may be somewhat wider than the ‘liquidity’ and ‘buffer’ tranches allowing exploration of high yielding high volatility bond markets of developing countries under the investment tranche. The central banks are generally conservative in their investment strategy. Typically, they allocate the reserve among important currencies depending upon various parameters and within each currency portfolio, duration is restricted to control downside risk6. The strategic allocation of assets within a currency or tranche is then arrived at through optimization exercise based on the desire to either minimize the risk or maximize the risk-return trade-off or maximizing the return7. However, it should be recognized that the optimum asset allocation under broader mean-variance framework of Markowitz (1959) will vary along with changing return and volatility structure, though the duration target may remain the same. In the face of recent low yield scenario in the international bond market (on an average yield came down by almost 300 basis points (bp) during the post-crisis period as compared to the pre-crisis period (Chart 1), many central banks might have become more conservative in their duration target to protect the down side; some other central banks might have become more aggressive in terms of duration in search of more return. In this exercise our aim is limited to understand the effect of recent financial crisis on optimal asset allocation pattern for different duration targets and the consequences thereon. In doing so, we have considered the investments of foreign exchange reserves in the US government bond market only as a first step, as over 61 percent of the world reserves are denominated in US Dollar8. Further, as mentioned earlier, in search of better return, there are possibilities of exploring government bond markets of developing countries. In view of that we have also extended the exercise by including the government bond markets of developing countries to understand the effect of such inclusion in the optimum asset allocation pattern and consequences thereof. Outline of the remaining part of the paper is as follows:Section II explains the datasets and methodology used,Section III analyses the results and Section IV provides conclusions. Section II: Datasets and methodology For the purpose of this exercise, we have used Barclays Capital Short Treasury indices9 for US, taken from Barclays Capital website, to represent money market return; bond market data are based on Datastream Government Bond indices10 for US taken from Thomson Reuters and Emerging Asia Sovereign USD-denominated bond data are based on Barclays Capital US Emerging Markets Bond index11 taken from Barclays Capital website. We have deliberately restricted our investment universe of sovereign bonds to residual maturity up to 10 years, as many central banks (IMF, 2005a and 2005b) concentrate on these categories of sovereign bonds12. Monthly data have been used implying a rebalancing period of 1-month. In this study, we have deliberately excluded some data points around the failure of Lehman Brothers as we felt that during this period the market was not functioning on its own dynamics. Thus, we have defined ‘Pre-crisis’ period as the period from January 2005 to May 2008 and ‘Post-crisis’ period from January 2009 to December 2010 – leaving the month of failure of Lehman Brothers (i.e. September 2008), three months before and three months after.Thus ‘Pre-crisis’ period data has 41 observations and ‘Post-crisis’ period data has 24 observations. As mentioned earlier, we have attempted three different optimizations, namely, maximization of portfolio return, minimization of portfolio risk, maximization of return per unit risk of the portfolio subject to the conditions: (i) portfolio duration being equal to the target duration. (ii) weights being non-zero, that is, short sales are not allowed and (iii) sum of the weights being unity.
After obtaining the optimal asset allocation, we have tested, based on Jarque-Bera test statistic (Jarque and Bera, 1987), whether the return of the obtained optimal portfolio follows normal distribution.If not, we then have tried to find out the best fitted distribution of the portfolio return.Theoretical probabilities of getting negative monthly return and first percentile figures of the optimal portfolios, which are reported in the Table/ Annex, are based on these fitted distributions (Normal/ other best fit distribution as the case may be). To compute the effect of yield rise on the portfolio, we have used the Convexity adjusted Exponential Duration method of Srimany & Gayen (2009). This method provides more precise estimate than the traditional duration based estimate, 'exponential duration' based estimate (Miles Livingston and Lei Zhou, 2005) or even traditional duration and convexity based estimate.The estimated change in price for ∆y change in yield is given below (P(.), MD and V stand for price function, modified duration and convexity, respectively).
We have used MS-Excel, Eviews and MATLAB for computation. Changing Optimal Asset Allocation structure and consequences The post-crisis period is characterized by very low yield scenario as depicted in Chart 1 for US sovereign securities market. Average yield in the US sovereign securities market came down drastically during the post-crisis period.Further, the curve has steepened heavily.The picture for other important markets, like EUR and GBP markets, are very similar.The returns in those markets also declined drastically during the post-crisis period.As most of the reserves of the world are invested in sovereign securities of these markets, the central banks are searching for appropriate asset allocation to generate extra yield/return. However, they are also concerned about the erosion in the value of assets due to negative returns.We have analyzed both these aspects for different categories of central banks with different duration targets according to their objectives of reserve management.
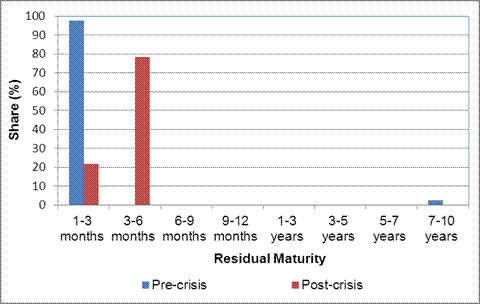
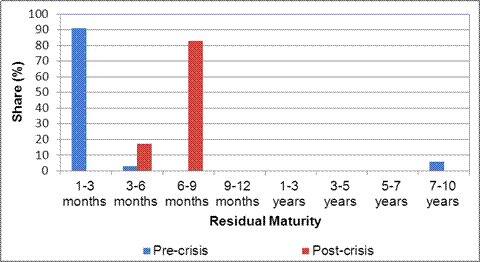
Optimal portfolio with low target duration: Those central banks who are focused on liquidity of the reserves (possibly because of inadequate level of reserves) or those central banks, who have carved out a portion of their reserves as a ‘liquidity’ tranche, generally target a low duration for the portfolio. They are also expected to be conservative in their approach in deriving their asset allocation; as such their expected preference will be to derive asset allocation through risk minimization with appropriate duration constraint. We have presented the results based on all the three optimization exercises for target duration of 3 months and 6 months (i.e. low duration targets commensurate with liquidity focused portfolios) in Annex 1A to 2B.The changing optimum asset allocation pattern relating to risk minimization exercise for those low duration targets are highlighted below (Chart 2).
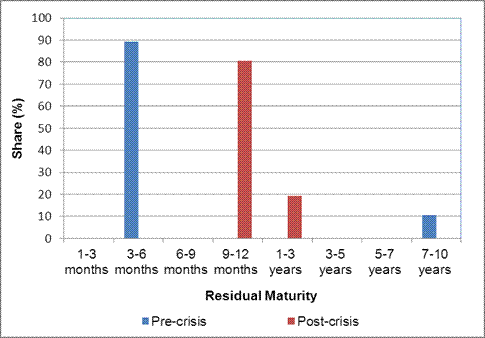
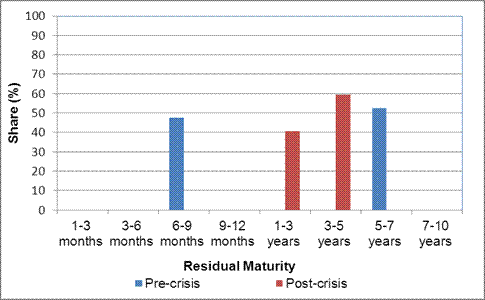
As can be observed from the graphs, while the optimal portfolio structure (with target durations of 3 months and 6 months) during the pre-crisis period was of barbell structure which gave better convexity to the portfolio, during the post-crisis period the optimal portfolio remains concentrated within 1 to 6 months for duration target of 3 months and 3 to 9 months for duration target of 6 months. Incidentally, post-crisis period risk minimization exercise for both the target durations also maximizes the risk-return trade-off of the portfolio.But what are the consequences? Let us have a close look at some of the consequences presented in Table 1 below. In the process, we have tested whether the returns of the optimal asset allocation follow normality assumption which is crucial for calculating the probability of negative returns and the 1st percentile of the distribution. As mentioned earlier these parameters are generally kept in view by central banks for their decision making processes.As can be observed from Annex 8, the optimal portfolios (with risk minimization) for both the target durations of 3 months and 6 months during pre- and post-crisis periods follow normality assumptions. As can be observed from the above table, while during the pre-crisis period, the average yield pick-up was only 3 basis points (bp) per annum for moving the target duration from 3 months to 6 months, during post-crisis period it was observed to increase substantially by 10 bp per annum.Simultaneously, return gain for moving from 3 months duration to 6 months duration was substantially higher during post-crisis period at 20 bp per annum as compared to only 4 bp per annum during pre-crisis period. Thus, under very low yield/ return scenario of post-crisis period, it will be prudent to move higher in duration target to generate extra return. But what about the probability of negative return? Generally, central banks having very low level of reserves are averse to capital erosion at any point of time. For that very reason, during the pre-crisis period, their general preference would have been to have an investment strategy with 3 months target duration which would have ensured them a probability of negative return (per month) of only 0.26%.However, during the post-crisis period, such investors would face a high probability of negative return of 8.81% (which was more than the probability of negative return for target duration of 12 months during pre-crisis period).Thus, under the post-crisis scenario, reserve managers with low duration targets will also face more frequent negative monthly return scenario. Optimal portfolio with medium target duration: Some central banks feel that their reserves positions are adequate, but they simultaneously face frequent current account deficit in their external account.Thus, they have to be in readiness to meet the excess foreign currency liquidity demand as and when arises in the domestic market. Those central banks should ideally go for medium target duration for deployment of their reserves to protect the liquidity need as well as to generate some return.These type of central banks, as also those central banks who have created a ‘buffer’ tranche of reserve as a strategy for reserve management, are expected to mostly look at the asset allocations which will generally give them maximum pay-off per unit amount of risk undertaken by them.To them, most relevant asset allocation will be the optimal asset allocation obtained through maximization of risk-return trade-off. For purpose of this article, we have chosen two target durations in this category – 12 months and 18 months; similar results can be derived based on the methods followed by us for any other target durations.While all the optimization results are presented in Annex 3A to 4B, we analyze here the optimization results relating to maximization of return per unit risk for reasons as mentioned above. Accordingly, the optimal asset allocation patterns during pre- and post-crisis periods for target durations of 12 months and 18 months are graphically presented in Chart 3 below.
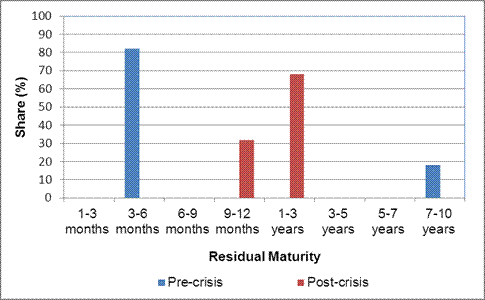
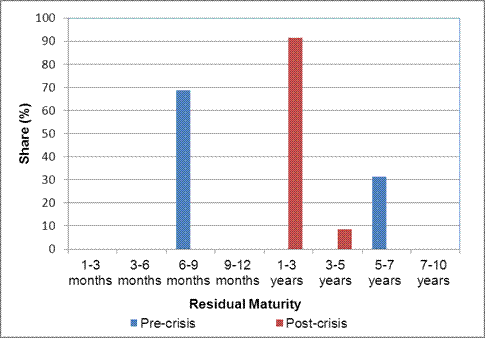
As in case of ‘optimal portfolio with low target duration’ we observe that while the optimal portfolios during pre-crisis period was of barbell structure, during post-crisis period the asset allocation structures suggest for sacrifice of convexity and concentration between 9 months to 3 years in both the cases, certainly with differential weights to meet the duration targets.Further, during post-crisis period, the risk minimization exercise also provided similar asset allocation.As regards applicability of normality assumption of the derived optimal portfolios’ returns under risk-return trade-off maximization,as can be observed from Annex 8,the test statistics indicates towards acceptance of null hypothesis of normality.Accordingly,the Table 2 presented below depicts the consequences of low yield scenario on optimal portfolios under post- and pre-crisis periods. As can be observed therefrom, the yield pick-up for moving from 12 months duration to 18 months duration will be substantial during the post-crisis period as compared to pre-crisis period, though in absolute term yield came down heavily as compared to pre-crisis period. Simultaneously, return gain for moving from 12 months duration to 18 months duration was substantially higher during post-crisis period at 42 bp per annum as compared to only 5 bp per annum during pre-crisis period.Thus, under very low yield/ return scenario of post-crisis period, there is a case for moving to higher duration target to generate extra return. However, as in the previous case, the probability of negative return will increase substantially during the post-crisis period, giving more discomfort to reserve managers. Optimal portfolio with long target duration: Some of the central banks see accretion to reserve through the current account surplus and thus they are comfortable regarding their reserve level. In such a scenario, they face low demand for foreign currency liquidity in the domestic market.Thus, focus of their reserve management would be on higher return generation/ return maximisation.In many cases, for operational convenience they create ‘investment’ tranche with exclusive focus on return generation13.They generally target long duration and the most appropriate asset allocation for them will be the optimal asset allocation derived through maximization of returns within the applicable investment universe.For the purpose of this article, we have chosen two target durations in this category – 2 years and 3 years.Similar results can be derived based on the methods followed by us for any other target durations. While all the optimization results are presented in Annex 5A to 6B, we analyze here the optimization results relating to maximization of return for reasons as mentioned above. Accordingly, the optimal asset allocation patterns during pre- and post-crisis periods for target durations of 2 years and 3 years are graphically presented in Chart 4 below.
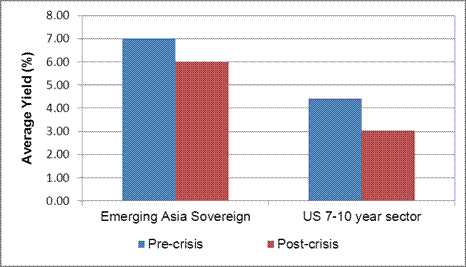
Interestingly, in this case also, we observe similar trend in the changing asset structure, as in the previous two cases. The optimal asset allocation during post-crisis period suggests a concentration between 1 to 5 years as against the barbell structure for pre-crisis period.Further, during the post-crisis period, the return maximization exercise was observed to be equivalent to the optimal asset allocation under maximization of return per unit risk (i.e. maximization of risk-return trade-off).As regards applicability of normality assumption of the derived optimal portfolios’ returns, as can be observed from Annex 8, the test statistics indicates towards acceptance of null hypothesis of normality.Accordingly, the Table 3 presented below depicts the consequences of low yield scenario on optimal portfolios under post- and pre-crisis periods. As in the previous cases, the yield and return pick-up for moving from target duration of 2 years to 3 years was observed to be substantial during post-crisis period as compared to pre-crisis period.However, the probability of negative return will be substantially higher, as in previous occasions. Is there any alternative to generate higher return? We have observed earlier that under very low yield scenario in developed market, the conventional way to increase return will be through extending the duration of the reserve portfolio.However, the consequence will be more frequent negative returns, a scenario with which the central bankers are not generally comfortable because of their conservative nature.An alternative to the central bankers will be to extend the universe of investment to government security markets of a selected group of rapidly growing emerging market countries. This will involve the allocation of reserve into currencies of those selected countries. It is true that such currency diversification effort will be limited by liquidity and convertibility factors of those currencies.However, the more important aspect in favour of this selective diversification is that, it will increase the foreign exchange reserve’s ability to hedge or serve trade flows between the home country and those rapidly growing economies and also to take advantage of the appreciations of those currencies. For the sake of this study we have chosen the emerging Asian countries that have a long-term foreign currency debt sovereign rating of Baa1/ BBB+/BBB+ or below, using the middle rating of Moody’s, S&P and Fitch and is represented by the Barclays Capital US Emerging Markets Bond index for Asia11.The yield scenario of those countries during pre- and post-crisis period is presented in the Chart 5 below. Emerging Asia yield decreased from the pre-crisis average level of 7.00% to 5.98% as against the decrease in yield from 4.41% to 3.02% for US ‘7-10 years’ bonds index which corresponds to almost similar duration.
We have repeated all those optimization exercises for post-crisis period with emerging Asia sovereign bond as one more asset class.The new optimal asset allocations and the consequences, based on these exercises, are presented in Annex 7A to 7F. Important observations on optimal asset allocation as emerged from such exercise are presented below.
The results reveal that the asset allocation pattern for low target duration portfolios (i.e. duration targets of 3 or 6 months) with risk minimization objective remains similar with insignificant allocation to emerging Asian sovereign bonds. This observation is as per general expectations, as central banks with a focus on liquidity generally target those types of duration and the reality is that the emerging Asian sovereign bond markets are not so liquid from international investors’ point of view. If we move to higher duration targets of 12 or 18 months (medium target duration cases) with some emphasis on the aspect of returns (i.e. derivation of optimal asset allocation through maximization of return per unit risk), then we observe that along with the same set of asset classes the emerging Asia also gets some allocation (i.e. only 4.8% for 12 months duration and 9.4% for 18 months duration).Keeping in view the low level of allocation to emerging Asia, this might be an acceptable situation for those central bankers with adequate level of reserve who generally prefer medium target durations. However, in case of long duration targets of 2 and 3 years with objectives of return maximization, the allocation structure changes drastically and suggests investing heavily in the emerging Asia sovereign bonds.But is there any gain in the process? The answer is ‘YES’.The table below presents the consequences for including emerging Asia in the investment universe.
In case of low target durations, as mentioned earlier, there is no visible change in asset allocation pattern; therefore, there will be no changes in the yield, return and probability of negative returns. In case of medium target duration category, as can be observed from the above table, there will be substantial yield and return pick-up by including the emerging Asia within the investment universe; the probability of negative return also comes down. However, in case of long target duration, the results are very interesting. As in the case of previous two categories, there will be strong yield and return pick-up with lower probability of negative returns. A close look at the result also reveals two interesting observations as mentioned below. (1) Without extending the duration of the reserve portfolio from 2 years to 3 years, it is possible to generate 356 bp extra return per annum in the post-crisis period simply by including the emerging Asia within the investment universe (annual return for 3 years duration excluding emerging Asia is 2.07%, whereas the same for 2 years duration including emerging Asia is 5.63%). (2) Those central bankers whose target duration is 3 years, can perform better (in terms of return) than the pre-crisis situation by merely including the emerging Asia in their investment universe in the present context (annual return for 3 year duration in the pre-crisis situation without any investment in emerging Asia was 4.59% whereas the same in the post-crisis situation by including the emerging Asia is 8.49%). Thus a way forward in the present low yield scenario in developed Sovereign markets will be to include emerging markets in the investment universe and exploit the potential higher return at the opportune time. Central banks generally follow the objectives of ‘safety (capital preservation), liquidity and return’ and try to find out the optimal trade-off between those three objectives, depending on the relative emphasis on those three policy objectives.As against managing reserves as a single portfolio, sometimes a horizontal separation of reserve is created through creation of ‘liquidity’, ‘buffer’ and ‘investment’ tranches to give focused attention on liquidity and return objectives separately.This horizontal separation of reserves may be potentially sub-optimal, but better manageable from the operational point of view.Generally, the strategic allocation of assets within a currency or tranche is arrived at through optimization exercise based on the desire to either minimize the risk or maximize the risk-return trade-off or maximizing the return. For the reasons stated earlier, we have considered risk minimization in case of low duration portfolio like 'liquidity' tranche and target duration considered are 3 months and 6 months although optimum allocation for other target durations can be worked out. For medium duration portfolio (like 'buffer' tranche), we have used risk-return trade-off maximization with 12 and 18 months target durations and for long duration portfolio (like 'investment tranche') we have used return maximization with 2 and 3 years target durations. Based on USD-denominated government bond data, we have studied the characteristics of the optimal portfolio in the 'pre-crisis' and 'post-crisis' periods. Our analysis reveals the following:(i) the optimal asset allocation during post-crisis period suggests a concentrated portfolio as against the barbell structure for pre-crisis period, irrespective of low, medium or high target duration;(ii) return and yield, in absolute term, are very low in the post-crisis period;(iii) central banks can get higher pick-up in return in the post-crisis scenario than in the pre-crisis scenario for same amount of increase in duration;(iv) in the post-crisis period, the probability of negative return increases substantially as compared to the pre-crisis period. In the post-crisis scenario of low yield/ return and high probability of negative return, an alternative to the conventional way of increasing return by increasing duration will be to extend the universe of investment to government security markets of a selected group of rapidly growing emerging market countries. We observe that in the post-crisis scenario, the central banks with medium/ long target duration can get substantial yield and return pick-up and also reduce the probability of negative return by including the USD-denominated debt of emerging sovereigns in Asia within the investment universe even without extending the duration. We believe that this study will be helpful to the central banks in better management of their foreign exchange reserves in present low yield scenario in the developed market. In this study, we have considered only USD denominated assets – we have considered investments in the US Government securities and also tried to find out the effect of diversification into emerging Asian Sovereign bonds denominated in USD in the post-crisis period. IMF database8 shows that currency composition of foreign exchange reserves has undergone slight change in the post-crisis period as compared to the pre-crisis period. Thus further scope of study in this area can be studying the optimum asset allocation by considering investments in other international government bond markets and also incorporating the currency distribution of the reserve under the optimization framework. @ Dr. A. K. Srimany (aksrimany@rbi.org.in) is General Manager, Shri Sneharthi Gayen (sgayen@rbi.org.in) is Assistant General Manager and Shri Ranjeev (ranjeev@rbi.org.in) is Manager in Reserve Bank of India. *The views expressed in this paper are of the authors and not necessarily of Reserve Bank of India. Authors are thankful to the anonymous referees for their valuable comments. An earlier version of the paper in the form of ‘Low Yield Scenario – An Analysis of US Fixed Income Market’ was presented and discussed during the 3rd IMF Roundtable of Sovereign Assets and Reserve Management held at IMF, Washington DC, Jan 20-21, 2011. Notes: 1 Strategic asset allocation generally gives direction of medium term risk-return trade-off and works as performance benchmark; it is generally observed that the strategic asset allocation explains almost 90% of return volatility (see Ibbotson & Kaplan, 2000). 2 A supranational entity is formed by two or more central governments to promote economic development for the member countries.Supranational Institutions finance their activities by issuing bond debt and are usually considered part of the sub-sovereign debt market.Examples of supranational institutions are the World Bank, European Bank for Reconstruction and Development; European Investment Bank; Asian Development Bank, Inter-American Development Bank, etc. 3 Here 'risk' identifies the safety in terms of market volatility. 4 Also sometimes a ‘liability’ tranche may be created to address the need to hedge specific liabilities, though conceptually it is more appealing for pension fund investments which generally have continuous liability stream (Amnec et al, 2010). 5 The size of 'liquidity' tranche is counter-cyclical in the sense that when the size of reserve is rapidly increasing, the proportionate size of the liquidity tranche may be reduced (as there is expected to be less demand for foreign currency liquidity in the domestic market) and vice versa. 6 For a more detailed discussion on this aspect one may refer to Fisher & Lie (2004). 7 Through duration management we may contain the interest rate risk at acceptable level; however, risk in terms of volatility of return encompasses all types of financial risk and as such optimization involving volatility of return will be more appropriate. 8 'Claims in US Dollars' as percentage of 'allocated reserves' in fourth quarter 2010 was about 61.4%, as per the Currency Composition of Official Foreign Exchange Reserves (COFER) database of IMF. 9 Barclays Capital Short Treasury Index for US is composed of zero-coupon Treasury Bills and fixed-rate Treasury bonds with a maturity between 1 and 12 months. Maturity sub-indices are published for 1-3 month, 3-6 month, 6-9 month and 9-12 month and can be separated into sub-indices that include only bills or include only notes that have age below 1-year. We have used indices that include both bills and notes aged below 1-year. Index data is available from Barclays Capital Live (live.barcap.com; keyword: Indices). 10 Datastream all-bond index for US covers all traded bonds, irrespective of liquidity, and is primarily of interest to long term domestic investors with portfolios covering the complete sector. Bonds which are generally included: bullet bonds, callable bonds, bonds with serial redemptions, bonds with purchase funds, partly paid bonds (treated as if fully paid), graduated rate bonds once the last coupon fixing has been applied. Bonds which are generally excluded: bonds with less than one year to maturity, floating rate bonds, convertible bonds, bonds with attached warrants, indexed bonds, puttable bonds, extendable bonds, bonds with sinking funds, very small or illiquid bonds. Maturity sub-indices are published for 1-3 years, 3-5 years, 5-7 years, 7-10 years and more than 10 years. Index data is available from Datastream (Thomson Reuters). 11 Barclays Capital US Emerging Markets Bond index includes fixed and floating-rate USD-denominated debt issued by emerging Asia Sovereigns. Bonds must have at least one year of residual maturity for inclusion. Principals and coupons are denominated in USD. Fixed-rate bullet, puttable and callable bonds issued by Sovereign are included and bonds with equity-type features (e.g. warrants, convertibility) are excluded. Maturity sub-indices are not available. Index data is available from Barclays Capital Live (live.barcap.com; keyword: Indices). 12 As per market information, higher residual maturity bonds are generally invested by long-term institutional investors like pension fund, provident fund, Sovereign wealth fund, etc. 13 In some cases, central banks transfer a portion of their reserve to create ‘sovereign wealth fund’ with the objective of investing in very illiquid instrument like commodity, industrial equity, etc. with high return potential. References:
Annex 1A: PRE-CRISIS PERIOD – OPTIMAL PORTFOLIO WITH 3 MONTH DURATION
Annex 1B: POST-CRISIS PERIOD – OPTIMAL PORTFOLIO WITH 3 MONTH DURATION
Annex 2A: PRE-CRISIS PERIOD – OPTIMAL PORTFOLIO WITH 6 MONTH DURATION
Annex 2B: POST-CRISIS PERIOD – OPTIMAL PORTFOLIO WITH 6 MONTH DURATION
Annex 3A: PRE-CRISIS PERIOD – OPTIMAL PORTFOLIO WITH 12 MONTH DURATION
Annex 3B: POST-CRISIS PERIOD – OPTIMAL PORTFOLIO WITH 12 MONTH DURATION
Annex 4A: PRE-CRISIS PERIOD – OPTIMAL PORTFOLIO WITH 18 MONTH DURATION
Annex 4B: POST-CRISIS PERIOD – OPTIMAL PORTFOLIO WITH 18 MONTH DURATION
Annex 5A: PRE-CRISIS PERIOD – OPTIMAL PORTFOLIO WITH 2 YEAR DURATION
Annex 5B: POST-CRISIS PERIOD – OPTIMAL PORTFOLIO WITH 2 YEAR DURATION
Annex 6A: PRE-CRISIS PERIOD – OPTIMAL PORTFOLIO WITH 3 YEAR DURATION
Annex 6B: POST-CRISIS PERIOD – OPTIMAL PORTFOLIO WITH 3 YEAR DURATION
Annex 7A: POST CRISIS PERIOD – OPTIMAL PORTFOLIO INCLUDING EMERGING ASIA WITH 3 MONTH DURATION
Annex 7B: POST CRISIS PERIOD – OPTIMAL PORTFOLIO INCLUDING EMERGING ASIA WITH 6 MONTH DURATION
Annex 7C: POST CRISIS PERIOD – OPTIMAL PORTFOLIO INCLUDING EMERGING ASIA WITH 12 MONTH DURATION
Annex 7D: POST-CRISIS PERIOD – OPTIMAL PORTFOLIO INCLUDING EMERGING ASIA WITH 18 MONTH DURATION
Annex 7E: POST CRISIS PERIOD – OPTIMAL PORTFOLIO INCLUDING EMERGING ASIA WITH 2 YEAR DURATION
Annex 7F: POST CRISIS PERIOD – OPTIMAL PORTFOLIO INCLUDING EMERGING ASIA WITH 3 YEAR DURATION
Annex 8: Testing Normality of optimal portfolio returns Pre-crisis
Post-crisis without Emerging Asia
Post-crisis with Emerging Asia
| |||||||||||||||||||||||||||||||||||||||||||||||||||||||||||||||||||||||||||||||||||||||||||||||||||||||||||||||||||||||||||||||||||||||||||||||||||||||||||||||||||||||||||||||||||||||||||||||||||||||||||||||||||||||||||||||||||||||||||||||||||||||||||||||||||||||||||||||||||||||||||||||||||||||||||||||||||||||||||||||||||||||||||||||||||||||||||||||||||||||||||||||||||||||||||||||||||||||||||||||||||||||||||||||||||||||||||||||||||||||||||||||||||||||||||||||||||||||||||||||||||||||||||||||||||||||||||||||||||||||||||||||||||||||||||||||||||||||||||||||||||||||||||||||||||||||||||||||||||||||||||||||||||||||||||||||||||||||||||||||||||||||||||||||||||||||||||||||||||||||||||||||||||||||||||||||||||||||||||||||||||||||||||||||||||||||||||||||||||||||||||||||||||||||||||||||||||||||||||||||||||||||||||||||||||||||||||||||||||||||||||||||||||||||||||||||||||||||||||||||||||||||||||||||||||||||||||||||||||||||||||||||||||||||||||||||||||||||||||||||||||||||||||||||||||||||||||||||||||||||
पेज अंतिम अपडेट तारीख:


