
VI. External Sector - आरबीआय - Reserve Bank of India


VI. External Sector
Balance Of Payments
International Investment Position
Foreign Exchange Reserves
6.1 A vibrant and diversified export performance underpinned the growing vigour and resilience of India's external sector in 2002-03 notwithstanding an environment dominated by the weakness of the global recovery, declines in equity markets and geopolitical uncertainties. Import demand was driven up by the pace of revival of industrial activity domestically relative to the rest of the world; however, with India emerging as the world's fastest growing exporter after China amongst leading exporting nations, the current account of the balance of payments was in surplus for the second successive year. A rising confidence in the macro-fundamentals created a distinct home bias. Readjustments of net financial claims of banks, corporates and exporters in favour of domestic assets resulted in net capital inflows becoming stronger, in spite of lower debt flows and foreign investment. The positive developments in current and capital account transactions were reflected in a modest appreciation of the exchange rate vis-a-vis the US dollar. There was an unprecedented order of accumulation of foreign exchange reserves, the third largest increase among emerging market economies in the year. At the end of March 2003, the reserves were equivalent of around 14 months of imports or about five years of debt servicing, amply satisfying the so-called 'Guidotti rule' (usable foreign exchange reserves should exceed scheduled amortisation of foreign currency debts, assuming no rollovers, during the following year).
The burgeoning reserves enabled a further consolidation of external debt during the year through prepayment of multilateral and commercial debt as well as shifts in the composition and maturity of nonresident deposit liabilities.
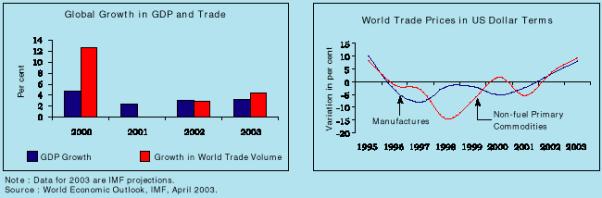
6.2 Global recovery was hesitant in 2002, losing momentum from the fourth quarter amidst rising uncertainties related to the war in Iraq and the fallout from the bursting of the equity market bubble. Stock markets across the globe experienced declines for the third consecutive year as investor confidence continued to remain weak. The expansion of world trade volume (goods and services) was modest. It occurred mainly on account of the Asian and transition economies where trade growth, according to the World Trade Organisation (WTO), was at least twice as fast as output growth, supported by vigorous expansion of intra-regional demand. The appreciation of the US dollar had the effect of 'deflating' world trade prices measured in US dollar terms in the last few years. This trend was reversed during 2002 with the depreciation of the US dollar. Internationally traded prices of manufactures in US dollar terms increased for the first time since 1995. Traded prices for cereals, in particular, wheat, rose markedly, reflecting the effect of a decline in production for the second year in a row due to drought in four of the five traditional exporting regions (Chart VI.1).
Chart VI 1 : Global Output and Trade
6.3 Overall GDP growth in emerging market economies (EMEs), particularly in the Asia Pacific region, remained strong despite adverse external developments. According to the Economic and Social Commission for Asia and the Pacific (ESCAP), the region emerged as the fastest growing in the world in 2002. Financing conditions in EMEs also improved with the decline in emerging market spreads since October 2002. Although private direct investment flows were lower, a moderation in outflows of other private capital flows helped to maintain the volume of net private capital flows to EMEs (Chart VI.2). These flows are expected to be marginally higher during 2003 on account of some improvement in FDI inflows.

6.4 Global inflation generally remained benign, ruling below two per cent in industrial countries in the face of widening output gaps in the USA and the Euro area. With several Asian economies experiencing declines in inflation and the ongoing slowdown in Japan, there has been concern about the possibility of a widespread global deflation. Since deflation has large potential costs, it underscores the importance for central banks to act aggressively and pre-emptively, if needed, to forestall the onset of deflationary forces (Box VI.1).
6.5 According to the International Monetary Fund (IMF) projections, global GDP and trade volume growth may show some acceleration in 2003 to 3.2 per cent and 4.3 per cent, respectively. Reduction in geo-political uncertainties, stabilising equity market conditions and a turn in the inventory cycle are expected to lead to the improvement in growth prospects. Despite the accommodative stance of monetary and fiscal policies, marked differences persist in the macroeconomic stimuli available in the pipeline in the key currency areas. The large and growing global macroeconomic imbalances present the biggest risk to a sustained global recovery (Box VI.2).
Box VI.2 The global economy has been beset with the emergence of large macroeconomic imbalances in the last two decades on account of a general decline in saving rates in advanced economies which, in turn, fuelled fears of a global capital squeeze in the early 1990s. The global saving gap is widely regarded as the key factor underlying the rising real interest rates in the 1980s and the 1990s. By the end of the 1990s, however, developing countries as a group turned into net exporters of capital and helped to finance large and growing current account deficits of some of the advanced economies (Table). Nevertheless, concerns about a disorderly correction of the global imbalances have been amplified by large currency realignments, and exacerbated by the recent depreciation of the US dollar. Although the growing imbalances may seem to be an integral feature of globalisation, there are nonetheless limits to the accumulation of net claims against an economy that are implied by persistent current account deficits. The cost of servicing such claims adds to the current account deficit and, under certain circumstances, can be destabilising.
There are apprehensions that the moderation in real interest rates in the recent period may be reversed with stronger global recovery if the saving imbalance is not corrected through real sector adjustments (i.e., lower growth in deficit countries like the US and higher growth in surplus countries). This can, however, weaken the growth prospects of the rest of the world, given the large dependence of the global economy on the performance of the US economy. In the Asian region, current account surpluses and high official foreign exchange reserves are a manifestation of the global imbalance. As stronger recovery takes root across the globe, these countries would have to confront again the challenge of the early 1990s, i.e., whether global savings are adequate to meet the investment demand of emerging markets and what order of imbalance could be considered as appropriate from the stand point of ensuring global monetary and financial stability. Sustained improvement in fiscal positions of all countries could be the most desirable option. Demographic factors, however, could continue to depress saving rates and even operate as a constraint to fiscal consolidation. Since the imbalance has to unwind at some stage, it could be less disorderly if the process is driven by stronger growth in other regions with only a modest drop in the value of the US dollar. References
|
||||||||||||||||||||||||||||||||||||||||||||||||||||||||||||||||||||||||||||||||||||||||||||||||||
6.6 Sustaining growth in 2003 would depend largely upon stimulating domestic demand as the stimulus from external demand is unlikely to be strong. Signs of the recent slow down in the global information technology sector, the delay in a significant decline in international oil prices after the end of the war in Iraq, large depreciation of the US dollar and very weak economic activity in the first quarter of 2003 suggest that the pace of further recovery in growth may not be fast. The outbreak of Severe Acute Respiratory Syndrome (SARS) in several Asian developing countries and the global alert issued by the World Health Organisation (WHO) in March 2003 affected the short-term growth prospects of East Asia. Various projections by international organisations suggest that growth in the East Asian countries could be affected in the range of 0.1 to 0.4 percentage points.
6.7 With the increasing integration of developing countries into global production processes, trade and financial flows, external developments have a major bearing on their domestic growth prospects. While the known opportunities associated with globalisation in terms of access to wider markets, greater capital, higher competitive efficiency and better technology justify the need for sustaining the process, the costs of globalisation, particularly in terms of growing income inequality and greater vulnerability to financial crisis, have emerged as major challenges (Box VI.3).
6.8 As mentioned earlier, occurrence of financial crisis and large external effects are associated with the process of globalisation. While the responsibility for preventing crisis from occurring is essentially regarded as national, the objective of mitigating the fall out of these crises, if and when they occur, needs to be assigned globally in an integrated and interdependent world. This has provoked the search for the appropriate international financial architecture. With a view to strengthening the crisis prevention and resolution architectures, both at the national and international levels, considerable emphasis is being laid on the Sovereign Debt Restructuring Mechanism (SDRM) to contain the vulnerability to financial crisis (Box VI.4).
6.9 India's balance of payments (BoP) improved significantly during 2002-03, with an overall surplus in each quarter. A surge in exports of merchandise and invisibles posted the current account into a surplus, in contrast to the previous year when a small current account surplus appeared due to lack of import demand. Growing openness in terms of the share of tradables in the economy is increasingly being driven by exports. The healthy rise in current receipts has had salutary effects on debt servicing capabilities and on import purchasing power. Banking capital movements supported by stable non-resident deposits brought in higher net capital flows, notwithstanding substantial pre-payments of multilateral debt (Table 6.1).
(US $ million) |
|||||||||
|
|
|||||||||
Item/Indicator |
2002-03 |
2001-02 |
2000-01 |
1999- |
1990-91 |
||||
2000 |
|||||||||
|
|
|||||||||
1 |
2 |
3 |
4 |
5 |
6 |
||||
|
|
|||||||||
i) |
Trade Balance |
-12,474 |
-12,703 |
-14,370 |
-17,841 |
-9,437 |
|||
ii) |
Invisibles, net |
16,182 |
13,485 |
10,780 |
13,143 |
-243 |
|||
iii) |
Current Account Balance |
3,708 |
782 |
-3,590 |
-4,698 |
-9,680 |
|||
iv) |
Capital Account |
12,638 |
10,573 |
10,018 |
10,444 |
7,056 |
|||
v) |
Overall Balance # |
16,980 |
11,757 |
5,856 |
6,402 |
-2,492 |
|||
vi) |
Foreign Exchange Reserves (Increase-, Decrease +) |
-16,980 |
-11,757 |
-5,830 |
-6,142 |
1,278 |
|||
(excluding valuation changes) |
|||||||||
Indicators (in per cent) |
|||||||||
1. |
Trade |
||||||||
i) |
Exports/GDP |
10.4 |
9.3 |
9.8 |
8.4 |
5.8 |
|||
ii) |
Imports/GDP |
12.8 |
12.0 |
12.9 |
12.4 |
8.8 |
|||
iii) |
Income Terms of Trade Growth |
.. |
1.6 |
18.2 |
3.4 |
0.1 |
|||
iv) |
Export Volume Growth |
.. |
3.9 |
23.9 |
15.5 |
11.0 |
|||
2. |
Invisibles |
||||||||
i) |
Invisibles Receipts/GDP |
8.4 |
7.7 |
7.6 |
6.8 |
2.4 |
|||
ii) |
Invisibles Payments/GDP |
5.3 |
4.9 |
5.2 |
3.8 |
2.4 |
|||
iii) |
Invisibles (Net)/GDP |
3.1 |
2.8 |
2.4 |
3.0 |
-0.1 |
|||
3. |
Current Account |
||||||||
i) |
Current Receipts@/GDP |
18.7 |
16.9 |
17.3 |
15.1 |
8.0 |
|||
ii) |
Current Receipts Growth@ |
17.7 |
2.4 |
17.6 |
12.9 |
6.6 |
|||
iii) |
Current Receipts@/Current Payments |
103.6 |
100.5 |
95.3 |
93.0 |
71.5 |
|||
iv) |
Current Account Balance/GDP |
0.7 |
0.2 |
-0.8 |
-1.1 |
-3.1 |
|||
4. |
Capital Account |
||||||||
i) |
Foreign Investment/GDP |
1.1 |
1.7 |
1.5 |
1.2 |
0.0 |
|||
ii) |
Foreign Investment/Exports |
10.6 |
18.1 |
15.1 |
13.8 |
0.6 |
|||
5. |
Others |
||||||||
i) |
Debt-GDP Ratio |
20.0 |
21.0 |
22.4 |
22.2 |
28.7 |
|||
ii) |
Debt Service Ratio |
14.7 |
13.9 |
17.2 |
16.2 |
35.3 |
|||
iii) |
Liability Service Ratio |
15.7 |
14.9 |
18.4 |
17.0 |
35.6 |
|||
iv) |
Import Cover of Reserves (in months) |
13.8 |
11.3 |
8.6 |
8.2 |
2.5 |
|||
|
|
|||||||||
# |
Includes Errors and Omissions. |
..Not available. |
@ Excluding official transfers. |
||||||
Merchandise Trade
6.10 Notwithstanding the subdued recovery in world trade, India ranked second only to China as the fastest growing exporting economy in the world in 2002 amongst leading exporting nations. Export growth at 19.2 per cent surpassed the target of 12 per cent set for 2002-03. This reflected recovery in trade volume as well as in the terms of trade. Various policy initiatives taken by the Government in the recent years for export product and market diversification have helped in improving export competitiveness (Box VI.5).
6.11 Export growth during 2002-03 was broad-based, across commodity groups as well as destinations. Both primary products and manufactured goods posted strong growth (Table 6.2 and Appendix Table VI.4). The major sources of increase in primary product exports were ores and minerals, rice and marine products. The increase in the exports of ores and minerals benefited from the recovery in international metals prices. Among the major agricultural commodities, the exports of cereals (rice and wheat) recorded sharp expansion mainly due to world-wide supply shocks caused by severe drought in the USA, Canada and Australia. While the exports of tobacco and marine products made a smart recovery, those of tea and coffee continued to decline. The performance of these export items is being impacted by the process of structural transformation in Indian exports. Over the years, tea and coffee have lost importance in terms of share in India's total exports and India's world market shares. Structural constraints, especially in the case of tea, have also affected exports. In the recent years, the Indian tea industry has been facing depressed prices due to sluggish domestic demand and lower off-takes of orthodox tea by traditional importers. On the other hand, processed items such as vegetables, fruits and juices, floricultural products, meat and meat preparations and marine products have gained importance, drawing from the impetus for diversification in agricultural and trade policies.
6.12 The export expansion in value-added manufactured goods was led by gems and jewellery, engineering goods, chemicals and related products and textiles (Table 6.2). The sharp increase in the exports of gems and jewellery is, inter alia, attributable to pick-up in demand in major markets like the USA, Belgium, Israel and Singapore. These exports also benefited from supportive policy measures such as reduction in value addition norms for exports of plain and mechanised unstudded jewellery, abolition of the licensing regime for rough diamonds and zero customs duty on imports of rough diamonds. Higher exports of engineering goods, emanating mainly from the 'transport equipments' and 'iron and steel' segments, reflected improvements in global demand as also the internationalisation in production processes. In fact, absorption by industrialised countries, notably the USA, Germany and Italy led the expansion in transport equipment exports. In case of iron and steel, export growth was mainly observed in emerging market economies such as Chinese Taipei, Korea, Malaysia, the UAE and Nepal and was associated with improvement in domestic production. Exports of leather and manufactures and carpets, however, declined.
Percentage Variation |
||||
|
|
||||
Commodity Group |
2002-03 P |
2001-02 |
||
|
|
||||
1 |
2 |
3 |
||
|
|
||||
I. |
Primary Products |
16.0 |
0.5 |
|
A. |
Agricultural & Allied Products |
8.7 |
-1.2 |
|
of which : |
||||
1. |
Tea |
-7.0 |
-7.9 |
|
2. |
Coffee |
-12.3 |
-11.5 |
|
3. |
Rice |
66.5 |
3.7 |
|
4. |
Tobacco |
22.5 |
-10.8 |
|
5. |
Marine Products |
11.7 |
-11.3 |
|
B. |
Ores & Minerals |
50.5 |
9.5 |
|
II. |
Manufactured Goods |
14.9 |
-2.8 |
|
of which : |
||||
A. |
Leather and Manufactures |
-6.4 |
-1.8 |
|
B. |
Chemicals and Related Products |
16.2 |
2.8 |
|
C. |
Engineering Goods |
20.6 |
2.0 |
|
D. |
Textiles |
9.3 |
-9.3 |
|
E. |
Gems and Jewellery |
21.2 |
-1.1 |
|
F. |
Handicrafts |
31.3 |
-17.0 |
|
G. |
Carpets |
-2.6 |
-12.3 |
|
III. |
Petroleum Products |
14.3 |
12.0 |
|
IV. |
Others |
168.1 |
-2.7 |
|
Total Exports |
19.2 |
-1.6 |
||
|
|
||||
P |
Provisional. |
|||
Source : DGCI&S. |
||||
6.13 Apart from product diversification, India's export strategy during the past few years has also focused on market diversification with initiatives such as 'Focus Latin American Countries' (launched in November 1997 and extended up to March 2003) and 'Focus Africa' (launched on March 31, 2002). During 2002-03, sizeable growth was recorded in exports to major markets like the USA, the euro area, other developing countries and OPEC. Within the developing country group, the most notable sources of expansion were China (almost doubling of exports) and Singapore (Box VI.6). Exports to the Latin American countries also increased. Within the OPEC group, the main source of expansion was the UAE.
Box VI.6
India's Trade with China
Bilateral trade between India and China resumed officially in 1978. In recent years, trade between the two countries has increased significantly, especially since the signing of the Bilateral Agreement in February 2000 under which China agreed to offer duty concessions on 24 items, mainly relating to agriculture, agro-products and marine commodities. Besides relaxation of banking and insurance norms, the Agreement also covered rationalisation of tariff rate quotas for agricultural products, opening up of the pharmaceutical industry and easing of phyto-sanitary norms to facilitate export of Indian commodities to China. Other major policy initiatives include the signing up of memoranda of understandings (MoUs) in 2000 for setting up a Joint Working Group on Steel and cooperation in the fields of information technology and labour. During the period 1999-2000 to 2002-03, India's exports to China increased at an average rate of 50.2 per cent per annum in US dollar terms while imports from China recorded an annual average growth of 26.6 per cent, far higher than the growth of India's overall exports and imports during the same period. During 2002-03 alone, India's exports to China more than doubled, narrowing the trade deficit with China (Table).
(US $ million) |
|||
|
|
|||
Exports |
Imports |
Trade Balance |
|
|
|
|||
1 |
2 |
3 |
4 |
|
|
|||
1990-91 |
18 |
35 |
-17 |
1998-99 |
427 |
1,097 |
-670 |
1999-00 |
539 |
1,288 |
-749 |
2000-01 |
831 |
1,502 |
-671 |
2001-02 |
952 |
2,036 |
-1,084 |
2002-03 |
1,961 |
2,783 |
-821 |
|
|
|||
Source : DGCI&S. |
|||
The surge in India's exports to China has been marked by a distinct concentration in products involving medium-to-high technology. The major items of exports from India to China have been engineering goods, iron ore, and chemicals and related products. In 2002-03, these three product groups accounted for more than 70 per cent of India's exports to China. As regards imports, electronic goods are emerging as the principal item. This has led to a reduction in the share of the other major imports like chemicals, coal, coke and briquettes (Table).
(Per cent to total exports/imports) |
||||
|
|
||||
Item/Group |
2002-03 |
2001-02 |
2000-01 |
1997-98 |
|
|
||||
1 |
2 |
3 |
4 |
5 |
|
|
||||
Exports |
||||
Engineering Goods |
31.3 |
7.0 |
12.4 |
4.4 |
Iron Ore |
20.4 |
21.7 |
15.6 |
13.6 |
Chemicals and |
||||
Related Products |
19.8 |
32.1 |
29.7 |
10.4 |
Other Ores and Minerals |
6.3 |
11.9 |
8.8 |
6.2 |
Marine Products |
5.4 |
8.9 |
13.9 |
16.0 |
Imports |
||||
Electronic Goods |
27.8 |
18.9 |
16.3 |
9.7 |
Chemicals |
13.3 |
14.8 |
15.2 |
22.1 |
Textile Yarn, Fabrics, |
||||
Made-up Articles |
7.6 |
6.2 |
5.2 |
4.9 |
Coal, Coke and Briquittes |
6.0 |
12.9 |
17.4 |
16.6 |
Medicinal and |
||||
Pharmaceutical Products |
5.2 |
5.2 |
4.7 |
5.9 |
|
|
||||
Source : DGCI&S. |
||||
The recent buoyancy notwithstanding, India still accounts for less than one per cent of China's global trade (0.8 per cent in 2001). Some of the major commodities imported by China such as machinery, minerals and mineral products, iron and steel, organic chemicals, medical and surgical equipment and agricultural products constitute important items of India's export basket. The Chinese market, therefore, offers huge potential to Indian exporters. With China becoming a member of the WTO in December 2001, the opening up of its domestic markets to greater foreign competition and commercial presence offers rich opportunities for Indian exports. There is likely to be an increasing commonality of interests of the two countries within the WTO and other multilateral institutions. However, with the largest export markets of China (namely, the US, Hong Kong, Japan, the European Union and Korea) also being amongst India's key markets for exports, India is likely to face stiff competition from China in overseas export markets for textiles, garments, leather and leather products and light machinery.
A further boost to trade could emanate from the services sector if India and China could share their experiences and core competencies in the field of information technology (software and hardware, respectively) to develop strategies to bridge the digital divide between the two countries and optimising the e-governance systems.
References
- World Trade Organisation, International Trade Statistics, 2002.
- Agarwala, Pradeep and Pravakar Sahoo (2003), 'China's Accession to WTO: Implications for China and India', Economic and Political Weekly, June 21-27.
6.14 Imports rose sharply during 2002-03 with both oil and non-oil components showing substantial increases (Appendix Table VI.3). While the non-oil import growth reflected the pick-up in domestic industrial activity, the sharp increase in oil imports was due to the hardening of international crude prices from US $ 23 per barrel during 2001-02 to US $ 27 per barrel during 2002-03, increase in refinery throughput and stagnant domestic production of crude oil.
6.15 There was a marked decline in imports of gold and silver, mainly attributable to the sharp increase in the international prices and decline in rural demand. Non-oil imports net of gold and silver recorded a sharp growth. Capital goods and export-related items such as pearls and precious stones, raw cashew nuts, textile yarn and fabric were the major sources of the increase. With the pick-up in industrial demand, the imports of capital goods, notably transport equipment, 'electronic goods including computer software' and 'machinery except electrical and electronics' as also of several industrial raw materials such as pulp and waste paper, iron and steel, artificial resins and plastic materials, and medicinal and pharmaceutical products recorded significant expansion. Imports of edible oils rose sharply, reflecting the widening domestic supply-demand gap in the wake of the drought (Table 6.3 and Appendix Table VI. 4).
Percentage Variation |
||
|
|
||
Commodity Group |
2002-03 P |
2001-02 |
|
|
||
1 |
2 |
3 |
|
|
||
Petroleum, Petroleum Products and |
||
Related Material |
26.0 |
-10.5 |
Edible Oil |
33.3 |
3.6 |
Fertilisers |
-13.5 |
-9.7 |
Non-Ferrous Metals |
-0.4 |
21.2 |
Paper, Paperboard and Manufacturing |
||
Including Newsprint |
-1.5 |
-0.9 |
Crude Rubber, including Synthetic |
||
and Reclaimed |
3.8 |
14.8 |
Pulp and Waste Paper |
15.5 |
4.6 |
Metalliferrous Ores and Metal Scrap |
-12.3 |
47.7 |
Iron and Steel |
12.8 |
7.2 |
Capital Goods |
29.0 |
10.5 |
Pearls, Precious and Semi-Precious Stones |
31.0 |
-3.8 |
Textile Yarn, Fabric, etc. |
27.9 |
25.3 |
Cashew Nuts, raw |
181.3 |
-57.0 |
Gold and Silver |
-7.6 |
-1.2 |
Total Imports |
19.2 |
1.7 |
|
|
||
Memo Items |
||
|
|
||
Non-Oil Imports |
16.7 |
7.2 |
Non-Oil Imports excluding Gold & Silver |
20.0 |
8.5 |
|
|
||
P Provisional. |
||
Source: DGCI&S. |
||
6.16 Imports increased from all major regions and country groups with developing countries recording the highest growth. Within the OECD group, imports from the USA, Belgium, France and Germany recorded sharp increases. Amongst developing countries, the Peoples Republic of China, Malaysia and Kenya were the principal sources of imports.
6.17 During the first quarter of 2003-04 (April-June), exports recorded a growth of 11.1 per cent as compared with that of 14.4 per cent during the corresponding period of the previous year. Imports during April-June 2003 increased sharply by 27.0 per cent as compared with 6.7 per cent during April-June 2002. This was mainly on account of non-oil imports which increased by 30.9 per cent as compared with 7.5 per cent in the previous year. As a result, trade deficit during April-June 2003 widened to US $ 4.2 billion from US $ 1.8 billion during the corresponding period of the previous year.
Invisibles
6.18 Since the 1970s, India's invisible exports have provided crucial support to the balance of payments, including through the difficult years of the major oil shocks. In fact, it was the abrupt loss of invisible export markets that, inter alia, exacerbated the external payments crisis of 1990-91. Since then, compositional changes have characterised the rising profile of Indian foreign exchange earnings, indicative of shifts in dynamic comparative advantage towards services. In 2002-03, invisibles shared in the vigorous export expansion, rising to constitute 81 per cent of merchandise exports, i.e., 45 per cent of gross current receipts. The distinct improvement in competitiveness can be gauged from a comparison with 1990-91 when invisibles were only 40 per cent of merchandise exports and less than a third of current receipts (Chart VI.3). Globally, the share of invisibles in current receipts has been broadly stable at around 35 per cent, bringing into sharp focus the competitive edge of India's invisible exports.
6.19 India's invisible earnings are dominated by private transfers (comprising mainly workers' remittances), followed by software and other business services (Table 6.4). Remittances from Indians employed abroad have traditionally been the principal source of invisible earnings. India is the largest recipient of private transfers in the developing world and these amounted to US $ 14.8 billion in 2002-03. India's share in global flows of private transfers is placed at around 3 per cent. The profile of workers' remittances has undergone secular shifts in consonance with the evolution of the world economy. Receipts from indentured labour in Africa and the West Indies gave way to massive labour export earnings from the Middle East in the Gulf boom of the 1970s and 1980s. By the late 1980s, several major labour exporting countries including India had to contend with the fallout of return migration as the Gulf-centred labour export upswing ebbed and moved outwards to Bangladesh and the Philippines. Since the 1990s, the pattern of India's labour exports has shifted away from the Middle East; Western Europe and the USA became the major destinations for Indian workers. Market diversification has been greatly enabled by changes in composition of labour outflows. Lower skill categories are being vacated for white collar and technically specialised employment. About 30 per cent of remittances take the form of local withdrawals from non-resident rupee deposits which are included under private transfers.
(Per cent) |
||
|
|
||
2002-03 |
2001-02 |
|
|
|
||
1 |
2 |
3 |
|
|
||
Transfers |
35.4 |
34.3 |
Software Services |
22.3 |
20.6 |
Non-software Miscellaneous |
21.2 |
20.4 |
Travel |
7.0 |
7.9 |
Transportation |
5.9 |
5.4 |
Income |
6.6 |
9.4 |
Insurance and GNIE |
1.6 |
2.0 |
|
|
||
Memo: |
||
|
|
||
Total Receipts (US $ billion) |
43.0 |
36.7 |
|
|
||
Note: GNIE: Government not included elsewhere. |
||
6.20 Software exports increased by around 27 per cent to US $ 9.6 billion during 2002-03 which is noteworthy in the context of the continuing 'technology slowdown' in the global economy and shedding of new economy stocks in world equity markets. The software industry is undergoing fundamental restructuring through mergers and acquisitions and major software companies are innovating their recruitment strategies for building global delivery capabilities. The resilience acquired by Indian software is attributable to diversification towards new service lines such as package software implementation, systems integration and network management. While banking, financial services and insurance (BFSI), manufacturing and telecommunication remained the main areas of focus, the software industry also expanded into retail business, utilities, telecom service providers and health care during 2002-03. Small and medium enterprises (SMEs) emerged as high performers relative to industry standards. Business process outsourcing (BPO) was the fastest growing segment in software exports, expanding at twice the industry average and contributing a quarter of total software exports. India turned out to be a preferred destination for BPO, notwithstanding barriers in the form of anti-outsourcing laws and visa restrictions. These developments have further strengthened the shift to offshore delivery as part of the business strategy of the software industry in India. The US remained the principal destination of India's software exports (Chart VI.4).
Chart VI.4 : India’s Software Exports

6.21 The category of commercial services comprising travel, transportation, insurance and business services has been experiencing depressed conditions world wide in the aftermath of the terrorist incidents of September 11, 2001. Airlines insurance and tourism industries were particularly affected. According to the WTO, global commercial services expanded by five per cent in 2002. India ranked twenty-first in exports of commercial services with a share of 1.3 per cent in world trade. India's exports of travel services were affected by the generalised adverse conditions following recent events. Tourist arrivals in India remained subdued reflecting fears of terrorism and geo-political insecurity. Transportation receipts benefited from the vigorous growth of merchandise exports. The category of other business services expanded robustly, emerging as the third largest source of invisible earnings. Payments for commercial services increased in consonance with the rising trend evident in recent years in response to the progressive liberalisation of the exchange and payments regime. The growth in travel payments during 2002-03 was on account of both leisure and business travel.
6.22 Under investment income which records the servicing of foreign assets and liabilities, receipts were lower in 2002-03 on account of the declining international interest rates which affected earnings from the deployment of foreign exchange reserves. On the other hand, investment income payments were higher due to profit and dividends (including retained earnings) relative to interest payments which moderated.
Current Account
6.23 The interplay of developments in merchandise and invisible transactions brought compositional shifts into the behaviour of the current account balance in 2002-03. In India, as in many other developing countries, it is the merchandise trade deficit which sets the external financing requirement. A qualitative difference in the Indian experience is the financing support provided by net surpluses in the invisible account, economising on the recourse to external liabilities. Invisibles financed around two-third of the merchandise trade gap during the second half of the 1990s. In 2002-03, as in the preceding year, it is the invisible account which emerged as the principal component, completely covering the trade deficit and driving the current account into surplus (Chart VI.5).
6.24 The movement of the current account into surplus for the second consecutive year in 2002-03 is part of a broader trend emerging out of the crisis of 1990-91 – a conscious policy choice of a moderate current account deficit as an intermediate target for external sector policies. Benefits accruing from the policy change are visible in viability and distinct strength in the balance of payments and international reserves. Superimposed upon the trend is the synchronised downturn across Asia in the wake of financial crisis of 1997-98 to which India was not immune. Adjustment to that shock was reflected in persistent current account surpluses in several Asian countries as import demand was compressed by the downturn (Table 6.5). In India, the current account surplus was associated with a 17.7 per cent growth in current receipts during 2002-03. As a result, the debt service ratio remained one of the lowest after China and Malaysia and the current receipt/current payments ratio showed rising import purchasing power.
(US $ billion) |
|||
|
|
|||
Country/Region |
2001-02 |
1999-2000 |
1995-96 |
|
|
|||
1 |
2 |
3 |
4 |
|
|
|||
Japan |
100.6 |
117.4 |
87.7 |
East Asia (excluding Japan) |
111.4 |
108.8 |
-24.1 |
Euro Area |
21.3 |
-52.4 |
50.5 |
China |
26.4 |
20.8 |
4.4 |
Taiwan, China |
21.8 |
8.6 |
8.3 |
Singapore |
18.3 |
16.2 |
13.7 |
Hong Kong SAR |
12.1 |
8.2 |
-4.1 |
Korea |
7.2 |
18.4 |
-15.8 |
Malaysia |
7.3 |
10.5 |
-6.6 |
Indonesia |
7.1 |
6.9 |
-7.0 |
Thailand |
6.9 |
10.9 |
-14.1 |
Philippines |
4.4 |
8.2 |
-3.0 |
India |
2.5 |
-3.7 |
-5.8 |
USA |
-448.4 |
-351.6 |
-111.8 |
|
|
|||
Note: (-) indicates deficit. |
|||
Source: BIS Quarterly Review, June 2003. |
|||
6.25 It is useful to examine the emergence of surplus in the current account of the balance of payments against the co-movement of the internal macro-balances. The deterioration of the dis-saving of the public sector is more than offset by the improvement in the private sector's saving-investment surplus. This stylised fact suggests that it is the private sector surplus which is spilling over into a current account surplus. It is vital, therefore, to closely monitor the underlying constituents of the current account balance to gauge the strength of the upturn in the business cycle.
Capital Account
6.26 Capital account developments dominated the balance of payments in 2002-03, a phenomenon that was interrupted only once in 1995-96 since the surges of capital inflows began in 1993-94. This is indicative of the sustained international confidence in the strength of the economy, impervious to the downgradings by external credit rating agencies that began during the crisis of 1990-91. Net capital flows were higher in 2002-03 than in any single year so far (Appendix Table VI.2).
6.27 Over this period, there have been significant changes within the capital account, partly in response to policy changes, but also reflecting the patterns of financial flows to emerging market economies. Official assistance, the mainstay of the capital account up to the end of the 1980s, has generally been recording net outflows (net of principal repayment and interest payments) since 1995-96. Outflows increased in 2002-03 consequent upon the prepayment of multilateral debt - US $ 1.34 billion to Asian Development Bank and US $ 1.68 billion to the World Bank. Prepayments of high cost commercial debt were also put into effect by corporates. Net outflows rose in 2002-03 as corporates turned to domestic financial markets for their financing requirements. The appetite for external commercial borrowing has remained weak since 1998-99 in the context of the slowdown in industrial activity. Thus, the long and medium term debt component of the capital account contracted in 2002-03, extending a phase of consolidation of external debt that has dominated external sector management since the adjustment to the crisis of 1990-91. Short-term debt flows increased to finance the higher order of POL imports (Table 6.6).
(US $ million) |
|||
|
|
|||
2002-03 |
2001-02 |
||
|
|
|||
1 |
2 |
3 |
|
|
|
|||
Foreign Direct Investment |
3,611 |
4,741 |
|
In India |
4,660 |
6,131 |
|
Abroad |
-1,049 |
-1,390 |
|
Portfolio Investment |
944 |
1,951 |
|
In India |
979 |
2,020 |
|
Abroad |
-35 |
-69 |
|
External Assistance |
-2,460 |
1,117 |
|
External Commercial Borrowing |
-1,698 |
-1,576 |
|
Short-term Trade Credits |
979 |
-891 |
|
Non-resident (NRI) Deposits |
2,808* |
2,754 |
|
Banking Capital (excluding NRI deposits) |
5,435 |
2,838 |
|
Other Capital Flows |
3,019 |
-361 |
|
Total Capital Flows |
12,638 |
10,573 |
|
|
|
|||
* |
Provisional |
||
6.28 Net inflows under non-resident deposits, another important element in debt flows, underwent compositional changes in 2002-03. There was a sharp increase in balances under the repatriable rupee-denominated external rupee accounts [NR(E)RA] as maturing balances of the discontinued non-repatriable rupee deposits [NR(NR)RD] poured into the repatriable scheme. Taken together, the net inflows into these rupee deposits were broadly stable during the year (Table 6.7). Lower net inflows under the foreign-currency denominated FCNR(B) scheme could be attributed to better exchange rate adjusted return on the competing rupee deposits.
(US $ million) |
||||||
|
|
||||||
Schemes |
Outstanding (end March) |
Net Inflows@ |
||||
2003 P |
2002 |
2002-03 P |
2001-02 |
|||
|
|
||||||
1 |
2 |
3 |
4 |
5 |
||
|
|
||||||
1. |
FCNR(B) |
10,193 |
9,673 |
520 |
594 |
|
2. |
NR(E)RA |
14,716 |
8,449 |
5,987 |
1,626 |
|
3. |
NR(NR)RD |
3,449 |
7,052 |
-3,704 |
508 |
|
Total |
28,358 |
25,174 |
2,803 |
2,728 |
||
|
|
||||||
@ |
All figures are inclusive of accrued interest and valuation changes arising on account of fluctuations in non-dollar currencies against US dollar. |
|||||
P |
Provisional |
|||||
Note : Variations do not match with the differences between the out- standing stocks for rupee deposits on account of exchange rate fluctuations during the year. |
||||||
External Debt
6.29 India's total external debt increased by US $ 5.5 billion over the year, from US $ 98.8 billion at the end of March 2002 to US $ 104.2 billion at the end of March 2003 (Chart VI.6 and Appendix Table VI.10). This increase has taken place despite the prepayment by the Government of high-cost foreign currency loans amounting to US $ 3,030 million to the Asian Development Bank and the World Bank during the last quarter of 2002-03. The increase in external debt was mainly due to an increase in non-resident Indian (NRI) deposits of US $ 6.8 billion and in bilateral debt, mainly concessional, of US $ 1.5 billion. Total concessional debt has increased by US $ 3.1 billion. The recorded increase in NRI deposits is partly of a technical nature because of the shifting of hitherto non-repatriable rupee accounts [NR(NR)RD accounts] to repatriable accounts. Non-repatriable rupee deposits are excluded from the external debt statistics. The Union budget of 2002-03 announced the discontinuation of NRI non-repatriable rupee deposit schemes and allowed the shifting of balances on maturity from such accounts to the account holders' NRE accounts (repatriable). The actual net increase of NRI deposits during 2002-03 was US $ 2.8 billion, which was of similar order as witnessed during the previous year.
6.30 Bilateral and multilateral debt constituted about 45 per cent of the debt stock (Appendix Table VI.10). The Government of India has decided to discontinue receiving aid from bilateral partners other than Japan, the UK, Germany, the USA, EC and the Russian Federation and it will prepay bilateral debt amounting to Rs.7,491 crore (US $ 1.6 billion) to partners other than Japan, Germany, the USA and France. Concessionality and long maturity associated with this component impacts favourably on the overall stock of debt in terms of the cost of servicing. External commercial borrowings (21.3 per cent) and long-term non-resident deposits (22.5 per cent) are the other principal components of external debt.
6.31 Key indicators of debt sustainability suggest continuing consolidation and improvement in solvency. The external debt-GDP ratio declined during the year to 20.0 per cent and proportion of short-term debt to total debt increased to 3.9 per cent at end-March 2003 from 2.8 per cent at end-March 2002. At 14.7 per cent, the debt service ratio continued to remain low in 2002-03. The marginal increase in debt service and liability service ratios during 2002-03 was due to pre-payments of official debt in the last quarter (Table 6.8).
(US $ million) |
|||||
|
|
|||||
2002-03 |
2001-02 |
2000-01 |
|||
|
|
|||||
1 |
2 |
3 |
4 |
||
|
|
|||||
1. |
External Assistance @ |
6,308 |
3,240 |
3,706 |
|
2. |
External Commercial Borrowing * |
5,988 |
5,997 |
7,665 |
|
3. |
IMF # |
0 |
0 |
26 |
|
4. |
NRI Deposits (Interest Payments) |
1,268 |
1,555 |
1,659 |
|
5. |
Rupee Debt Service |
474 |
519 |
617 |
|
6. |
Total Debt Servicing |
14,038 |
11,311 |
13,673 |
|
7. |
Total Current Receipts ** |
95,627 |
81,220 |
79,342 |
|
8. |
Debt Service Ratio (6/7) (per cent) |
14.7 |
13.9 |
17.2 |
|
9. |
Interest Payments to Current |
||||
Receipts Ratio (per cent) |
4.1 |
5.4 |
6.6 |
||
10. |
Debt to Current Receipts |
||||
Ratio (per cent) |
109.0 |
121.6 |
127.5 |
||
11. |
Liability Service Ratio (per cent) |
15.7 |
14.9 |
18.4 |
|
|
|
|||||
@ |
Inclusive of non-Government account. |
||||
* |
Inclusive of interest on medium, long-term and short-term credits. |
||||
# |
Excluding charges on net cumulative allocation. |
||||
** |
Excluding Official Transfers. |
||||
Note: |
1. Debt service payments in this table follow accrual method may, therefore, vary from those recorded on cash basis. |
||||
2. Liability service ratio represents debt service payments and remittances of profits and dividends taken together as a ratio of total current receipts. |
|||||
Foreign Investment
6.32 A striking feature of the movements in the capital account since the 1990s has been the rising prominence of foreign investment, reflecting a policy-preferred hierarchy in capital inflows as part of the consolidation of debt. Foreign investment flows rose to a peak in 1996-97 with the debt/equity ratio falling to as low as 0.2 in 2001-02. Weak stock markets pulled down foreign investment flows, both direct and portfolio, during 2002-03. Amounts raised through GDRs/ADRs were maintained. In view of bringing the foreign direct investment (FDI) compilation of India in line with international best practices, coverage of data on FDI has been expanded from 2000-01 by including certain new items, viz., equity capital of unincorporated bodies, reinvested earnings and inter-corporate debt transactions between the related entities. Accordingly, FDI in India stood at US $ 6.1 billion in 2001-02 and US $ 4.7 billion in 2002-03 (Table 6.9). The decline in FDI in 2002-03 was on account of fall in inflows through SIA/FIPB route, mainly in electronics, electrical and service sectors.
(US $ million) |
|||||||
|
|
|||||||
2002-03(P) |
2001-02 (R) |
2000-01(R) |
|||||
|
|
|||||||
1 |
2 |
3 |
4 |
||||
|
|
|||||||
A. |
Direct Investment (I+II+III) |
4,660 |
6,131 |
4,029 |
|||
I. |
Equity (a+b+c+d+e) |
2,700 |
4,095 |
2,400 |
|||
a) |
Government (SIA/ FIPB) |
919 |
2,221 |
1,456 |
|||
b) |
RBI |
739 |
767 |
454 |
|||
c) |
NRI |
– |
35 |
67 |
|||
d) |
Acquisition of shares * |
916 |
881 |
362 |
|||
e) |
Equity capital of |
||||||
unincorporated bodies |
126 |
191 |
61 |
||||
II. |
Re-invested earnings |
1,498 |
1,646 |
1,350 |
|||
III. |
Other capital $ |
462 |
390 |
279 |
|||
B. |
Portfolio Investment (a+b+c) |
979 |
2,021 |
2,760 |
|||
a) |
GDRs / ADRs # |
600 |
477 |
831 |
|||
b) |
FIIs @ |
377 |
1,505 |
1,847 |
|||
c) |
Off-shore funds and others |
2 |
39 |
82 |
|||
C. |
Total (A+B) |
5,639 |
8,152 |
6,789 |
|||
|
|
|||||||
P |
Provisional. R Revised. |
||||||
* |
Relates to acquisition of shares of Indian companies by non-residents under Section 5 of FEMA, 1999. |
||||||
# |
Represents the amount raised by Indian corporates through Global Depository Receipts (GDRs) and American Depository Receipts (ADRs). |
||||||
@ |
Represents net inflow of funds by Foreign Institutional Investors (FIIs). |
||||||
$ |
Data pertain to inter company debt transactions of FDI entities. |
||||||
Note: |
1. |
The coverage of foreign direct investment inflows has been widened since 2000-01 to approach the international best practices. FDI data since 2000-01 include, besides equity capital, ‘reinvested earnings’ (retained earnings of FDI companies) and ‘other direct capital’ (inter- corporate debt transactions between related entities). Data on reinvested earnings for 2002-03 are estimated as average of the previous two years. Data on FDI since 2000-01, therefore, are not comparable with FDI data for previous years. |
|||||
2. |
Data on foreign investment presented here represent inflows into the country and may not tally with the data presented in other tables, which include direct imports against foreign investment, Indian investment abroad as well as disinvestments. They also differ from data relating to net investment in stock exchanges by FIIs in Section V of this Report. |
||||||
6.33 Companies registered in Mauritius and the USA were the principal source of FDI in India during 2002-03 in line with the trend during the 1990s. The bulk of FDI was channelled into 'services', 'computers (hardware and software)' and 'engineering industries' (Table 6.10).
6.34 Capital flows in 2002-03 were driven by large movements in banking capital, reflecting repatriation of assets held abroad in response to exchange rate expectations and interest differentials (Appendix Table VI.2 and Chart VI.4). With the progressive liberalisation of the capital account, cross-border assets and liabilities of banks have assumed importance from the point of view of systemic stability. These comprise (i) assets and liabilities vis-a-vis nonresidents and (ii) assets and liabilities of resident banks (both domestic and foreign) operating in India vis-a-vis residents in foreign currencies. The major components of banks' international assets and liabilities are loans and deposits, debt securities, equity shares, participation and working capital. Thus, banking flows include several elements which do not form a part of the country's external debt. On a remaining maturity basis, international assets of banks located in India were broadly unchanged in 2002 as the increase in foreign currency loans to residents was almost offset by a decline in nostro balances from June 2002 onwards reflecting banks preference for domestic assets. There was an increase of the international liabilities of banks, mainly on account of non-resident deposits. The sharp rise in NRE balances reflected the switch from the maturing balances of the discontinued NR(NR)RD scheme (Table 6.11). International assets and liabilities were predominantly US dollar denominated. The USA was the dominant destination for the banks' international assets as well as the major source of liabilities. Almost two-thirds of liabilities were of maturities up to six months. International banks were the major creditors, followed by the non-bank private sector.
INTERNATIONAL INVESTMENT POSITION
6.35 The International Investment Position (IIP) is a summary record of stocks of external financial assets and liabilities of the country and has a more comprehensive coverage than the external debt statistics which are restricted to only those external liabilities which have a contractual obligation to service (Box VI.7). Elements like foreign investment and banking capital excluding non-repatriable rupee deposits, which are external liabilities in the ultimate sense are incorporated under the IIP. Segregation under the Reserve Bank, the banking sector, Government sector and the other sector including corporates enables an assessment of sectoral movements in foreign assets and liabilities.
6.36 Information available up to March, 2002 indicate a distinct improvement in India's net international investment position over the period 1997-2002 on account of a decline of about US $ 13 billion in net foreign liabilities due to the build up of foreign exchange assets by the Reserve Bank. Of the gross foreign liabilities, loans were the dominant component, closely followed by portfolio investment and direct investment in India, and currency and deposits. Other liabilities like trade credits (excluding suppliers credit up to 180 days), debit balances of nostro accounts and credit balances of vostro accounts were relatively small. Foreign exchange reserves were the predominant component of gross international assets (Table 6.12).
(US $ million) |
|||||
|
|
|||||
Item |
March 2002P |
March 2001P |
March 1997 |
||
|
|
|||||
1 |
2 |
3 |
4 |
||
|
|
|||||
A. |
Assets |
||||
1. |
Direct investment abroad |
3,763 |
2,616 |
617 |
|
2. |
Portfolio investment |
493 |
498 |
282 |
|
2.1 Equity securities |
185 |
270 |
172 |
||
2.2 Debt securities |
308 |
228 |
110 |
||
3. |
Other investments |
15,279 |
17,316 |
11,156 |
|
3.1 Trade credits |
728 |
922 |
973 |
||
3.2 Loans |
1,989 |
1,768 |
548 |
||
3.3 Currency and deposits |
9,049 |
10,873 |
5,287 |
||
3.4 Other assets |
3,512 |
3,752 |
4,348 |
||
4. |
Reserve assets |
54,715 |
42,897 |
26,714 |
|
Total Foreign Assets |
74,250 |
63,327 |
38,769 |
||
B. |
Liabilities |
||||
1. |
Direct investment in India |
23,690 |
20,053 |
10,630 |
|
2. |
Portfolio investment |
31,650 |
31,376 |
18,743 |
|
2.1 Equity securities |
18,723 |
17,493 |
13,631 |
||
2.2 Debt securities |
12,927 |
13,883 |
5,113 |
||
3. |
Other investments |
85,476 |
86,986 |
89,388 |
|
3.1 Trade credits |
3,819 |
4,877 |
5,698 |
||
3.2 Loans |
62,846 |
63,993 |
67,743 |
||
3.3 Currency and deposits |
18,508 |
17,807 |
15,300 |
||
3.4 Other liabilities |
303 |
309 |
646 |
||
Total Foreign Liabilities |
1,40,816 |
1,38,415 |
1,18,762 |
||
Net Foreign liabilities (B-A) |
66,566 |
75,088 |
79,992 |
||
Net Foreign liabilities |
|||||
(as per cent to GDP) |
14.1 |
16.7 |
21.0 |
||
|
|
|||||
P |
Provisional. |
||||
Note: |
Data are partially revised based on extended coverage of FDI data and revised external debt information for 2001 and 2002 only. Data may undergo changes depending on the availability of information on extended coverage of FDI data for previous years and also to availability of latest information from other sources. |
||||
6.37 Overall surpluses have appeared in the balance of payments since 1993-94 (except in 1995-96). This has been reflected in growing accretions to the foreign exchange reserves. The accretion during 2002-03, the highest in any single year, was almost entirely in the form of foreign currency assets with small valuation gains booked under gold holdings (Table 6.13). The major sources of accretion to foreign currency assets were the current account surplus and inflows in the form of foreign investment, banking capital and non-resident deposits. Valuation gains due to cross currency movement in exchange rates amounted to US $ 3.8 billion.
(US $ million) |
||||||
|
|
||||||
Year |
Gold |
SDRs |
Foreign |
Total |
Reserve |
Outstanding |
Currency |
Position in |
Use of the |
||||
Assets |
the Fund |
IMF Credit |
||||
|
|
||||||
1 |
2 |
3 |
4 |
5 |
6 |
7 |
|
|
||||||
March 1993 |
3,380 |
18 |
6,434 |
9,832 |
296 |
4,799 |
March 1994 |
4,078 |
108 |
15,068 |
19,254 |
299 |
5,040 |
March 1995 |
4,370 |
7 |
20,809 |
25,186 |
331 |
4,300 |
March 1996 |
4,561 |
82 |
17,044 |
21,687 |
310 |
2,374 |
March 1997 |
4,054 |
2 |
22,367 |
26,423 |
291 |
1,313 |
March 1998 |
3,391 |
1 |
25,975 |
29,367 |
283 |
664 |
March 1999 |
2,960 |
8 |
29,522 |
32,490 |
663 |
287 |
March 2000 |
2,974 |
4 |
35,058 |
38,036 |
658 |
26 |
March 2001 |
2,725 |
2 |
39,554 |
42,281 |
616 |
0 |
March 2002 |
3,047 |
10 |
51,049 |
54,106 |
610 |
0 |
March 2003 |
3,534 |
4 |
71,890 |
75,428 |
672 |
0 |
June 2003 |
3,698 |
1 |
78,546 |
82,245 |
976 |
0 |
|
|
||||||
6.38 The Reserve Bank’s operations in the forward market during 2002-03 extinguished existing outstanding forward liabilities and resulted in creation of forward assets (Chart VI.7).

6.39 On August 15, 2003 India held the sixth largest stock of international reserve assets among emerging market economies at US $ 85.4 billion. In terms of foreign currency assets alone, the dominant component of the reserves (other standard constituents are gold and Special Drawing Rights (SDRs)), India ranked seventh in the world with an accretion of US $ 10.0 billion over the end-March 2003 level. Recognition of the growing strength of the reserves has been reflected in the International Monetary Fund (IMF) designating India as a creditor country under its Financial Transaction Plan (FTP). India participated in the IMF's financial support to Burundi in March-May, 2003 and to Brazil in June 2003. Since 2001, India has been among a select group of countries which subscribed to the IMF's data template under its Special Data Dissemination Standard (SDDS) to provide information on key parameters which determine the content and quality of the management of foreign exchange reserves.
Reserve Management Operations
6.40 The Reserve Bank draws its empowerment as the custodian of the country's foreign exchange reserves from the Reserve Bank of India Act 1934. Section 17 of the Act authorises the Reserve Bank to buy and sell foreign exchange, bullion and securities issued by foreign governments, and to hold deposits/investments in foreign central banks, banks incorporated abroad, or multilateral banking entities. These provisions also define the scope of investment of external assets. Stringent restrictions are placed on the credit quality of counter-parties/securities. Broadly, the eligible investment categories include deposits with other central banks and the Bank for International Settlements (BIS), deposits with foreign commercial banks, debt instruments representing sovereign/sovereign-guaranteed liability and other instruments/institutions as approved by the Central Board of the Reserve Bank.
6.41 The broad strategy for reserve management, including currency composition and investment policy, is decided in consultation with the Ministry of Finance, Government of India from time to time. Reserve management encompasses preservation of the long-term value of reserves and the need to minimise risk and volatility in returns consistent with the primary objectives of safety and liquidity. Reserve management strategies are continuously reviewed in terms of currency composition, duration and instruments. A periodical Management Information System (MIS) report ensures that the Reserve Bank's management is kept informed about shifts in the composition of reserves.
6.42 Movements in the foreign currency reserves occur mainly out of purchases and sales of foreign exchange by the Reserve Bank in the market, including a small volume of transactions in the forward segment. In addition, there is income from deployment of foreign exchange assets held in the portfolio of the Reserve Bank. In line with international trends, the Reserve Bank follows the practice of expressing the foreign exchange reserves in US dollar terms which implies that the movement of the US dollar would influence its share in the composition of reserves. It may be mentioned that the precise currency composition of reserves is generally not released by most countries including India, as per prevailing international practice. This is because short-term variations in reserves held in different currencies by central banks are regarded as being market sensitive.
6.43 Decisions involving the pattern of investments are driven by the broad parameters of portfolio management with a strong bias for capital preservation and liquidity. All of the foreign currency assets are invested in assets of the highest quality with a significant proportion convertible into cash at short notice. There are explicit constraints on the portfolio such as limits on various securities, currencies, counter-parties and sovereigns. The counter-parties with whom deals are conducted are subject to a rigorous selection process, taking into account their international reputation and track record, apart from factors such as size, capital, rating, financial position and efficiency of operations. Counter parties could be banks, subsidiaries of banks or security houses. Investments in securities are restricted to sovereign and sovereign guaranteed instruments with residual maturity not exceeding 10 years. The reserves are also invested in money market instruments, including deposits with the best international commercial banks.
6.44 Internationally, reserve management is conducted by dividing the reserves portfolio into 'tranches', viz., liquidity tranche and investment tranche, according to the objectives of policy requirements. The Reserve Bank has two broad portfolios with independent risk parameters, viz., the money market portfolio and the bonds portfolio. The money market portfolio comprises instruments with maturity of less than one year and it is predominantly guided by transaction and intervention needs. The money market portfolio has a lower duration and runs a lower market risk in relation to interest rate movements. In contrast, the bonds portfolio consists of long-term holdings of triple-A rated instruments issued by sovereigns and supra-nationals.
Management of Gold Reserves
6.45 The Reserve Bank of India has a modest gold holding of 357 tonnes, of which 65 tonnes (18.2 per cent of total gold holdings) are held abroad. Holdings of gold have remained virtually unchanged and gold reserves are managed passively. As part of the response to the balance of payments crisis of 1990-91, loans were raised against the collateral of gold from the Bank of Japan and Bank of England. On repayment of the loans in November 1991, the gold was placed as deposits with Bank of England and the BIS, the latter on a specific request as it does not normally accept gold deposits. The gold deposits earn a modest return.
6.46 The status of gold as a reserve asset is under increasing scrutiny in recent years. Gold continues to be a low yielding asset in comparison with a majority of other financial assets. Nevertheless, it is potentially an avenue for diversification of the portfolio. The 1990-91 crisis demonstrated the importance of gold as an asset of the 'last resort' and this warrants an active stance for management of gold reserves.
Risk Management
6.47 The overall approach to reserve deployment is one of high risk aversion with a preference for stable returns. Sound internal control systems are in place to identify, measure, monitor and control various types of risks encountered in the conduct of reserve management.
- Credit risk arising out of potential default or delay in payment of obligations is addressed by investing only in financial instruments issued by sovereigns as well as banks and supra-nationals conforming to a minimum rating of AAA. Placement of deposits with the BIS is also considered credit risk-free. Deposits with commercial banks as also transactions in foreign exchange and bonds/treasury bills with commercial banks/security firms are subjected to stringent credit criteria for selection of approved counter-parties; limits are also fixed for each category. Ratings given by international rating agencies as also various other financial parameters are considered before grading and fixing limits for each counter-party. The day-today developments in respect of the counter-parties are closely monitored with a view to identifying credit quality under potential threat.
Accordingly, credit limits are pruned down or these counter-parties are delisted altogether, if considered necessary.
- The foreign currency reserves are invested in multi-currency multi-market portfolios. Decisions are taken regarding the exposure to different currencies, depending on the likely currency movements and other medium-term considerations such as the need for maintaining a major portion of the reserves in the intervention currency, maintaining the approximate currency profile of the reserves in alignment with the external trade invoicing profile, and the benefits from diversification of currency risk.
- The interest rate sensitivity of the reserves portfolio is identified in terms of benchmark duration and the permitted deviation around the benchmark. The emphasis is to keep the duration short in order to remain risk averse. The benchmark duration and the leeway for deviation are suitably altered, keeping in view the market dynamics. A benchmark is specified for each portfolio to evaluate performance. It is derived on the basis of risk tolerance levels accepted and set by the Management of the Reserve Bank.
- The choice of instruments determines the liquidity of the portfolio. While bonds and treasury bills of AAA rated sovereigns are highly liquid, BIS Fixbis/ Discount fixbis can be liquidated at any time to meet liquidity needs. Exercises are undertaken to test the liquidity at risk (LaR) of the various constituents of the reserves.
- Internally, there is a total separation of the front office and back office functions and the internal control systems ensure several checks at the stages of deal capture, deal processing and settlement. The middle office is responsible for risk measurement and monitoring, performance monitoring and concurrent audit. The deal processing and settlement system is also subject to internal control guidelines based on the principle of one point data entry and powers are delegated for generation of payment instructions. Codes of conduct are prescribed for dealers to ensure a high degree of integrity.
- A major portion of the securities are custodised with the central banks, mainly the US Federal Reserve, the Bank of England and the Bank of Japan. All primary cash accounts are with foreign central banks. The BIS provides both custodial and investment services for investments placed with it. A small portion of other securities and assets managed by external asset managers are custodised with carefully selected global custodians. The custodial arrangements are reviewed from time to time and the developments relating to the custodians are tracked regularly to ensure that the risk is kept to the minimum.
Audit and Monitoring
6.48 There is a system of concurrent audit for monitoring compliance in respect of all the internal control guidelines, independent of the process flows. Furthermore, reconciliation of nostro accounts is undertaken on a daily basis in respect of major currencies. In addition to annual inspection by the Inspection Department of the Reserve Bank and statutory audit by external auditors, a special external auditor is appointed to audit dealing room transactions. The main objective of the special audit is to ensure the adherence to risk management systems and internal control guidelines.
External Asset Managers
6.49 A small portion of the reserves is assigned to external asset managers with the objectives of gaining access to and deriving benefit from their market research. This also helps to take advantage of the technology available with asset managers and to provide training/exposure to the Reserve Bank's own dealers. The asset managers are carefully selected from among internationally reputed asset management companies. They are given clear investment guidelines and benchmarks and their performance is evaluated at periodic intervals by a separate unit within the middle office. External asset managers' views and outlook on international bond and currency markets are examined and taken as inputs for operational functioning.
Reserve Management and the Reserve Bank's Balance Sheet
6.50 Foreign currency assets are held as assets in the Issue Department (foreign securities) as well as in the Banking Department (balances held abroad and investment). Gold is also held in the Issue Department (under Gold coin and bullion) and in the Banking Department as well. Although SDRs form part of India's official reserves, these are held by the Government of India and are not reflected in the Reserve Bank's balance sheet.
6.51 Key accounting practices in the management of reserves are: (i) all realised as well as accrued but unrealised interest/discount incomes are taken to the revenue account with the exception of penal interest and dividend which are accounted for on receipt basis; (ii) all realised gain/loss on foreign exchange and securities transactions are also taken to the revenue account; (iii) unrealised gains/losses on currency and gold revaluation are taken to the Currency and Gold Revaluation Account (CGRA); (iv) unrealised losses on bonds revaluation are taken to the revenue account as direct deduction from interest income; and (v) outstanding forward positions are revalued and net losses, if any, are charged to profit and loss account.
6.52 In the case of bonds/securities held as part of the foreign currency assets, revaluation is undertaken every month on the basis of the month-end market prices. The principle of 'lower of market or book value' is followed i.e., if the market value is lower than the book value, the holdings are written down to the market value and valuation is not altered subsequently even if the market value increases. The income from the foreign exchange reserves is combined with other incomes of the Reserve Bank.
Transparency Issues
6.53 International reserve holdings are subjected to the best standards of public disclosure. The policy on reserve management is articulated through a semi-annual Monetary and Credit Policy Statement. The Annual Report of the Reserve Bank provides a perspective on developments during the year. Movements in foreign exchange reserves are reported weekly in the Weekly Statistical Supplement (WSS) to the Reserve Bank's monthly Bulletin. The Reserve Bank's purchases and sales in the foreign exchange market along with outstanding forward positions are published on a monthly frequency in the Bulletin. Information on a number of parameters including deployment of foreign exchange reserves and the forward position is provided under the IMF's SDDS at the websites of the IMF and the Reserve Bank.
Costs of Holding Reserves
6.54 The accumulation of foreign exchange reserves represents the Reserve Bank's policy of maintaining an adequate level of foreign exchange reserves to meet import requirements, unforeseen contingencies, and 'liquidity risks' associated with different types of capital flows. The reserves at this level serve the basic objectives of maintaining confidence in monetary and exchange rate policies, enhancing the capacity to intervene and limit volatility and providing confidence to the markets (Chart VI.8).
6.55 The substantial growth in reserves in the recent period has generated a debate regarding the costs and benefits of holding reserves. For developing countries, sharp exchange rate movements can be highly disequilibrating and costly for the economy during periods of uncertainty. The costs of financial crisis are deleterious in terms of loss of GDP and welfare. These economic costs are likely to be substantially higher than the net financial cost of holding reserves which are typically measured in terms of the difference between the opportunity cost of deploying reserves in domestic assets and the rate of return earned on the actual deployment of foreign currency assets. The increase in reserves in the recent period is through net purchases by the Reserve Bank in the domestic foreign exchange market. An equivalent amount of domestic currency has been sold to counter-parties who have the freedom to invest them in domestic assets and reap the rupee-denominated return. The accretion to reserves in the recent period has occurred without increasing the overall level of external debt and instead through higher workers' remittances, quicker repatriation of export proceeds and non-debt inflows. Even after taking into account foreign currency denominated non-resident deposit flows (where the interest rates are linked to LIBOR), the financial cost of additional reserve accretion in India in the recent period is quite low, and is likely to be more than offset by the return on additional reserves.
6.56 In any cost-benefit analysis of holding reserves, it is essential to keep in view the objectives of holding reserves, which, inter alia, cover: (a) maintaining confidence in monetary and exchange rate policies; (b) enhancing the capacity to intervene in foreign exchange markets; (c) limiting external vulnerability so as to absorb shocks during times of crisis; (d) providing confidence to the markets that external obligations can always be met; (e) adding to the comfort of the market participants, by demonstrating the backing of domestic currency by external assets; and (e) reducing volatility in foreign exchange markets.
6.57 In the recent period, the overall approach to the management of India's foreign exchange reserves is judiciously built upon a host of identifiable factors and other contingencies. Such factors, inter alia, include: the size of the current account deficit; the size of short-term liabilities (including current repayment obligations on long-term loans); the possible variability in portfolio investments and other types of capital flows; the unanticipated pressures on the balance of payments arising out of external shocks and movements in the repatriable foreign currency deposits of non-resident Indians. A sufficiently high level of reserves is necessary to ensure that even if there is prolonged uncertainty, reserves can cover the 'liquidity at risk' on all accounts over a fairly long period. Furthermore, the quantum of reserves in the long-run should be in line with the growth in the economy and the size of risk-adjusted capital flows, which provides greater security against unfavourable or unanticipated developments, which can occur quite suddenly.
6.58 India was one of the 20 countries selected for a case study in a recent document published by the International Monetary Fund as a supplement to the IMF's 'Guidelines for Foreign Exchange Reserve Management'. The IMF has observed that India's management of foreign exchange reserves has generally been in accordance with IMF guidelines and is comparable to the global best practices in this area. In line with global developments, in the recent period, India's reserve management operations have become more transparent. The emphasis is on efficient management of reserves. In areas like greater and more efficient use of information technology, use of sophisticated risk management techniques like Value at Risk (VaR), determination of optimal currency composition, sound management of credit and market risks and the internal governance structure, India's policies are comparable with international best practices.

हे पेज शेअर करा:


भारतीय रिझर्व्ह बँक मोबाईल ॲप्लिकेशन इंस्टॉल करा आणि नवीनतम बातम्यांचा त्वरित ॲक्सेस मिळवा!


