 IST,
IST,


Measurement of Inflation In India : Issues and Associated Challenges For The Conduct of Monetary Policy
G V Nadhanael and Sitikantha Pattanaik* Ambiguity in inflation assessment resulting from deficiencies in data on prices could pose significant challenges for the conduct of monetary policy. In India, in view of the large divergence between CPI and WPI inflation trends in the past, wide dispersion in inflation across commodity groups within WPI, and significant volatility in headline WPI inflation under the influence of supply shocks, the statistical limitations of prices data have received increasing attention in the policy debates. This paper presents the key issues in the current context, while also explaining how policy analyses relevant for the conduct of monetary policy could yield ambiguous results if inflation data used in such analyses have serious limitations. A comparison of the WPI inflation against the GDP deflator suggests that both track each other almost perfectly, which may lead one to draw the wrong inference that the usual arguments against WPI in terms of non-inclusion of services and non-revision of the index to capture the structural changes in the economy are not very relevant. This paper highlights the scope for possible misleading inferences due to data deficiencies and also suggests the areas where improvements in data collection and dissemination may serve the monetary policy needs of India better in future. Key Words : Inflation Measurement, Monetary policy and Inflation Introduction A representative measure of inflation is the most important component of the information set that a central bank could use to design and conduct its policies aimed at ensuring “low inflation and stable prices”. Even with a robust anti-inflationary policy framework and commitment, in the absence of appropriately measured data on inflation, what monetary policy may actually achieve could become difficult to assess. In the Indian context, the extent of past divergence between WPI and CPI inflation as well as the large volatility in WPI inflation because of sharp swings in oil and food prices have raised significant curiosity about the measure of inflation that the Reserve Bank uses for the conduct of its policies and the relevance of the Reserve Bank’s approach, when there is so much uncertainty about the goal variable itself. If information on the ultimate goal variable of monetary policy leaves ambiguity, then addressing the statistical issues assumes critical policy significance. Most of the economic analyses that are used in the process of the making of monetary policy could also remain suboptimal and even turn misleading if the price data create confusion, adding to uncertainty. Such analyses include forward looking assessment of inflation outlook with reference to past trends in the actual inflation data, estimation of policy rule co-efficients, estimation of money demand in relation to inflation and growth, the analysis of pass-through to domestic prices from changes in exchange rates, international oil prices and global inflation, and even computing the data relating to Real Effective Exchange Rate (REER) for assessment of external competitiveness. Against this background, Section II of the paper documents the usual deficiencies in inflation data which have been experienced in other countries, both advanced and developing. The data limitations in the India specific context are discussed in Section III, while also explaining which measures of inflation the Reserve Bank uses for the conduct of its policies, given the data constraints. Some of the recent initiatives and plans for addressing the data limitations in the near to medium-term are discussed in Section IV. The available data on inflation have been examined in relation to suggestions for improvement in Section V, with an emphasis on how the suggestion could enhance the usefulness of the prices data for the purposes of monetary analysis. The final section presents the concluding observations. Section I
Measurement of inflation for the conduct of monetary policy has been a challenge in almost every country, which is also one of the reasons behind the ambiguity prevailing about the “price stability” objective pursued by the central banks. Highlighting the measurement related issues in the US, Bernanke (2008) had noted that “... inflation itself can pose real-time measurement challenges. We have multiple measures of inflation, each of which reflects different coverage, methods of construction, and seasonality and each of which is subject to statistical noise arising from sampling, imputation of certain prices and temporary or special factors affecting certain markets. From these measures and other information, policy makers attempt to infer the true underlying rate of inflation.” The complexity for the conduct of monetary policy may not arise only from the availability of an appropriate price index. As noted by Meyer (1998), “... the data trickles in with a lag, often involves considerable noise, and is subject to revision, even after which it may remain less precise than we would prefer. Because of the noise in economic measures, considerable effort is needed to extract the meaningful signal from the data.” Highlighting similar challenges in India, particularly in the context of high and growing divergence between WPI and CPI inflation rates in 2009, Subbarao (2009) noted that “...Such divergences in alternative inflation measures complicate the conduct of monetary policy in India. Accordingly, the Reserve Bank looks at all the measures of inflation, both overall and disaggregated components, in conjunction with other economic and financial indicators, to assess the underlying inflationary pressures.” Besides the challenges arising from measurement of inflation, the other important ambiguity has been the precise definition of “price stability” for the conduct of monetary policy. While several central banks like the Federal Reserve of the US and the Reserve Bank of India do not define price stability in terms of a point estimate of inflation rate, several inflation targeting countries and also the ECB define price stability as a precise rate of inflation, which though is not free from interpretations of analysts about their appropriateness (Cecchetti and Wayne, 2003). According to Greenspan (2001) “... For all these conceptual uncertainties and measurement problems, a specific numerical inflation target would represent an unhelpful and false precision. Rather, price stability is best thought of as an environment in which inflation is so low and stable over time that it does not materially enter into the decisions of households and firms.” The ECB Governing Council, in turn, adopted a quantitative definition of price stability i.e., “... price stability is defined as a year on year increase in the Harmonised Index of Consumer Prices (HICP) for the Euro Area of below 2 per cent”. (The ECB aims at maintaining inflation rates below but close to 2 per cent over the medium-term). In India as stated by Subbarao (2009), “price stability, defined as low and stable inflation, is a key objective of our monetary policy.” Even though the Reserve Bank’s monetary policy statement of October 2009 noted that the “the conduct of monetary policy will continue to condition and contain perception of inflation in the range of 4.0- 4.5 per cent... in line with the medium-term objective of 3.0 per cent”, the concept of price stability remains qualitative. The qualitative interpretation of price stability, generally refers to a low and stable inflation “that ceases to be a factor in the decision of households and businesses” (Cecchetti and Wayne, 2003). Any inflation rate, that is higher than the rate consistent with the concept of price stability, thus, could entail costs, which would increase with spikes in both inflation rate and volatility. Price stability is one of the key objectives of every central bank, whether stated explicitly and targeted through inflation targeting or stated implicitly and pursued through alternative monetary policy frameworks. In the literature, one could come across different reasons cited as to why a central bank should focus on price stability as its key objective. A stable and low inflation could keep the nominal interest rates at lower levels without much volatility. This, in turn, could keep the real interest rate stable, thereby promoting investment and economic growth. Thus, pursuing the objective of price stability in itself can lead to economic growth. Another major reason why a central bank should focus on inflation control is that inflation distorts scarcity signals in relative price movements (Hill 2004). Microeconomic factors like the presence of menu costs may induce the agents not to adjust prices, which could lead to greater relative price variability along with high inflation levels. This, in turn, may send incorrect signals about relative scarcity and can in turn lead to misallocation of resources in investments. Current inflation levels have an impact on the inflation expectations of the agents, as expectations are partly formed on the basis of adaptive behaviour. It has been acknowledged that high levels of inflation are usually associated with higher inflation expectations (Bernanke and Mishkin 1997, Akerlof et al 1996). As inflation expectations influence wage bargaining, a high current level of inflation usually entails the possibility of a wage-price spiral. When inflation is driven by supply side factors, because of the risks to inflation expectations, central banks at times may be guided by the need to firmly anchor inflation expectations rather than by the well known apprehensions about the effectiveness of monetary policy to address the supply side sources of inflation. Therefore, having a low and stable inflation at the current period becomes all the more important for the conduct of monetary policy. Moreover, the strong redistributive effects of high inflation in a developing country cannot be ignored while balancing the weights between supporting growth and containing inflation. It has been argued that in countries where high growth accentuates inequality and does not lead to corresponding fall in poverty, the emphasis of monetary policy should be primarily on containment of inflation, even at the cost of sacrificing some growth. Why Right Measurement is the First Step to an Appropriate Policy Response? Inflation is a source of uncertainty that complicates long range investment planning and it often encourages speculative investment as opposed to productive investment. Inflation could also alter inflation perceptions and thereby affect real consumption and investment decisions. As pointed out by Frale and Mortenson (2008), despite a measured increase of household purchasing power by 3.5 per cent in France in 2007, more than two third of the French citizens felt their purchasing power to have declined. Fully anticipated inflation could have two clear costs; i.e., the “shoe-leather” costs and the “menu costs”. The first type of costs are on account of the need for downsizing money balances (whose values erode because of inflation), and the second one relates to the need for relabeling of prices by the suppliers. The more significant cost of inflation, however, results from the institutional and contractual arrangements (which could be disturbed by even moderate inflation). The four such costs, as pointed out by Edey (1994) could be: (a) interactions between inflation and taxation i.e., non-indexation of income tax scales which could increase the tax burden at higher inflation, (b) price uncertainty caused by inflation and the tendency to disrupt long-term contracts (most of which are non-indexed) also distort relative price changes (i.e., the practical difficulty faced in distinguishing relative price changes from absolute price changes), (c) adverse effect on growth through decline in capital accumulation, and (d) others, such as distributional effects in emerging market economies with large population; one of the major risks of inflation (particularly food inflation) could be in terms of worsening the poverty and inequality scenario. Economic Analysis of Monetary Policy with Limitations in Prices Data The making of monetary policy has to often use analyses of macroeconomic and macro-financial linkages as important inputs for designing the actual policy stance. Measurement problems and other limitations in prices data could yield biased and misleading empirical estimates. Some of the very standard and often debated relationships are highlighted here to stress the risk to policy from weak inflation data. 1. Money Demand : Money, Output and Prices Relationship. Despite the growing de-emphasis on money on account of the instability in the money demand functions in response to financial innovations, the relationship between money, output and prices continues to be a critical input for the formulation of monetary policy. After the global financial crisis, money and credit growth and the underlying factors driving their growth have received greater policy focus, because of the realisation that low inflation and high growth -the preferred outcome for monetary policy- should not be a source of comfort in the assessment and management of money. Money and credit growth, despite low inflation, could entail risks to financial stability and also contribute to asset price bubbles. Money demand analysis, therefore, may still be useful for policy purposes, notwithstanding the challenge of instability in the relationship. The starting point for any conventional money demand function could typically be the following representation of the relationship:
It may be noted that inadequately measured inflation data in such estimates could not only distort assessment of monetary policy actions in relation to policy goals, but also complicate conduct of monetary policy in terms of assigning policy rates to containment of inflation in relation to threshold/ targeted inflation objective. 3. Transmission of Monetary Policy While a large part of the current debate in India has centred around transmission of policy rates into lending rate, the key empirical input for policy purposes relates to transmission from policy action to ultimate policy goals in the form of impact on inflation and output. While use of any price series in a structural VAR could show the transmission lag and the extent of impact on inflation in response to a policy shock, depending on the price data used the results could vary. In structural models studying the transmission process through simulations in response to policy shocks could also yield varied results depending upon the price data used for estimation. 4. Expectations Augmented Philips Curve As per this relationship, which is commonly monitored for policy making, inflation is studied as a function of output gap and expected inflation.
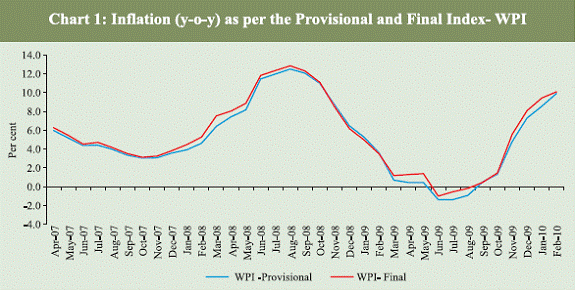
5. Pass-through of Exchange Rate Changes to Domestic Prices and the Assessment of Real Undervaluation/ overvaluation of the Exchange Rate In the assessment of inflation, central banks may often see exchange rate as one of the key determinants of the inflation process, since the prices of imported goods and services sold in the domestic market could change with movements in the level of the exchange rate. Moreover, the authorities may also monitor the trends in Real Effective Exchange Rate (REER) to assess the changing external competitiveness of the country arising from the dual effects of changes in the exchange rate and domestic inflation (in relation to inflation of trading partners). If the domestic inflation data used for such analyses/estimates have limitations, that would spillover to the estimates of pass-through effects and REER. Inflation Measurement Challenges : An ideal price index used for the conduct of monetary policy may be expected to satisfy two major criteria. First, it should track the purchasing power of the average consumer in the economy (Diewert, 1998). Second, it should broadly capture the movement of general prices in the economy with significant level of accuracy and should also be internationally comparable. The issue of comparability of inflation indicators across countries has gained importance in recent years on account of the increased integration of economies. The great moderation in global inflation before the surge in oil prices in 2007-08 had a salubrious impact on inflation in most of the countries. Most central banks in the developed as well as developing world make use of Consumer Price Index (CPI) as the target for their monetary policy even though some of the central banks do monitor other price indices viz., producer price index (PPI) and gross domestic product (GDP) deflator. The major reasons why CPI is used by most countries are that CPIs directly represent the consumption basket of the public at large and usually CPIs are also used in many countries as the measure for indexing public sector wages and pensions and as the standard benchmark for wage negotiations in the private sector. Since maximisation of consumer welfare is the primary goal of low inflation objective, CPI has been used as the reference index by most central banks around the world for their policies. Measurement Issues The measurement related issues in inflation could be broadly two fold : First, measurement of inflation using a particular index (the issues in this category include the representativeness of the index of overall price movements, ability to capture the changing dynamics of the economy in terms of structural transformation and so on). The second set of issues relates to how the central bank should measure/target inflation, given a set of constructed price indices. These include issues like what measure of inflation should be used (annual or month over month), how to deal with seasonality in prices and volatility. While the first set of issues mostly relates to the measurement of price index the second set of issues broadly addresses the question of inflation measurement. In this paper these issues are discussed separately. Measurement Issues in Price Indices A price index is a measure of the proportionate or percentage changes in a set of prices over time (ILO, 2004). Economic literature on price indices is concerned with three basic questions viz., what set of prices should be covered in the index; what is the most appropriate way in which to average their movements; and how accurately any given price index captures the movements in general price level? The major measurement issues in price indices on account of the above questions are discussed below. Coverage The first major issue with regard to a price index is the coverage. There are two major approaches to determine the coverage of a price index. The first approach follows the procedure of defining a geographical area for which the prices are measured. The area could be either based on geographical boundary (nation or state) or a region (rural/urban). Here, the price index reflects the movement of prices in an area without reference to any target population. The second approach is to define a target population along with the area for measuring the price index. In this case, the target area along with the target population is defined. For wholesale prices, usually the first approach is followed, whereas for consumer prices the second approach is followed. Assigning Weights Aggregation of prices for constructing an index is the next major issue. The weights for constructing any index have to be derived from the relative shares of the products. The changes in the composition of consumption as well as the structure of the economy over time make it difficult to have fixed weights for different products over time. This issue, in turn, leads to other issues in the construction of the overall index from the collected price data. Most countries use the Laspeyers formula for constructing price indices, which uses the weights based on the respective shares in the base year. Recognising the need for incorporating the changes in the relative importance of different products in the price index, many countries have shifted to chain based index calculation or adopted a practice of regular periodic changes of the base year. Accuracy of the Price Index How accurately the price index captures the movements in general price level is the next key issue in the measurement of price indices. Edey (1994), Diewert (1998) and Hill (2004) identified the major sources of bias that could enter into measurement of any price indices, with special reference to consumer price index. These are: Product substitution bias Most price indices are based on a fixed weight (Laspeyers Index with base period weights or Pasche Index with current period weights) and do not take into account the impact of product substitution within the production/ consumption basket. Consumers may substitute some products whose relative prices have increased over time with some other goods whose relative prices have fallen, in order to maintain the same level of utility. Therefore, fixed weight based price indices tend to either overestimate or underestimate the true cost of living. Quality bias Quality change arises when a firm produces/provides a new improved version of a product/service. Frequently there is no overlap between the two versions. That is, the old version is discontinued as soon as the new version appears. Nevertheless, statistical agencies try to splice the two price series together, often without making any adjustment for improved quality which leads to a bias. To avoid this, hedonic estimation methods are used by many countries to account for changes in quality. Boskin (1996) report estimated that in the US the inflation is upwardly biased by 60 basis points on account of the quality changes in products. New goods bias New goods introduce an upward bias into the measurement of inflation for two reasons. First, when a new good appears in the market, it would take some time for the good to be represented in the basket of commodities in the price index. Second, introduction of a new good in itself represents a price fall. Hicks (1940) argued that we should view the price in the period before a new good is introduced as the minimum price at which demand is zero. This price is referred to as the reservation price. Therefore, when a new good first appears, we can interpret its price as falling from the reservation price to its initial selling price. This reservation price can be estimated econometrically. Outlet substitution bias If there are substantial price differences between different outlets, consumers tend to substitute those outlets with higher price by lower price outlets. If the collection of price data is based on fixed number of outlets, which is not changed frequently, the consumer price index thus constructed may overestimate/ underestimate inflation. For estimating the outlet substitution bias the difference in quality across different outlets need to be controlled. The other major issue with regard to the measurement of price indices is how to account for seasonality of different products. Certain products enter the market only in a few seasons/months and are absent for the rest of the year. This could make the comparison of prices across different months difficult. Annex I illustrates how the measurement issues are addressed in different countries. Section II In India, there are five major national indices for measuring price levels. The Wholesale Price Index (base 1993-94) is usually considered as the headline inflation indicator in India. Apart from WPI, four different consumer price indices covering different sections of the labour force viz., industrial workers (IW) (base 2001), urban non-manual employees (UNME) (base 1984-85), agricultural labourer (AL) (base 1986-87) and rural labourer (RL) (base 1986-87) are also available. Also, the GDP deflator as an indicator of inflation is available for the economy as a whole and its different sectors, on a quarterly basis. Wholesale Price Index (WPI) The Wholesale Price Index is the most widely used inflation indicator in India. This is published by the Office of Economic Adviser, Ministry of Commerce and Industry. The current series of Wholesale Price Index has 1993-94 as the base year and 435 commodities (98 primary articles, 19 articles under the fuel group and 318 articles under the manufacturing products). Presently, two indices (monthly and weekly) are released regularly. On a weekly basis, the price indices for primary articles and fuel group are published. On a monthly basis, overall index including the manufacturing products are released1. The index is available with a time lag of 2 weeks and the provisional figures get revised after 8 weeks. A major limitation of the WPI is that the concept of wholesale price is not clearly defined. As noted by the National Statistical Commission (2001), “…owing to the wide variety of sources, centres, and specifications and due to the practical compulsion of collecting data by the voluntary method, it is difficult to maintain uniformity in the concept of wholesale price in the collection of price data. In many cases, these prices correspond to farm-gate, factory-gate or mine-head prices; and in many other cases they refer to prices at the level of primary markets, secondary markets or other wholesale or retail markets”. Again, the current WPI does not include services which now form the majority share of national income (i.e., 64.9 per cent in 2009-10). The current base year (1993-94) for WPI is outdated and does not capture the structural transformation that has occurred in the economy over more than 15 years. The provisional figures released initially undergo substantial revision subsequently, which makes it all the more complex for use in the conduct of monetary policy. The recent experience, however, shows that the extent of divergence has not been significant, reaching a maximum of 1.1 percentage points during the period April 2007 to February 2010 (Chart 1). Consumer Price Indices (CPIs) At present, there are four major consumer price indices available in India. These relate to four different segments of workers viz., Industrial workers (IW), agricultural labourers (AL), rural labourers (RL) and urban non- manual employees (UNME). The salient features of the major consumer price indices are given in Table 1.
The four different consumer price indices cater to different sections of the working class and, hence, they cannot be considered as the representative measures of nation-wide inflation. As it could be seen from Table-1, the base years for different consumer prices are different and except for the industrial workers, the base years are quite outdated. Also, there exists considerable time lag in the publication of price information (minimum of 21 days). GDP Deflator Based Inflation GDP deflator, which is measured as the ratio of GDP at current prices to GDP at constant prices also provides information on the trends in the general price level. At present, the GDP deflator is available for the economy as a whole and the major sub-sectors. GDP deflator is considered as one of the most representative indicators of economy-wide inflation as it includes all transactions within the economy. The information on GDP deflator, however, is available with a time lag of more than two months, making it less useful for monetary policy purposes.
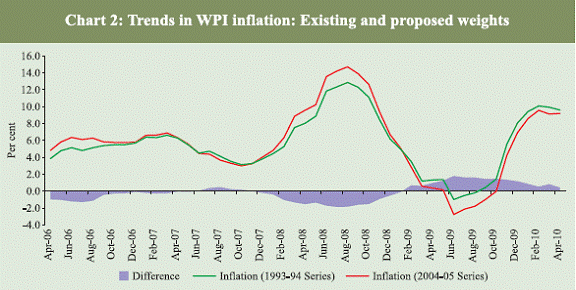
Section III Recognising the need for revising the methodology of prices data in India, a number of initiatives have been undertaken to address the inflation measurement concerns. Different committees/working groups have been set up to suggest improvements in the existing system of data collection and dissemination of price statistics. National Statistical Commission, 2001 The National Statistical Commission set up under the chairmanship of Dr. C Rangarajan was entrusted with the task of reviewing the entire statistical system of the country, of which price statistics formed an important part. The committee had a detailed review of all the major price indices available and pointed out a number of deficiencies in the existing system of price collection. The major deficiencies that were pointed out by the Commission in the case of WPI are divergent connotations of the concept of wholesale price, inability to capture the changes in quality of products, and shifts in the structure of the economy, non-inclusion of Services Sector, and weak price data collection mechanism; accordingly the WPI was viewed as an inadequate measure of inflation. In the case of CPIs, the major lacunae identified by the Commission are no uniformity in the base year, lags in updation, non-coverage of the entire population, non-representation of certain geographical areas, besides issues relating to sample selection. The Commission had also raised the issue of nonavailability of regional price data. The major recommendations of the Commission were the following : As the current CPI data do not provide changes in the prices for the entire rural and urban population (since they are designed to measure the changes in the prices of goods and services consumed by specific segments of the population), it was proposed that there is a need to compile the CPI separately for the entire rural and urban populations. It was recommended that it should be mandatory on the Labour Bureau and the CSO to revise their price series preferably every five years, but not later than ten years, using the quinquennial NSS Consumer Expenditure Survey data. It was also recommended that there is a need to bring uniformity of methodology in the computation of price indices compiled by the States and UTs so that meaningful analysis of regional price variations could be made. To capture the changes in the economic structure, it was recommended to have periodic revisions of WPI numbers, preferably every five years but not later than ten years. The committee suggested that a separate Services Sector Index should be developed, initially as a complement to the WPI and should be merged with the WPI, once it stabilises and after conducting appropriate tests of robustness. Overall, the Commission concluded that WPI is an inadequate measure of inflation; there is a need for a separate index for measurement of inflation in the economy. The proposed CPI for the rural and urban areas could be used for this purpose. In line with the recommendations of the Commission, the Central Statistical Organisation (CSO) has taken up the work for generating data on CPI (Urban) and CPI (Rural). The weighting diagram for CPI (U) and CPI (R) has been derived using the results of the 61st round Consumer Expenditure Survey conducted during 2004-05 and the Technical Advisory Committee (TAC) on SPCL (Statistics on Prices and Cost of Living) has proposed to fix 2009 as the base year for both CPI (Urban) and CPI (Rural). The Government has also constituted an Expert Group under the chairmanship of Prof. C.P. Chandrasekhar to look into the possibility of constructing a Service Price Index. Working Group for Revision of Wholesale Price Index Numbers (Base 1993-94) A Working Group for the revision of the current series of the Wholesale Price Index Numbers (Base: 1993-94=100) was constituted under the Chairmanship of Prof. Abhijit Sen, in December, 2003. The Working Group examined the current status of WPI compilation in India and made a number of recommendations to improve the compilation of WPI. The Working Group submitted its report to the Government in May 2008. The Major recommendations of the Working Group are: • Shifting the base year for the new series of WPI from 1993-94 to 2004-05. • Changing the frequency of WPI series to monthly from the weekly system, as it would enhance the quality and reliability of estimates. However, there is a scope for generating a weekly commodity index for primary commodities and fuel group for monitoring the prices, without adversely affecting the integrity of price data. Internally, to generate a preliminary weekly WPI for the manufacturing sector for price level monitoring purposes of the Reserve Bank and the Ministry of Finance. • The universe of WPI will now be defined as all transactions at first point of sale in domestic market, instead of the erstwhile definition of all transactions carried out by the residents of the country in the domestic market. • The use of PDS prices for rice and wheat would be discontinued in the revised series, as PDS prices are relevant only at the retail level. • Instead of following the method of selecting all products with a traded value of Rs 120 crore and above (for the basket), the new series will include all products, which together cover at least 80 per cent of the traded value at NIC 2-digit group level. • The coverage of products has been increased with the number of commodities covered increasing from 435 to 1224. The number of primary articles would increase from 98 to 105 and manufacturing items from 318 to 1,100, while the number of products in “fuel and power” category would remain unchanged at 19. The committee also noted that the actual number of commodities included in the new series would depend on the availability of price data. • Since the unorganised sector accounts for about 35 per cent of the manufacturing sector output, 309 products produced by the unorganised sector would also be covered in the new series subject to data availability. • In the case of manufacturing products, the price data would be obtained separately for basic price and the central excise duty. • Setting up of separate committees for monitoring the flow of price data from manufacturing units, construction of Producer Price Index, integration of Service Price Index numbers with the proposed Producer Price Index and framing a permanent institutional mechanism for collection of price data for WPI. The recommendations of the Working Group have already been started to be implemented. From the month of October 2009, WPI data are released on a monthly basis along with the weekly release of price indices for primary articles and the fuel group. The recommendation on collection of weekly data on manufacturing inflation for internal use of the Reserve Bank, however, is yet to be implemented. Data collection for the new series of WPI with base year 2004-05 is already underway and this series would include items from the unorganised sector. Section IV : Impact of Non-updation of Base Year on Inflation Measurement in India In order to assess the extent to which the non-updation of the base year of WPI could alter the measurement of inflation, this paper estimated the inflation path based on the weights of the new series (Base 2004-05) as proposed by the Technical Report. The methodology adopted is as follows. In essence, for the purpose of estimation, weights from the recommendations of the working group have been applied to the index available for the current series on prices at the sub group levels. The comparative weightage pattern shows that the weights of primary articles would decline while that of manufactured products and fuel group would increase (Table 2). Using the new weights, the inflation rates based on WPI have been worked out as presented in Chart 2. It could be observed that the change of weight from 1993-94 to 2004-05 does not significantly alter the trends in overall inflation. It may, however, be noted that inflation based on the new weights exhibit greater volatility than the existing series. This could be on account of the fact that during the first half of 2008-09 fuel and metal prices (which have higher weights in the constructed index) increased substantially on account of the sharp increases in global prices and declined sharply during the second half. Minerals oils and metals together account for an increase in weight of 4.8 per cent in the new series (Table 2). Thus, the two broad groups, which have shown greater volatility, explain the higher inflation as per the new weights. In recent months, the inflation as measured by the existing series is higher than the new (constructed) series based inflation, which could be attributed to higher prices of primary food articles that have higher weights in the existing series.
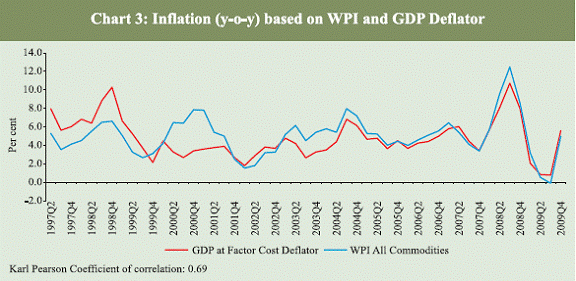
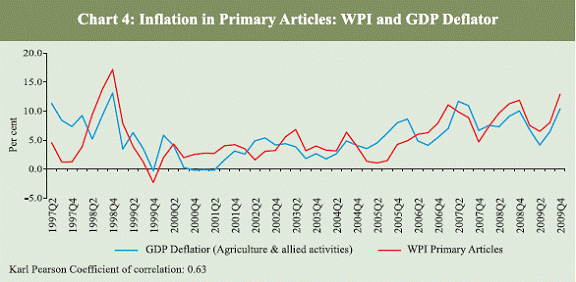
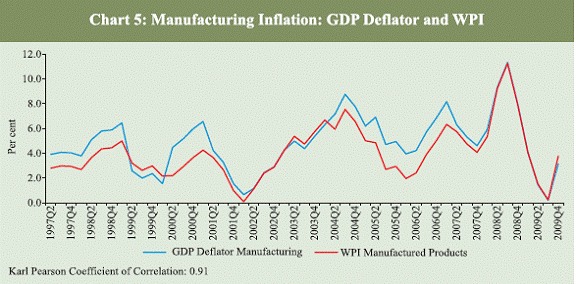
Comparative Movement of Different Inflation Indicators in India As the trends in general price level over time should be captured by any representative index, one may expect the different measures of inflation to converge to similar trends over a reasonably long period of time. The analysis presented here uses quarterly GDP deflator data and the WPI inflation since 1997, primarly on account of non- availability of quarterly data on GDP for the previous period. The trends in overall WPI based inflation along with GDP deflator based inflation are given in Chart-3. The trends in WPI inflation and GDP deflator based inflation indicate that the two measures co-move most of the time, with occasional divergence though, which is also corroborated by a strong correlation co-efficient between the two (0.69). It is also important to note that the co-movement of both the measures is much stronger during the high volatility period of inflation being witnessed since the second half of 2007-08. For better insight into the inflation process at sub-sectoral levels, the inflation in primary articles of WPI against the GDP deflator from agriculture and allied activities as well as manufactured products inflation in WPI against the GDP deflator from manufactured products have been compared (Chart 4 and 5).
Both the sub sectors exhibit significant co-movement. The correlation, however, was found to be much stronger in the case of manufactured products inflation.
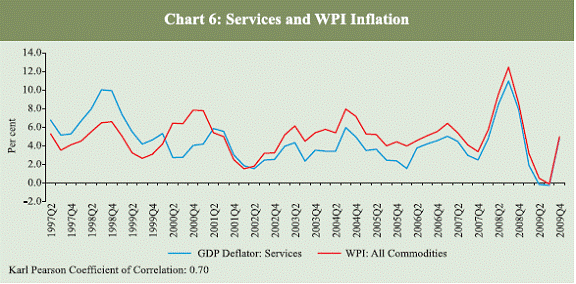
One of the often highlighted limitations of WPI as a measure of the general level of inflation is that is does not include services. A comparison of the overall WPI inflation in relation to the GDP deflator for services sector could provide some indication as to whether WPI captures some movement of inflation in services (Chart-6). As is evident from the chart, the services inflation as measured by the GDP deflator tend to co-move with the overall WPI inflation. It could be seen that since 2001 both the series have almost moved in identical manner.
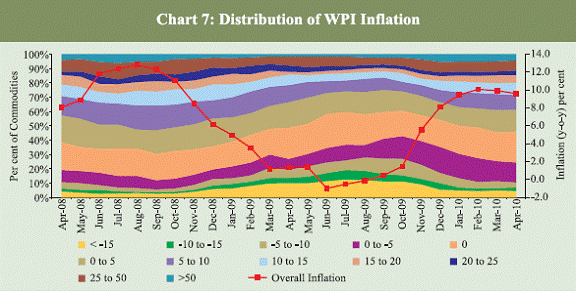
The above findings, to a large extent, may seem to support the use of WPI as the representative and appropriate measure of inflation, because: (a) WPI inflation exhibits similar trends as the GDP deflator, (b) the extent of divergence in recent years could be viewed as insignificant in relation to the large divergence between CPI and WPI inflation, and (c) the WPI inflation even approximates the deflator for services sector GDP. Most importantly, these trends suggests that the perceived limitations of the WPI, particularly non-inclusion of services in the basket and no periodic adjustments to capture the structural changes in the economy, are not very serious. Hence, use of WPI inflation as the headline inflation for policy purposes could be appropriate. It is possible, however, that for certain services (particularly in the unorganised sectors) WPI itself is used for generating GDP data at current prices. Hence, the initiatives for improving the price data, both in terms of covering services and capturing changes in economic structure, assume critical significance. Large Dispersion in Inflation within WPI While the overall index of WPI could suggest the headline inflation at any point of time, when the distribution of inflation across commodities within the overall WPI basket shows large dispersion, an assessment about the generalised inflation conditions becomes difficult. At times, few items with low aggregate weights could explain a major part of the headline inflation (Chart 7). The distribution of inflation in India across commodities suggests that besides the overall inflation as per the index, it may be necessary to examine inflation trends in specific components to be able to explain the role of demand versus supply side and domestic versus external sources of pressures on the headline inflation. Which Measure of Inflation for Monetary Policy? For the purpose of explicit/implicit targeting of the inflation objective there is a debate on which measure of inflation to use and the broad options include, “year on year changes in price indices”, “seasonally adjusted month over month changes”, or targeting the “core component” of inflation i.e., eliminating the volatile components from headline inflation. This paper examines which of these measures could be appropriate for monetary policy purposes in India.
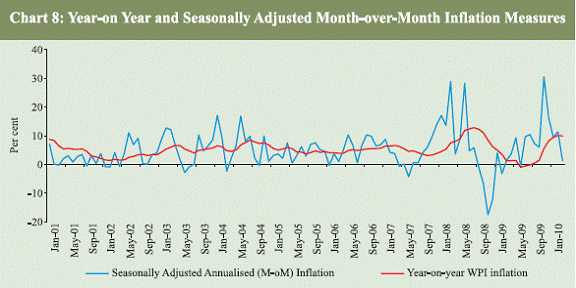
Year-on-year Inflation versus Month-over-month (m-o-m) Seasonally Adjusted Inflation. It has been argued that the year-on-year inflation does not give a clear picture of the price pressures present in the economy at any particular point of time as changes in inflation rates can also be affected by the changes in price in the previous year (commonly referred to as the base effect). Alternatively, suggestions have been made (Bhattacharya et al 2008) that monetary policy should look at the month-over-month changes in de-seasonalised index as the early warnings of emergence of inflationary pressures or abating of inflation from a high inflation period. The estimated annualised month-over-month seasonally adjusted (using the X-12 ARIMA method suggested by US Census Bureau) inflation have been plotted against year on year inflation figures in Chart 8.
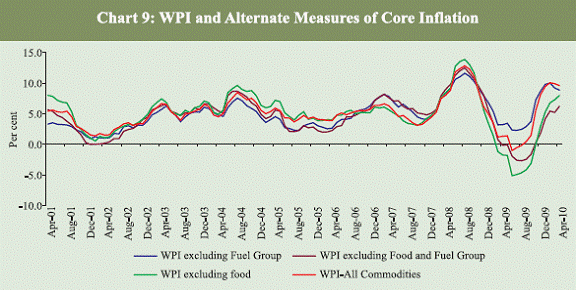
It is quite evident that the annualised month-over-month seasonally adjusted WPI inflation is much more volatile than the year-on year measure of inflation. The coefficient of variation of m-o-m seasonally adjusted inflation is 132.2 for the period January 2001 to November 2009 whereas it is 51.0 for the year-on-year inflation. This sharp volatility in m-o-m seasonally adjusted inflation makes it less useful for the conduct of monetary policy as a key target variable. It may, however, have to be noted that the levels of m-o-m seasonally adjusted inflation could give useful indication on the inflation/ disinflation momentum, as it is free from the base effect. Core Inflation In the context of repeated and significant supply side pressures on Indian headline inflation in last two years (2008-10), there has been a perception that with the use of core inflation, monetary policy could be better communicated in terms of what it could do to contain inflation. The paper estimated the different contextual measures of core inflation based on WPI (excluding food, excluding fuel and excluding food and fuel) as presented in Chart 9. It is evident that the contextual core inflation measures do not significantly reduce the overall volatility in inflation. Moreover, in the India specific context, food and fuel inflation affects the common man, and in reality, any measure of inflation targeted for policy purposes must be relevant to the consumers at large. Use of a core concept of inflation to explain the effectiveness of monetary policy could not serve the purpose of attaining the policy goals relating to inflation, which must include both food and fuel in view of the large percentage of disposable income of the population at large being spent on these two items.
In India, statistical challenges relating to prices data for the conduct of monetary policy have come to the forefront of policy debate in view of the record levels of divergence between CPI and WPI inflation and spikes in inflation in essential commodities within the WPI. Recognising the challenge, while the Reserve Bank has used all array of available information on prices for its overall assessment of the inflation conditions, it continues to present its inflation outlook in terms of WPI. This paper shows that WPI inflation perfectly tracks GDP deflator, both at the aggregate level and sectoral levels. One may wrongly conclude from this that the obvious limitations of WPI, i.e., non-inclusion of services and non-revision of the index in alignment with the changing structure of the economy, are not very important. Taking into account the major recommendations of various committees on improving prices statistics in India, and the initiatives already undertaken to address the limitations in the current data, it could be possible over time to switch over to use of a representative measure of CPI as the reference index for policy purposes. Given the general practice adopted in other countries, and also the usual emphasis of price stability objective in enhancing consumer welfare, availability of data on CPI-Urban and CPI-Rural, and some form of aggregation of the two that could yield a representative CPI for the country as a whole over time, would address a major data gap in India from the standpoint of use of relevant inputs for the conduct of monetary policy. Limitations in prices data entail the risk of adding noise to economic analysis and econometric estimates, which in turn, could complicate policy making. This paper highlights that the Indian inflation path has been significantly conditioned by two major supply shocks, i.e., oil and food. Even the exclusion of these two items, representing the most conventional measure of core inflation, does not impart greater stability to the inflation path. Also, such exclusion makes the core measure much less representative, since the common man is primarily affected by food and fuel inflation. In this context, addressing the statistical issues relating to weights and coverage consistent with the changing economic structure assumes importance. This paper also shows that year-onyear inflation has been much less volatile than sequential month over month (seasonally adjusted) inflation, suggesting the relevance of the former for conduct of monetary policy. The distribution of inflation across commodities at any point of time shows large dispersion, and the assessment of generalised inflation, given the large dispersion, could also complicate decision making relating to use of monetary policy actions to contain overall inflation. While different prices data covering specific segments of the population/regions of the country are necessary to assess their economic conditions in relation to developments taking place at the aggregate level in the economy, for the conduct of monetary policy, however, a single representative measure of inflation that could be available with limited time lag may have to be aimed at over time. Current initiatives like updating the base in WPI and collection of new data on CPI-Urban and CPI-Rural as well suggestions for constructing services price series are steps that could be expected to facilitate convergence to a single measure of inflation over time that would be more suitable for use in the conduct of monetary policy. References Akerlof G A, W.R Dickens and G.L Perry (1996), “The Macroeconomics of Low Inflation” available at http://www.brookings.edu/press/Journals/1996/ bpea961.aspx. Bernanke Ben S and Frederic S. Mishkin (1997), “Inflation Targeting: A New Framework for Monetary Policy?”, NBER Working Papers 5893, National Bureau of Economic Research. Bernanke. Ben.S (2008), “Outstanding Issues in the Analysis of Inflation”, Speech at Federal Reserve Bank of Boston’s 52nd Annual Economic Conference, Chatham, Massachusetts, June 9. Bhattacharya. R, Ila Patnaik, Ajay Shah (2008), “Early warnings of inflation in India”, Working Paper 2008-54, National Institute of Public Finance and Policy New Delhi, August. Cecchetti S G. and Wayne, (2003), “Inflation Targeting, Price-Path Targeting and Output Variability,” NBER Working Papers 9672, National Bureau of Economic Research. Diewert, W.E. (1998), “Index number Issues in the Consumer Price Index”, Journal of Economic Perspetives, Vol.12, No.1. Edey, Malcom (1994), “Costs and Benefits of Moving From Low Inflation to Price Stability”, OECD Economic Studies No.23 Winter. Frale. C. and J. Mortenson (2008), “The Challenge of Measuring Inflation, when Business is not as usual”, CEPS Working Document No.306. Government of India (2001), “Report of the National Statistical Commission, 2001” available at http://www.mospi.nic.in/nscr/hp.htm. Government of India (2008), “The Technical Report of the Working Group for Revision of Wholesale Price Index Numbers (Base: 1993-94)” available at http:/ /eaindustry.nic.in/new_repout.htm. Greenspan, Allen (2001), “Transparency in Monetary Policy” remarks at the Federal Reserve Bank of St. Louis, Economic Policy Conference, 11 October. Hicks, J.R (1940), “The Valuation of the Social Income”, Economica, Vol. 7, pp 105–124. Hill, Robert. J (2004), “Inflation Measurement for Central Bankers,” RBA Annual Conference Volume, in: Christopher Kent & Simon Guttmann (ed.), The Future of Inflation Targeting, Reserve Bank of Australia. ILO (2004), “Consumer Price Index Manual: Theory and Practice”, International Labour Organisation, Geneva. Meyer, Laurence H (1998), “The Strategy of Monetary Policy” The Alan R. Holmes Lecture, Middlebury College, Middlebury, Vermont, March 16. OECD (2009), “Consumer price indices - Data and Methods” available at http:// stats.oecd.org/mei/default.asp?lang=e&subject=8. Reserve Bank of India (2009), “Annual Report, 2008-09” Reserve Bank of India, Mumbai. Subbarao, D. (2009), “Inaugural address, Annual Statistics Day Conference”, Mumbai, July 2, 2009. * The authors are Research Officer and Director, respectively, in the Department of Economic Analysis and Policy, Reserve Bank of India. An earlier version of this paper was presented at the Conference of Indian Association for Research in National Income and Wealth (IARNIW) at the Centre for Development Studies (CDS), Thiruvananthapuram, January 8-9, 2010. The paper reflects the personal views of the authors. 1 The WPI index for all commodities was available on a weekly basis and was discontinued from October 2009. This has increased the information gap for monetary policy, since the overall inflation data are available on a monthly basis as opposed to weekly earlier. |
|||||||||||||||||||||||||||||||||||||||||||||||||||||||||||

भारतीय रिझर्व्ह बँक मोबाईल ॲप्लिकेशन इंस्टॉल करा आणि नवीनतम बातम्यांचा त्वरित ॲक्सेस मिळवा!
आमचे अॅप इंस्टॉल करण्यासाठी QR कोड स्कॅन करा


पेज अंतिम अपडेट तारीख:


