Global financial market conditions deteriorated substantially during the third quarter of 2008 (July-September). Bankruptcy/sell-out/restructuring became more widespread spreading from mortgage lending institutions to systemically important financial institutions and further to commercial banks. The failure of banks and financial institutions also broadened geographically from the US to many European countries. As a result, funding pressures in the inter-bank money market persisted, equity markets weakened further and counterpart credit risk increased. Central banks continued to take action to enhance the effectiveness of their liquidity facilities. Emerging market economies (EMEs), which had been relatively resilient in the initial phase of the financial turbulence, witnessed an environment of tightened external funding condition, rising risk and high inflation led by elevated food and energy prices.
Financial markets in India, which remained largely orderly from April 2008 to mid-September 2008, witnessed heightened volatility between mid-September and mid-October 2008. In the foreign exchange market, the Indian rupee generally depreciated against major currencies. Indian equity markets declined in tandem with trends in major international equity markets. Liquidity conditions tightened since mid-September 2008 reflecting adverse developments in international financial markets, apart from domestic factors. The Reserve Bank took necessary actions to inject liquidity and reassured the market that the Indian banking system remained sound, well capitalised and well regulated.
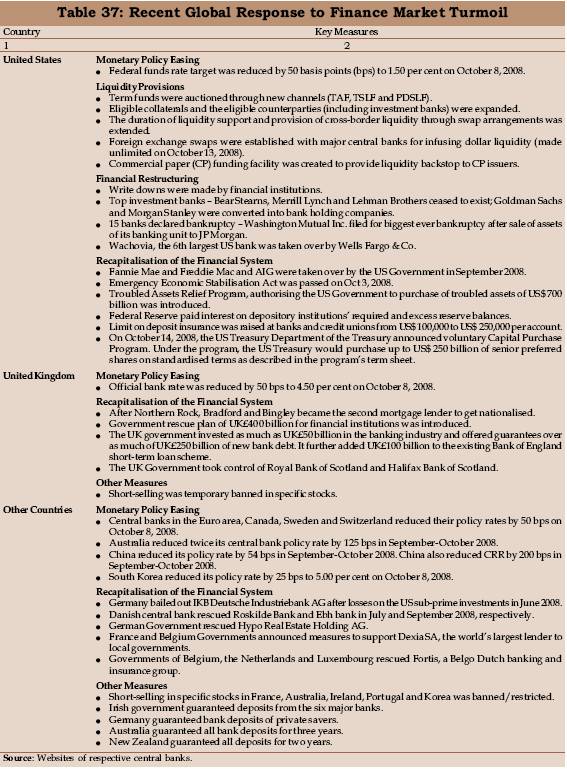
International Financial Markets
Global financial market conditions worsened further during June-October 20081. By September 2008, the crisis intensified creating apprehensions about the viability of some systemically important financial institutions. While markets continued to be fragile, worries about the economic outlook and related uncertainties gained prominence, weighing on valuations across asset classes. Credit markets witnessed renewed pressure from end-May 2008 as spreads widened to reflect the implications of the ongoing cyclical adjustment for loss expectations and financial sector balance sheets. Corporate earnings and credit quality eroded as input cost increased and demand subsided in an environment of higher inflation and lower growth. Bond yields in major advanced economies declined reflecting a flight to safety, worsening growth outlook, but possibly improving near-term inflation outlook.
Equity markets declined further on concerns about growth, news of further financial looses by leading investment banks and deteriorating earnings. In the inter-bank money markets, funding pressures continued and spreads between the London inter-bank offered rate (LIBOR) and corresponding overnight indexed swap (OIS) rates widened on the back of renewed concerns about financial sector writedowns, weak equity markets, counterparty credit risk and liquidity factors.
Strains in financial markets increased significantly in June 2008 and early-July 2008 as negative cyclical expectations were fuelled by further weakness in housing markets. There was further increase in mortgage delinquencies and foreclosures in the US, with house price depreciation projected to extend well into the future. Sentiment deteriorated further as concerns mounted about the losses and longer-term profitability of two US mortgage companies, viz., Fannie Mae and Freddie Mac, triggering apprehensions about their ability to raise new capital. These two institutions were placed under the conservatorship of the US Federal Housing Finance Agency with the US Government pledging additional financial support as needed to maintain adequate capital and funding.
In order to further enhance the effectiveness of its existing liquidity facilities, the US Federal Reserve announced the following steps on July 30, 2008: (i) extension of the Primary Dealer Credit Facility (PDCF) and the Term Securities Lending Facility (TSLF) through January 30, 2009; (ii) introduction of auctions of options on US$ 50 billion on the TSLF; (iii) introduction of 84-day Term Auction Facility (TAF) loans as a complement to 28-day TAF loans; and (iv) increase in the Federal Reserve's swap line with the European Central Bank (ECB) to US$ 55 billion from US$ 50 billion in May 2008. In association with this change, the ECB and the Swiss National Bank (SNB) also adapted the maturity of their operations. Equity markets recovered somewhat towards end-July 2008, reflecting decline in the crude oil prices.
During the period from end-May to late August 2008, credit default swap (CDS) indices, however, witnessed widening of spreads with the US five-year CDX high-yield index. The spread widened by almost 136 basis points to near 709. European and Japanese CDS indices broadly mirrored the performance of their US counterparts. On August 22, 2008, the 10-year US Treasury bond yield was 3.87 per cent, around 20 basis points down from its level in late May 2008. Over the same period, 10-year yields in the Euro area and Japan fell by about 20 and 30 basis points to 4.22 per cent and 1.45 per cent, respectively.
Strains in the global financial markets exacerbated further in September 2008 by the bankruptcy/sell-out/restructuring of some of the world’s largest financial institutions resulting in severe disruptions of international money markets, sharp declines in stock markets across the globe and extreme investor risk aversion. Central banks and financial regulators continued to work together closely and took steps with both unusual and unconventional measures to facilitate the orderly operation of financial markets and to ensure financial stability.
The US Federal Reserve Board on September 14, 2008 announced several initiatives to provide additional support to financial markets, including enhancements to its existing liquidity facilities. The collateral eligible to be pledged at the PDCF was broadened to closely match the types of collateral that can be pledged in the tri-party repo systems of the two major clearing banks rather than being limited to investment-grade debt securities as was the previous practice. The collateral for the TSLF was also expanded; eligible collateral for Schedule 2 auctions included all investment-grade debt securities instead of the earlier practice of pledging only Treasury securities, agency securities, and AAA-rated mortgage-backed and asset-backed securities. Also, Schedule 2 TSLF auctions were decided to be conducted each week instead of the earlier practice of conducting them every two weeks. In addition, the amounts offered under Schedule 2 auctions increased to a total of US$ 150 billion from US$ 125 billion. Thus, including an amount of US$ 50 billion under Schedule 1 auctions, which remained unchanged, the total amount offered in the TSLF programme was raised to US$ 200 billion from US$ 175 billion.
On September 16, 2008, the US Federal Reserve Board, with the full support of the Treasury Department, authorised the Federal Reserve Bank of New York to lend up to US$ 85 billion to the American International Group (AIG). The US Federal Reserve Board determined that, in prevailing circumstances, a disorderly failure of AIG could add to already significant levels of financial market fragility and lead to substantially higher borrowing costs, reduced household wealth, and materially weaker economic performance.
On September 18, 2008, the Bank of Canada, the Bank of England, the European Central Bank, the US Federal Reserve, the Bank of Japan and the Swiss National Bank announced coordinated measures designed to address the continued elevated pressures in short-term US dollar funding markets and to improve the liquidity conditions in global financial markets. The US Federal Open Market Committee (FOMC) authorised a US$ 180 billion expansion of its temporary reciprocal currency arrangements (swap lines) to provide dollar funding for both term and overnight liquidity operations by the other central banks. The FOMC authorised increases in the existing swap lines with the ECB and the SNB. These larger facilities would support the provision of US dollar liquidity in amounts of up to US$ 110 billion by the ECB, an increase of $55 billion, and up to US$ 27 billion by the SNB, an increase of US$ 15 billion. In addition, new swap facilities were authorised with the Bank of Japan, the Bank of England and the Bank of Canada. These facilities would support the provision of US dollar liquidity in amounts of up to US$ 60 billion by the Bank of Japan, US$ 40 billion by the Bank of England and US$ 10 billion by the Bank of Canada. All of these reciprocal currency arrangements were authorised through January 30, 2009.
The US Federal Reserve Board on September 19, 2008 announced two enhancements to its programmes to provide liquidity to markets. One initiative was to extend non-recourse loans at the primary credit rate to US depository institutions and bank holding companies to finance their purchases of high quality asset-backed commercial paper (ABCP) from money market mutual funds. This would assist money funds that hold such paper in meeting demands for redemptions by investors and foster liquidity in the ABCP markets and broader money markets. To further support market functioning, the US Federal Reserve also decided to purchase from primary dealers federal agency discount notes, which are short-term debt obligations issued by Fannie Mae, Freddie Mac and the Federal Home Loan Banks. On the same day, the US Federal Reserve Board approved two interim final rules in connection with its initiative to provide liquidity to markets by extending loans to banking organisations to finance their purchases of high quality ABCP from money market mutual funds. The first interim final rule would provide a temporary limited exception from the Board's leverage and risk-based capital rules for bank holding companies and state member banks. The second would provide a temporary limited exception from sections 23A and 23B of the Federal Reserve Act, which establish certain restrictions on requirements for transactions between a bank and its affiliates. The interim final rules will facilitate participation by depository institutions and bank holding companies in this special lending programme as intermediaries between the Federal Reserve and money market mutual funds. These exceptions would expire on January 30, 2009, unless extended by the Board, and are subject to various conditions to promote safety and soundness.
On September 21, 2008, the US Federal Reserve approved the applications of Goldman Sachs and Morgan Stanley to become bank holding companies. To provide increased liquidity support to these firms as they migrate to managing their funding within a bank holding company structure, the Federal Reserve Board authorised the Federal Reserve Bank of New York to extend credit to the US broker-dealer subsidiaries of Goldman Sachs and Morgan Stanley against all types of collateral that may be pledged at the Federal Reserve's primary credit facility for depository institutions or at the existing PDCF. The Federal Reserve has also made these collateral arrangements available to the broker-dealer subsidiary of Merrill Lynch. In addition, the Board also authorised the Federal Reserve Bank of New York to extend credit to the London-based broker-dealer subsidiaries of Goldman Sachs, Morgan Stanley, and Merrill Lynch against collateral that would be eligible to be pledged at the PDCF.
To further improve the liquidity conditions in global financial markets, the US FOMC authorised the establishment of new swap facilities with the Reserve Bank of Australia, the Sveriges Riksbank, the Danmarks Nationalbank, and the Norges Bank on September 24, 2008. These new facilities would support the provision of US dollar liquidity in amounts of up to US$ 10 billion each by the Reserve Bank of Australia and the Sveriges Riksbank and in amounts of up to US$ 5 billion each by the Danmarks Nationalbank and the Norges Bank. On September 26, 2008, using their reciprocal currency arrangements (swap lines) with the Federal Reserve, the Bank of England, the European Central Bank, and the Swiss National Bank announced the introduction of operations to provide US dollar up to US$ 74 billion with a one-week maturity. These operations were designed to address funding pressures over quarter end.
The US Federal Reserve on September 29, 2008 announced further initiatives to support financial stability and to maintain a stable flow of credit to the economy. Actions by the Federal Reserve included: (i) an increase in the size of the 84-day maturity TAF auctions to US$ 75 billion per auction from US$ 25 billion beginning with the October 6 auction; (ii) two forward TAF auctions totalling US$ 150 billion that will be conducted in November 2008 to provide term funding over year-end; and (iii) an increase in swap authorisation limits with the Bank of Canada, Bank of England, Bank of Japan, Danmarks Nationalbank, European Central Bank, Norges Bank, Reserve Bank of Australia, Sveriges Riksbank, and Swiss National Bank to a total of US$ 620 billion, from US$ 290 billion previously. All of these temporary reciprocal swap facilities have been authorised through April 30, 2009.
The bankruptcy/sell-out/restructuring in the international financial system broadened from mortgage lenders to systemically important financial institutions and further to banks. The US Federal Reserve approved the proposal submitted by the Well Fargo & Company to buy Wachovia Corporation and its subsidiary banks. The Washington Mutual was sold to JPMorgan Chase. The failure of banks/financial institutions became geographically widespread from the US to many European countries. The UK authorities took over the the second mortgage lender, i.e., Bradford & Bingley into public ownership after the events triggered by the collapse of Lehman Brothers, an investment bank, sparked a withdrawal of deposits. Hypo Real Estate Holding AG was rescued by German Government. The Governments of Belgium, Luxembourg and the Netherlands bought sizeable stakes in Fortis, Belgium's biggest lender, after capital fears triggered a fall in shares. The Belgian and Luxembourg authorities bailed out the second bank, i.e., Dexia, the world's largest lender to local government, along with their French counterpart. The US Federal Reserve Board allowed Mitsubishi UFJ Financial Group, Inc., Tokyo, Japan, to acquire up to 24.9 per cent of the voting shares of Morgan Stanley and also to acquire an indirect interest in Morgan Stanley’s subsidiary, Morgan Stanley Bank; subsidiary savings association, Morgan Stanley Trust; and subsidiary trust company, Morgan Stanley Trust National Association.
The US Congress agreed to deploy US$ 700 billion under the Troubled Assets Relief Programme (TARP) proposed by the US Department of the Treasury to strengthen the US financial market and promote the flow of credit to businesses and consumers that would enhance its economic growth and prosperity. This package would provide the necessary tools to deploy up to US$ 700 billion to address the urgent needs in the financial system, viz., by purchasing troubled assets broadly, insuring troubled assets, or averting the potential systemic risk from the disorderly failure of a large financial institution. On October 3, 2008, the US Congress temporarily increased FDIC deposit insurance from US$100,000 to US$250,000 per depositor through December 31, 2009.
On October 6, 2008, the US Federal Reserve Board announced that it would pay interest on depository institutions' required and excess reserve balances. The payment of interest on excess reserve balances would give the Federal Reserve greater scope to use its lending programs to address conditions in credit markets while also maintaining the federal funds rate close to the target established by the FOMC. Consistent with this increased scope, the Federal Reserve also announced additional actions to strengthen its support of term lending markets. It increased the sizes of the both 28-day and 84-day TAF auctions to US$ 150 billion each. These increases will eventually bring the amounts outstanding under the regular TAF program to US$ 600 billion. In addition, the sizes of the two forward TAF auctions to be conducted in November 2008 to extend credit over year-end have been increased to US$ 150 billion each, so that US$ 900 billion of TAF credit will potentially be outstanding over year-end.
The commercial paper market in the US was under considerable strain in recent weeks as money market mutual funds and other investors, themselves often facing liquidity pressures, have become increasingly reluctant to purchase commercial paper, especially at longer-dated maturities. As a result, the volume of outstanding commercial paper has shrunk, interest rates on longer-term commercial paper have increased significantly, and necessitating a high percentage of outstanding paper to be refinanced each day. On October 7, 2008, the US Federal Reserve Board announced the creation of the Commercial Paper Funding Facility (CPFF), a facility that will complement the Federal Reserve’s existing credit facilities to help provide liquidity to term funding markets. The CPFF would provide a liquidity backstop to US issuers of commercial paper through a special purpose vehicle (SPV) that will purchase three-month unsecured and asset-backed commercial paper directly from eligible issuers. The Federal Reserve would provide financing to the SPV under the CPFF and would be secured by all of the assets of the SPV and, in the case of commercial paper that is not asset-backed commercial paper, by the retention of up-front fees paid by the issuers or by other forms of security acceptable to the Federal Reserve in consultation with market participants.
In a coordinated policy action, several central banks cut policy rates to ease liquidity situation. Some central banks resorted to financial restructuring and recapitalisation of the troubled financial institutions to reduce strains in financial markets. Major central banks decided easing of monetary conditions as inflationary pressures have started to moderate, partly reflecting a marked decline in energy and other commodity prices. The recent intensification of the financial crisis, however, augmented the downside risks to growth and thus has diminished further the upside risks to price stability. Accordingly, on October 8, 2008, the Bank of Canada, the Bank of England, the European Central Bank, the Federal Reserve, Sveriges Riksbank and the Swiss National Bank reduced their policy rates by 50 basis points each. The US FOMC also decided to lower its target for the federal funds rate by 50 basis points to 1.50 per cent. Central banks in other Asian countries such as the People's Bank of China, the Bank of Korea, the Central Bank of Kuwait, the Hong Kong Monetary Authority and the Central Bank of the United Arab Emirates also reduced their policy rates (Table 37).
On October 13, 2008, in order to provide broad access to liquidity and funding to financial institutions, the Bank of England (BoE), the European Central Bank (ECB), the Federal Reserve, the Bank of Japan and the Swiss National Bank (SNB) jointly announced further measures to improve liquidity in short-term US dollar funding markets. Accordingly, the BoE, ECB, and SNB would conduct tenders of US dollar funding at 7-day, 28-day, and 84-day maturities at fixed interest rates for full allotment. Funds would be provided at a fixed interest rate, set in advance of each operation. Counterparties in these operations would be able to borrow any amount they wish against the appropriate collateral in each jurisdiction. Accordingly, sizes of the reciprocal currency arrangements (swap lines) between the Federal Reserve and the BoE, the ECB, and the SNB would be increased to accommodate whatever quantity of US dollar funding is demanded. The Bank of Japan would be considering the introduction of similar measures.
The US Department of the Treasury, on October 14, 2008, announced a voluntary Capital Purchase Program to encourage US financial institutions to build capital to increase the flow of financing to US businesses and consumers and to support the US economy. Under the program, the US Treasury would purchase up to US$ 250 billion of senior preferred shares on standardised terms as described in the program's term sheet. The program was available to qualifying US controlled banks, savings associations, and certain bank and savings and loan holding companies engaged only in financial activities that elect to participate before 5:00 pm (EDT) on November 14, 2008. The US Treasury would determine eligibility and allocations for interested parties after consultation with the appropriate federal banking agency.
According to the IMF's estimates2, the losses on US sub-prime mortgages and related exposure amounted to US$1.4 trillion. According to the IMF’s assessment, increased stress in financial markets in September 2008 reflected bank funding pressures on concern that credit losses were mounting in the grip of a negative feedback loop between the economy and the financial system. Furthermore, bank adjustment was hampered by high funding costs, reduced revenue streams from fee-based securitisation business, and forced accumulation of assets from off-balance-sheet entities and prior loan commitments. At the same time, falling equity prices made raising new capital highly expensive.
Emerging market economies (EMEs), which had been relatively resilient during most of 2007 and 2008, witnessed a changed environment in recent months. External funding conditions began to tighten, implying rising risk, particularly for countries with negative current account positions. High inflation backed by elevated food and energy prices posed a threat to real income and corporate profitability. As a result, the previous views about emerging market decoupling began to be reassessed, and changes in macroeconomic conditions and associated economic policies gained increased investor attention.
The recent episode of global financial market distress, especially during June-October 2008, raises several issues. First, the conditions of global financial markets have witnessed a transition from a broad-based cyclical deterioration to the viability of systemically important financial institutions. The financial crisis seems to be spreading across markets, institutions and countries, reflecting problem of contagion. It needs to be recognised that there has been a breakdown of trust in inter-bank and inter-institutional lending. The reversal of such extreme kind of risk perception and full resolution of the crisis will inevitably take time. Second, in drawing a lesson of the need for financial regulation and supervision of staying ahead of innovation in financial market, there is a distinct risk that too much stringency in regulation may stifle innovation. This risk needs to be guarded. Third, there is a need for inter-agency coordination in which the role of banks, regulators, supervisors and fiscal authorities regarding financial stability needs to be revisited. Central banks should play a central role in maintaining financial stability and should have the necessary informational base to do so effectively. This implies close co-operation among all the agencies entrusted with the task of maintaining financial stability. Fourth, the unfolding of the crisis has revealed the weaknesses of structured products and derivatives in the credit markets and their financial stability implications thereby raising issues on appropriateness of such products and the need to eliminate shortcomings. Fifth, it is wrongly perceived that the near meltdown of the US financial sector reflects that markets and competition do not work. The right lesson to draw is that markets and institutions do succumb occasionally to excesses, which is why regulators have to be vigilant, constantly finding the right balance between attenuating risk-taking and inhibiting growth. Sixth, the consequence of massive injection of liquidity in an environment of high inflation may lead to moral hazard issues. Seventh, with the failure of systemically important financial institutions, there is a possibility that the overall size of the financial sector would shrink in many markets. In these circumstances, the key is to strike a balance between limiting moral hazard and safeguarding the financial system’s effectiveness. Finally, notwithstanding the recent use of innovative and unconventional measures, a more systematic approach would be required to deal with disposition of distressed assets, the degree of protection offered to depositors, and the scale and scope of liquidity support that is offered to institutions and markets.
The Reserve Bank is closely monitoring the developments in the global as well as domestic financial markets and stands ready to take such pre-emptive action as may be necessary to contain excess volatility in the domestic financial markets. In order to alleviate the recent transient pressures on the domestic financial markets which are related largely to external developments, the Reserve Bank announced a host of measures on September 16, 2008. First, the Reserve Bank decided that it would continue to sell foreign exchange (US dollar) through agent banks or directly to augment supply in the domestic foreign exchange market or intervene directly to meet any demand-supply gaps. Second, the interest rate ceiling on FCNR (B) deposits was increased by 50 basis points, i.e., to LIBOR/Swap rates minus 25 basis points. Third, interest rate ceilings on NR(E)RA deposits were increased by 50 basis points, i.e., to LIBOR/Swap rates plus 50 basis points. Fourth, scheduled banks were temporarily allowed to avail additional liquidity support under the liquidity adjustment facility (LAF) to the extent of up to one per cent of their net demand and time liabilities and seek waiver of penal interest. Fifth, the Second LAF was re-introduced to provide additional liquidity. Sixth, the Reserve Bank advised Lehman Brothers Capital Pvt. Ltd to seek prior approval of the Reserve Bank before contracting any direct/indirect liability from any institution in India or outside India or making any foreign currency remittance. Lehman Brothers Fixed Income Securities Pvt. Ltd. was advised not to declare any interim dividend or remit any amount to its holding company or any other group company without prior approval of the Reserve Bank. Furthermore, Lehman Brothers Fixed Income Securities Pvt. Ltd. was advised not to undertake transactions in government securities as a primary dealer in the primary market.
The Government and the Reserve Bank also initiated a host of measures to increase capital inflows and improving liquidity conditions. On September 22, 2008, the limit for borrowers in the infrastructure sector for availing external commercial borrowing (ECB) was increased to US$ 500 million per financial year from the earlier limit of US$ 100 million per financial year for rupee expenditure for permissible end-uses under the approval route. The all-in-cost ceiling for ECBs over average maturity of seven years was increased by 50 basis points to 450 basis points over 6-month LIBOR. On October 8, 2008, ECB policy was further liberalised by including development of the mining, exploration and refinery sectors in the definition of Infrastructure sector.
On a review of the liquidity conditions, particularly in the context of the deterioration in the global financial environment, the Reserve Bank announced a reduction of the cash reserve ratio (CRR) by 250 basis points to 6.50 per cent with effect from the fortnight beginning October 11, 2008. The Reserve Bank decided to conduct 14-day repo under the LAF at 9.0 per cent per annum for a notified amount of Rs.20,000 crore on October 14, 2008 with a view to meet the liquidity requirements of mutual funds. It was also decided to conduct this repo every day until further notice to a cumulative amount of Rs.20,000 crore for the same purpose. Furthermore, the restriction on lending against certificates of deposits (CDs) and buy back of CDs was relaxed for a period of 15 days with effect from October 14, 2008, only in respect of CDs held by mutual funds.
In view of the continuing global financial market uncertainties and their indirect impact on Indian financial markets, the Reserve Bank announced a host of measures on October 15, 2008. First, it was decided, purely as a temporary measure, that banks may avail of additional liquidity support exclusively for the purpose of meeting the liquidity requirements of mutual funds to the extent of up to 0.5 per cent of their net demand and time liabilities (NDTL). This additional liquidity support would terminate 14 days from the closure of the special term repo facility announced on October 14, 2008. This accommodation was made available in addition to the temporary measure announced on September 16, 2008 thereby permitting banks to avail of additional liquidity support to the extent of up to 1 per cent of their NDTL. Second, the Reserve Bank instituted a mechanism of Special Market Operations (SMO) for public sector oil marketing companies in June-July 2008 taking into account the then prevailing extraordinary situation in the money and foreign exchange markets. The Reserve Bank announced on October 15, 2008 that it would institute a similar facility when oil bonds become available. Third, the Reserve Bank, at the request of the Central Government, agreed to provide Rs.25,000 crore to the lending institutions immediately under the Agricultural Debt Waiver and Debt Relief Scheme, as the first instalment. Fourth, the interest rate ceiling on FCNR(B) deposits was increased by 50 basis points, i.e., to LIBOR/ Swap rates plus 25 basis points. Fifth, the interest rate ceiling on NR(E)RA deposits was increased by 50 basis points, i.e., to LIBOR/Swap rates plus 100 basis points. Sixth, banks were allowed to borrow funds from their overseas branches and correspondent banks up to a limit of 50 per cent of their unimpaired Tier I capital as at the close of the previous quarter or US$ 10 million, whichever is higher, as against the earlier limit of 25 per cent. Seventh, assurance was given for supply of foreign exchange to meet supply-demand gap in the market. Eighth, in order to alleviate the pressures of the indirect impact of the global liquidity constraint on domestic financial market reflected by some signs of strain in its credit markets in recent weeks, the Reserve Bank reduced the repo rate under the LAF by 100 basis points to 8.0 per cent on October 20, 2008.
The Reserve Bank is monitoring developments in the financial markets closely and continuously, and would respond swiftly and even pre-emptively to any adverse external developments impinging on domestic financial stability, price stability and inflation expectations. The Reserve Bank is committed to maintaining financial stability and active, and flexible liquidity management by using all policy instruments.
Short-term Interest Rates
During the third quarter of 2008, short-term interest rates in advanced economies witnessed a mixed trend, moving broadly in tandem with the policy rates and liquidity conditions (Table 38). In the wake of the tight liquidity
Table 38 : Short-term Interest Rates |
(Per cent) |
Region/Country |
End of |
|
March |
March |
March |
June |
September |
October* |
|
2006 |
2007 |
2008 |
2008 |
2008 |
2008 |
1 |
2 |
3 |
4 |
5 |
6 |
7 |
Advanced Economies |
|
|
|
|
|
|
Euro area |
2.80 |
3.91 |
4.72 |
4.96 |
5.07 |
5.17 |
Japan |
0.04 |
0.57 |
0.75 |
0.75 |
0.75 |
0.78 |
UK |
4.58 |
5.55 |
6.01 |
5.93 |
6.25 |
6.38 |
US |
4.77 |
5.23 |
2.26 |
2.29 |
2.04 |
2.12 |
Emerging Market Economies |
|
|
|
|
|
|
Argentina |
9.63 |
9.63 |
10.44 |
16.50 |
13.81 |
16.50 |
Brazil |
16.54 |
12.68 |
11.18 |
12.17 |
13.66 |
13.67 |
China |
2.40 |
2.86 |
4.50 |
4.48 |
4.31 |
4.23 |
Hong Kong |
4.47 |
4.17 |
1.83 |
2.33 |
3.66 |
4.34 |
India |
6.11 |
7.98 |
7.23 |
8.73 |
8.56 |
8.69 |
Malaysia |
3.51 |
3.64 |
3.62 |
3.69 |
3.70 |
3.68 |
Philippines |
7.38 |
5.31 |
6.44 |
6.00 |
4.00 |
5.56 |
Singapore |
3.44 |
3.00 |
1.38 |
1.25 |
1.78 |
1.38 |
South Korea |
4.26 |
4.94 |
5.32 |
5.36 |
5.78 |
6.03 |
Thailand |
5.10 |
4.45 |
3.25 |
3.65 |
3.85 |
3.85 |
*: As on October 15, 2008.
Note : Data for India refer to 91-day Treasury Bills rate and for other
countries 3-month money market rates.
Source : The Economist. |
conditions, short-term interest rates in major economics generally increased in October 2008. In the US, short-term interest rates declined till September 2008, but increased in October 2008. In the UK, short-term interest rates increased, notwithstanding cut in the policy rate in the second half of 2007-08 and also in April and October 2008. The Bank of England, which had increased its policy rate in May 2007 and July 2007, reduced the rate in December 2007, February 2008, April 2008 and October 2008 to 4.50 per cent in the wake of concerns over slow growth. Short-term interest rates increased in the Euro area during the quarter ended September 2008 and also in October 2008. The European Central Bank raised its refinance rate by 25 basis points on July 3, 2008 but reduced it by 50 basis points to 3.75 per cent on October 8, 2008. In the EMEs, short-term interest rates generally softened in China, Malaysia and the Philippines but firmed up in Brazil, Hong Kong, Singapore, South Korea and Thailand between end-June 2008 and October 15, 2008. In September and October 2008, the People's Bank of China reduced its benchmark lending rate by 0.27 percentage points each to 6.93 per cent, and also reduced its reserve requirement ratio by one percentage point in September 2008. The Bank of Korea reduced its policy rate by 25 basis points to 5.00 per cent on October 9, 2008.
Government Bond Yields
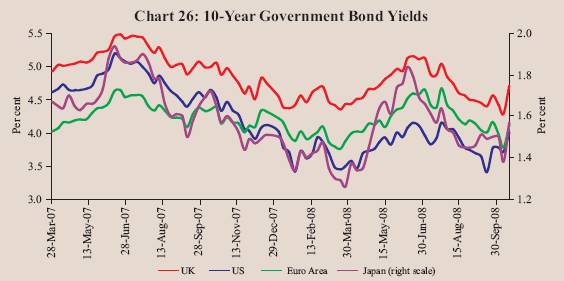
Long-term government bond yields in major advanced economies, which had softened at end-March 2008, hardened during the second quarter of 2008 on account of reduced safe haven demand for government securities coupled with a reassessment among investors of the need for monetary easing, following the stabilisation of financial markets (Chart 26). However, this trend was reversed subsequently as market expectations regarding price levels and monetary policy shifted against the backdrop of changing oil and commodity prices. Government bond yields in major advanced economies declined in the third quarter of 2008, largely reflecting worsening growth expectations and improved near-term inflation outlook. The 10-year government bond yield in the US declined by 10 basis points between June 25, 2008 and October 15, 2008. During the same period, yields on 10-year government papers declined by 40 basis points in the UK, 46 basis points in the Euro area and 12 basis points in Japan.
Equity Markets
Equity markets, which had recovered somewhat during April-May 2008, made further losses thereafter. During the third quarter of 2008, equity markets in most of the developed and EMEs declined on the back of negative news about the health of financial institutions, concerns over economic slowdown in the US, Europe and Asia, extension of credit losses, high inflation and fears over decline in corporate earnings (Table 39).
Foreign Exchange Market
In the foreign exchange market, the US dollar, which had depreciated against major currencies during April-July 2008, appreciated from early-August 2008 notwithstanding an increase in the unemployment rate and persistent low housing sales. The dollar depreciated till end-July 2008 against most of the currencies on account of lowering consumer confidence, weaker equity markets, slowing manufacturing productivity growth, higher unemployment with downward non-farm payroll employment, and low housing sales. The US dollar’s strength from early-August 2008, however, reflected narrowing of growth differential between the US and the rest of the world, liquidation of positions in the overseas equity and bond markets by US investors and repatriation of the money back to the US due to slowing growth in the Euro area. Between end-March 2008 and October 14, 2008, the US dollar appreciated by 15.0 per cent against the Euro, 13.1 per cent against the Pound sterling and 2.7 per cent against the Japanese yen. Amongst Asian currencies, the US dollar depreciated by 2.7 per cent against Chinese yuan but appreciated by 26.3 per cent against Korean won, 19.4 per cent against the Indian rupee, 11.0 against the Russian ruble, 9.5 per cent against the Malaysian ringgit and 8.9 per cent against Thai baht (Table 40).
Table 39: International Stock Markets |
(Per cent) |
Country/Index |
Percentage Variation |
Percentage Variation |
|
(year-on-year) |
|
|
End-March |
End-March |
October 14, 2008 over |
|
2007 |
2008 |
End-March 2008 |
1 |
2 |
3 |
4 |
Developed Markets |
|
|
|
US (Dow Jones) |
11.2 |
-0.7 |
-24.1 |
US (NASDAQ) |
3.5 |
-5.9 |
-21.9 |
FTSE UK 100 |
5.8 |
-9.6 |
-22.9 |
Euro area (FTSE 100) |
7.5 |
-15.7 |
-21.6 |
Japan (Nikkei 225) |
1.3 |
-27.6 |
-24.6 |
Hong Kong (Hang Seng) |
25.3 |
15.4 |
-26.3 |
Emerging Markets |
|
|
|
Russia |
34.9 |
6.1 |
-57.7 |
Brazil |
20.7 |
33.1 |
-31.8 |
Colombia |
-3.7 |
-16.0 |
-8.7 |
South Africa |
34.3 |
11.5 |
-26.7 |
South Korea |
6.8 |
17.3 |
-19.7 |
Hungary |
1.6 |
-7.3 |
-24.3 |
Singapore |
28.2 |
-4.9 |
-29.2 |
Malaysia |
34.6 |
0.1 |
-22.6 |
Argentina |
16.8 |
0.04 |
-35.8 |
Turkey |
1.8 |
-10.6 |
-21.7 |
Indonesia |
38.4 |
33.7 |
-36.4 |
India |
15.9 |
19.7 |
-26.6 |
Thailand |
-8.1 |
21.3 |
-38.7 |
China |
145.2 |
9.1 |
-41.9 |
Memo: |
|
|
|
World (MSCI) |
13.4 |
-5.1 |
-28.9 |
EMEs (MSCI) |
17.9 |
18.9 |
-39.0 |
Asia (MSCI) |
18.7 |
18.6 |
-37.0 |
Source: Bloomberg and Bombay Stock Exchange Limited (BSE). |
Domestic Financial Markets
Indian financial markets remained largely orderly for most part of the second quarter of 2008-09, notwithstanding the abrupt changes in the international financial environment. However, since mid-September 2008, various segments of the domestic financial markets witnessed heightened volatility reflecting uncertain global situation. Interest rates in the money market moved in accordance with evolving liquidity conditions. The daily average call rate, which had remained mostly within the informal corridor set by reverse repo and repo rates of liquidity adjustment facility (LAF) during the first quarter of 2008-09, hovered generally above the corridor during the second quarter. Interest rates in the collateralised segments of the money market moved in tandem with the call rate and continued to remain below the call rate during the second quarter. In the foreign exchange market, the Indian rupee generally depreciated against major currencies. In the credit market, lending rates of scheduled commercial banks hardened. Yields in the government securities market generally softened during the second quarter 2008-09. Indian equity markets declined in tandem with trends in major international equity markets as well as edging up of domestic inflation (Table 41). The recent domestic financial market conditions were essentially a reflection of the adverse developments and extreme uncertainty in international financial markets.
Table 40: Appreciation (+)/Depreciation (-) of the US dollar vis-à-vis Other Currencies |
(Per cent) |
Currency |
End-March
2007 @ |
End-March
2008 @ |
Oct. 14, 2008* |
1 |
2 |
3 |
4 |
Euro |
-9.1 |
-15.8 |
15.0 |
Pound Sterling |
-11.4 |
-1.5 |
13.1 |
Japanese Yen |
0.2 |
-14.9 |
2.7 |
Chinese Yuan |
-3.4 |
-9.3 |
-2.7 |
Russian Ruble |
-6.1 |
-9.7 |
11.0 |
Turkish Lira |
3.2 |
-5.8 |
4.9 |
Indian Rupee |
-2.5 |
-8.3 |
19.4 |
Indonesian Rupiah |
0.5 |
1.1 |
5.3 |
Malaysian Ringgit |
-6.2 |
-7.8 |
9.5 |
South Korea Won |
-3.7 |
5.5 |
26.3 |
Thai Baht |
-9.9 |
-10.2 |
8.9 |
Argentine Peso |
0.7 |
2.1 |
1.3 |
Brazilian Peso |
-6.4 |
-17.0 |
26.4 |
Mexican Peso |
1.3 |
-3.5 |
15.9 |
South African Rand |
17.2 |
11.3 |
9.5 |
@: Year-on-year variation.
*: Variation over end-March 2008. |
Money Market
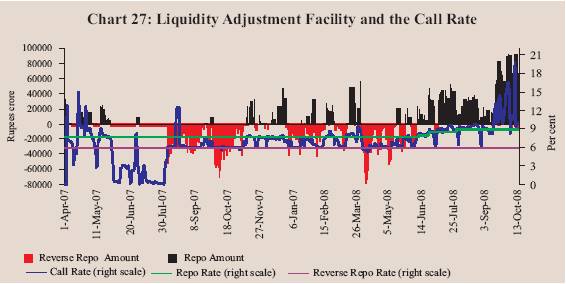
Money market rates moderated at the beginning of the first quarter of 2008-09 from their levels witnessed in the second-half of March 2008, as liquidity conditions eased on account of significant reduction in the cash balances of the Central Government. The daily average call rate mostly remained within the informal corridor set by reverse repo and repo rates during the first quarter of 2008-09. During the second quarter of 2008-09, however, the call rate mostly hovered around the repo rate reflecting the impact of, inter alia, the hikes in the cash reserve ratio (CRR) and repo rate as well as the foreign exchange market operations of the Reserve Bank on liquidity conditions (Chart 27).
Table 41 : Domestic Financial Markets at a Glance |
Year/
Month |
Call Money |
Government
Securities |
Foreign Exchange |
Liquidity
Management |
Equity |
Ave
rage
Daily
Turn
over
(Rs.
crore) |
Ave
rage
Call
Rates*
(Per
cent) |
Ave
rage
Turn
over
in Govt.
Secu
rities
(Rs.
crore)+ |
Ave
rage
10-year
Yield@
(Per
cent) |
Ave
rage
Daily
Inter-
bank
Turn
over
(US $
million) |
Ave
rage
Ex
change
Rate
(Rs.
per
US $) |
RBI’s
net
Foreign
Currency
Sales
(-)/
Pur
chases
(+) (US
$
million) |
Ave
rage
3-
month
For
ward
Premia
(Per
cent) |
Ave
rage
MSS
Out-
standing#
(Rs.
crore) |
Ave
rage
Daily
LAF
Out-
stan
ding
(Rs. crore) |
Ave
rage
Daily
BSE
Turn
over
(Rs. crore) |
Ave
rage
Daily
NSE
Turn
over
(Rs. crore) |
Ave
rage
BSE
Sen
sex** |
Ave
rage
S & P
CNX
Nifty** |
1 |
2 |
3 |
4 |
5 |
6 |
7 |
8 |
9 |
10 |
11 |
12 |
13 |
14 |
15 |
2005-06 |
17,979 |
5.60 |
3,643 |
7.12 |
12,738 |
|
44.27 |
8,143 ## |
1.60 |
58,792 |
10,986 |
3,248 |
6,253 |
8279 |
2513 |
2006-07 |
21,725 |
7.22 |
4,863 |
7.78 |
18,540 |
|
45.28 |
26,824 ## |
2.14 |
37,698 |
21,973 |
3,832 |
7,812 |
12277 |
3572 |
2007-08 |
21,393 |
6.07 |
8,104 |
7.91 |
33,672 |
|
40.24 |
78,203 ## |
2.16 |
1,28,684 |
4,677 |
6,335 |
14,148 |
16569 |
4897 |
Mar 2007 |
23,217 |
14.07 |
2,991 |
8.00 |
25,992 |
|
44.03 |
2,307 |
4.51 |
52,944 |
-11,858 |
3,716 |
7,998 |
12858 |
3731 |
Apr 2007 |
29,689 |
8.33 |
4,636 |
8.10 |
29,311 |
|
42.15 |
2,055 |
6.91 |
71,468 |
-8,937 |
3,935 |
8,428 |
13478 |
3947 |
May 2007 |
20,476 |
6.96 |
4,442 |
8.15 |
25,569 |
|
40.78 |
4,426 |
4.58 |
83,779 |
-6,397 |
4,706 |
9,885 |
14156 |
4184 |
Jun 2007 |
16,826 |
2.42 |
6,250 |
8.20 |
30,538 |
|
40.77 |
3,192 |
2.59 |
83,049 |
1,689 |
4,536 |
9,221 |
14334 |
4222 |
Jul 2007 |
16,581 |
0.73 |
13,273 |
7.94 |
32,586 |
|
40.41 |
11,428 |
1.12 |
82,996 |
2,230 |
5,684 |
12,147 |
15253 |
4474 |
Aug 2007 |
23,603 |
6.31 |
6,882 |
7.95 |
31,994 |
|
40.82 |
1,815 |
1.59 |
1,00,454 |
21,729 |
4,820 |
10,511 |
14779 |
4301 |
Sep 2007 |
21,991 |
6.41 |
5,859 |
7.92 |
36,768 |
|
40.34 |
11,867 |
1.45 |
1,17,674 |
16,558 |
6,157 |
13,302 |
16046 |
4660 |
Oct 2007 |
18,549 |
6.03 |
5,890 |
7.92 |
39,682 |
|
39.51 |
12,544 |
1.12 |
1,58,907 |
36,665 |
9,049 |
20,709 |
18500 |
5457 |
Nov 2007 |
20,146 |
6.98 |
4,560 |
7.94 |
30,683 |
|
39.44 |
7,827 |
1.40 |
1,75,952 |
-2,742 |
7,756 |
18,837 |
19260 |
5749 |
Dec 2007 |
16,249 |
7.50 |
7,704 |
7.91 |
31,567 |
|
39.44 |
2,731 |
1.64 |
1,64,606 |
-10,804 |
8,605 |
19,283 |
19827 |
5964 |
Jan 2008 |
27,531 |
6.69 |
19,182 |
7.61 |
38,676 |
|
39.37 |
13,625 |
2.07 |
1,59,866 |
15,692 |
8,071 |
19,441 |
19326 |
5756 |
Feb 2008 |
22,716 |
7.06 |
12,693 |
7.57 |
42,068 |
|
39.73 |
3,884 |
0.24 |
1,75,166 |
-1,294 |
5,808 |
13,342 |
17728 |
5202 |
Mar 2008 |
22,364 |
7.37 |
5,881 |
7.69 |
39,087 |
|
40.36 |
2,809 |
1.25 |
1,70,285 |
-8,271 |
6,166 |
14,056 |
15838 |
4769 |
Apr 2008 |
19,516 |
6.11 |
6,657 |
8.10 |
36,710 |
P |
40.02 |
4,325 |
2.68 |
1,70,726 |
26,359 |
5,773 |
13,561 |
16291 |
4902 |
May 2008 |
19,481 |
6.62 |
6,780 |
8.04 |
31,868 |
P |
42.13 |
148 |
2.45 |
1,75,565 |
11,841 |
6,084 |
13,896 |
16946 |
5029 |
Jun 2008 |
21,707 |
7.75 |
6,835 |
8.41 |
38,108 |
P |
42.82 |
-5,229 |
3.78 |
1,74,433 |
-8,622 |
5,410 |
12,592 |
14997 |
4464 |
Jul 2008 |
24,736 |
8.76 |
5,474 |
9.19 |
37,163 |
P |
42.84 |
-6,320 |
6.04 |
1,72,169 |
-27,961 |
5,388 |
12,862 |
13716 |
4125 |
Aug 2008 |
23,408 |
9.10 |
7,498 |
9.06 |
38,002 |
P |
42.94 |
1,210 |
4.71 |
1,71,944 |
-22,560 |
4,996 |
11,713 |
14722 |
4417 |
Sep 2008 |
23,379 |
10.52 |
10,418 |
8.42 |
44,000 |
P |
45.56 |
- |
2.35 |
1,75,666 |
-42,591 |
5,147 |
12,489 |
13943 |
4207 |
*: Average of daily weighted call money borrowing rates.
+ : Average of daily outright turnover in Central Government dated securities.
@: Average of daily closing rates. # : Average of weekly outstanding MSS. ** : Average of daily closing indices. ##: Cumulative for the financial year.
LAF: Liquidity Adjustment Facility.
MSS : Market Stabilisation Scheme.
BSE: Bombay Stock Exchange Limited.
NSE : National Stock Exchange of India Limited .
P : Provisional
- : Not available.
Note : In column 11, (-) indicates injection of liquidity, while (+) indicates absorption of liquidity. |
The second quarter of 2008-09 (July-September) commenced with easing of liquidity conditions mainly on account of a decline in the cash balances of the Central Government. Accordingly, the call rate declined sharply and moved within the informal corridor of reverse repo and repo rates in the first week of July 2008. Subsequently, the call rate edged above the repo rate on most of days of the month, reflecting the two-stage CRR hike of 25 basis points each (effective from the fortnights beginning July 5 and July 19, 2008, respectively) to 8.75 per cent. The average call rate was 8.76 per cent during July 2008. On a review of the macroeconomic and monetary conditions, the First Quarter Review of the Annual Statement on Monetary Policy for 2008-09 announced a 50 basis points hike in the repo rate (to 9.0 per cent) effective July 30, 2008 and 25 basis points hike in the CRR (to 9.0 per cent) effective the fortnight beginning August 30, 2008. The liquidity conditions mostly remained in a deficit mode during July-August 2008 and accordingly the call rate hovered around the repo rate. The average call rate was 9.10 per cent during August 2008.
Liquidity conditions in the domestic money markets remained tight in September 2008, mainly reflecting capital outflows, advance tax outflows and CRR hike effective August 30, 2008. With a view to assuage pressures on domestic money and foreign exchange markets accentuated by developments in international financial markets, the Reserve Bank, on September 16, 2008, announced a series of measures. Accordingly, it was decided that, purely as a temporary measure, scheduled banks may avail additional liquidity support under the LAF to the extent of up to one per cent of their net demand and time liabilities and seek waiver of penal interest effective September 17, 2008. It was also decided that the Second LAF (SLAF) will be conducted on a daily basis till further notice. The call rate continued to remain above the repo rate in the second half of September 2008. The average call rate was 10.52 per cent in September 2008.
In the context of the deterioration in the global financial environment and capital outflows and on a review of the evolving liquidity situation, the Reserve Bank subsequently announced a number of measures over October 6-20, 2008 which included: (i) a reduction in CRR by 250 basis points to 6.5 per cent with effect from October 11, 2008; (ii) introduction of a special term repo facility on a daily basis up to a cumulative amount of Rs.20,000 crore for enabling banks to meet the liquidity requirements of mutual funds; (iii) permitting banks to avail additional liquidity support under LAF up to 0.5 per cent of their NDTL for the purposes of lending to mutual funds; and (iv) reduction in the repo rate by 100 basis points to 8.0 per cent with immediate effect from October 20, 2008. Reflecting the impact of these measures, the average call rate declined from 16.51 per cent on October 1, 2008 to 6.78 per cent on October 20, 2008, after peaking at 19.70 per cent on October 10, 2008.
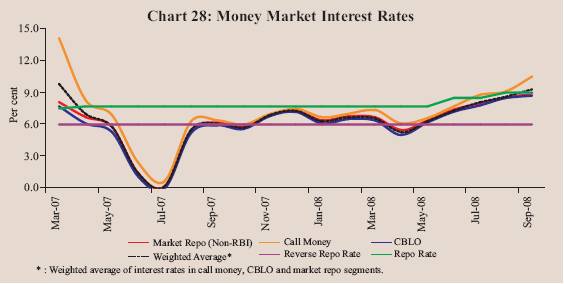
Interest rates in the collateralised segments of the money market – the market repo (outside the LAF) and the Collateralised Borrowing and Lending Obligation (CBLO) – moved in tandem with call rates and remained below the call rate during the second quarter of 2008-09 (Chart 28). During July-September 2008, interest rates averaged 9.46 per cent, 8.45 per cent and 8.33 per cent, respectively, in the call money, market repo and CBLO segments (4.48 per cent, 3.98 per cent and 3.74 per cent, respectively, a year ago). The weighted average rate in all the three money market segments was 8.67 per cent during July-September 2008 (3.97 per cent a year ago).
The average daily volume in the money market segments – call, market repo (outside the LAF) and CBLO – during July-September 2008 was 15.0 per cent lower than that in the same period of 2007-08. The collateralised market remained the predominant segment of the money market, accounting for about 73 per cent of the total volume during the second quarter of 2008-09 (Table 42). In both the CBLO and market repo segments, mutual funds were the major lenders, while banks and primary dealers were the major borrowers.
Certificates of Deposit
The outstanding amount of certificates of deposit (CDs) increased from Rs.1,47,792 crore at end-March 2008 (6.0 per cent of aggregate deposits of CDs issuing banks) to Rs.1,78,280 crore (6.5 per cent of aggregate deposits) by September 12, 2008. Most of the CDs issued were of more than six months duration. The weighted average discount rate (WADR) of CDs declined from 10.0 per cent at end-March 2008 to 9.16 per cent at end-June 2008, but thereafter increased to 11.09 per cent at September 12, 2008.
Table 42: Activity in Money Market Segments |
(Rupees crore) |
Year/
Month |
Average
Daily Volume (One Leg) |
Commercial Paper |
Certificates of
Deposit |
Call Money
Market |
Repo Market
(Outside
the LAF) |
Collateralised
Borrowing
and Lending
Obligation(CBLO) |
Total
(2+3+4) |
Term
Money
Market |
Outstanding |
WADR
(per
cent) |
Outstanding |
WADR
(per cent) |
1 |
2 |
3 |
4 |
5 |
6 |
7 |
|
8 |
|
9 |
10 |
2005-06 |
8,990 |
5,296 |
10,020 |
24,306 |
417 |
17,285 |
|
6.46 |
|
27,298 |
- |
2006-07 |
10,863 |
8,419 |
16,195 |
35,477 |
506 |
21,329 |
|
8.08 |
|
64,821 |
8.24 |
2007-08 |
10,697 |
13,684 |
27,813 |
52,194 |
352 |
33,813 |
|
9.20 |
|
1,15,617 |
8.29 |
Mar 2007 |
11,608 |
8,687 |
17,662 |
37,957 |
739 |
17,863 |
|
11.33 |
|
93,272 |
10.75 |
Apr 2007 |
14,845 |
7,173 |
18,086 |
40,104 |
440 |
18,759 |
|
10.52 |
|
95,980 |
10.75 |
May 2007 |
10,238 |
8,965 |
20,810 |
40,013 |
277 |
22,024 |
|
9.87 |
|
99,715 |
9.87 |
Jun 2007 |
8,413 |
10,295 |
20,742 |
39,450 |
308 |
26,256 |
|
8.93 |
|
98,337 |
9.37 |
Jul 2007 |
8,290 |
12,322 |
20,768 |
41,380 |
288 |
30,631 |
|
7.05 |
|
1,05,317 |
7.86 |
Aug 2007 |
11,802 |
16,688 |
26,890 |
55,380 |
319 |
31,527 |
|
8.30 |
|
1,09,224 |
8.67 |
Sep 2007 |
10,995 |
17,876 |
29,044 |
57,915 |
265 |
33,614 |
|
8.95 |
|
1,18,481 |
8.57 |
Oct 2007 |
9,275 |
15,300 |
29,579 |
54,154 |
221 |
42,183 |
|
7.65 |
|
1,24,232 |
7.91 |
Nov 2007 |
10,073 |
12,729 |
28,614 |
51,416 |
184 |
41,307 |
|
9.45 |
|
1,27,142 |
8.48 |
Dec 2007 |
8,124 |
13,354 |
30,087 |
51,565 |
509 |
40,243 |
|
9.27 |
|
1,23,466 |
8.81 |
Jan 2008 |
13,765 |
17,029 |
35,711 |
66,505 |
312 |
50,062 |
|
11.83 |
|
1,29,123 |
8.73 |
Feb 2008 |
11,358 |
17,682 |
36,007 |
65,047 |
525 |
40,642 |
|
9.73 |
|
1,39,160 |
9.94 |
Mar 2008 |
11,182 |
14,800 |
37,413 |
63,395 |
571 |
32,592 |
|
10.38 |
|
1,47,792 |
10.00 |
Apr 2008 |
9,758 |
14,966 |
38,828 |
63,552 |
374 |
37,584 |
|
8.85 |
|
1,50,865 |
8.49 |
May 2008 |
9,740 |
14,729 |
36,326 |
60,795 |
420 |
42,032 |
|
9.02 |
|
1,56,780 |
8.95 |
Jun 2008 |
10,854 |
11,262 |
35,774 |
57,890 |
253 |
46,847 |
|
10.03 |
|
1,63,143 |
9.16 |
Jul 2008 |
12,368 |
8,591 |
23,669 |
44,628 |
226 |
51,569 |
|
10.95 |
|
1,64,892 |
10.23 |
Aug 2008 |
11,704 |
10,454 |
22,110 |
44,268 |
501 |
55,036 |
|
11.48 |
|
1,71,966 |
10.98 |
Sep 2008 |
11,690 |
10,654 |
20,547 |
42,891 |
335 |
54,182 |
# |
11.51 |
# |
1,78,280 * |
11.09 * |
-: Not available. WADR: Weighted Average Discount Rate.
#: As on September 15, 2008. *: As on September 12, 2008. |
Commercial Paper
The outstanding amount of commercial paper issued by corporates increased substantially from Rs.32,592 crore at end-March 2008 to Rs.54,182 crore at mid-September 2008 in line with the seasonal pattern observed in case of CP issuances. Leasing and Finance Companies continued to be the major issuers of CP, followed by ‘manufacturing and other companies’ and financial institutions (Table 43). As earlier, CP issuance was dominated by the prime-rated companies. The discount rate range on CP moved from a range of 9.50-14.25 per cent at end-March 2008 to 10.25-14.25 per cent at mid-September 2008. The WADR on CP declined from 10.38 per cent on March 31, 2008 to 8.57 per cent as on mid-May 2008 but thereafter increased to 11.51 per cent on September 15, 2008 in tandem with the hardening of other money market rates. The most preferred tenor of CP issuance was ‘more than 180 days and above’.
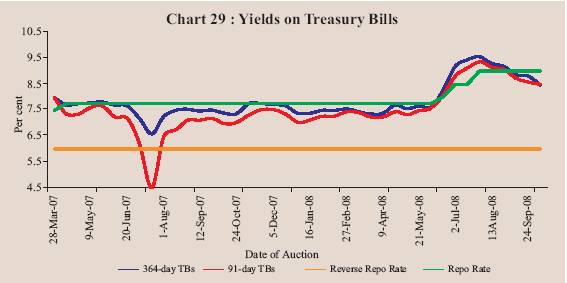
Treasury Bills
During the second quarter of 2008-09, primary market yields on Treasury Bills (TBs) hardened further, in tandem with higher money market interest rates and higher inflation (Table 44 and Chart 29). The yield spread between 364-day and 91-day TBs was 14 basis points in September 2008 (7 basis points in March 2008).
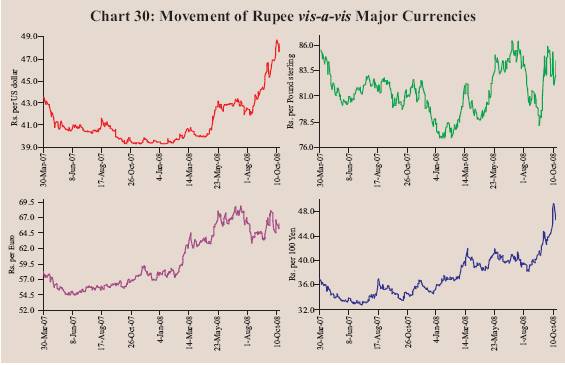
Foreign Exchange Market
During 2008-09 (up to October 16), the Indian rupee generally depreciated (Chart 30). During this period, the rupee moved in the range of Rs.39.89-48.84 per US dollar. The rupee continued to depreciate beginning April 2008, reflecting FII outflows, bearish stock market condition, high inflation and higher crude oil prices reflecting higher demand for dollars. The exchange rate of the rupee was Rs.48.84 per dollar as on October 16, 2008 as compared with Rs.39.99 per dollar at end-March 2008. At this level, the Indian rupee depreciated by 18.1 per cent over its level on March 31, 2008. Over the same period, the rupee depreciated by 5.5 per cent against the Pound sterling, 3.6 per cent against the Euro, 18.0 per cent against the Japanese yen and 20.3 per cent against the Chinese yuan.
Table 43: Commercial Paper - Major Issuers |
(Rupees crore) |
Category of Issuer |
|
End of |
|
March |
March |
June |
September * |
|
2007 |
2008 |
2008 |
2008 |
1 |
2 |
3 |
4 |
5 |
Leasing and Finance |
12,594 |
24,925 |
34,957 |
39,967 |
|
(70.5) |
(76.5) |
(76.6) |
(73.8) |
Manufacturing |
2,754 |
5,687 |
8,150 |
10,960 |
|
(15.4) |
(17.4) |
(17.4) |
(20.2) |
Financial Institutions |
2,515 |
1,980 |
3,740 |
3,255 |
|
(14.1) |
(6.1) |
(8.0) |
(6.0) |
Total |
17,863 |
32,592 |
46,847 |
54,182 |
|
(100.0) |
(100.0) |
(100.0) |
(100.0 |
* : As on September 15, 2008.
Note : Figures in parentheses are percentage shares in the total outstanding. |
Table 44: Treasury Bills in the Primary Market |
Month |
Notified |
Average Implicit Yield at |
|
|
Amount |
Minimum Cut-off Price
(Per cent) |
Average Bid-Cover Ratio |
|
(Rupees crore) |
91-day |
182-day |
364-day |
91-day |
182-day |
364-day |
1 |
2 |
3 |
4 |
5 |
6 |
7 |
8 |
2005-06 |
1,55,500 @ |
5.68 |
5.82 |
5.96 |
2.64 |
2.65 |
2.45 |
2006-07 |
1,86,500 @ |
6.64 |
6.91 |
7.01 |
1.97 |
2.00 |
2.66 |
2007-08 |
2,24,500 @ |
7.10 |
7.40 |
7.42 |
2.84 |
2.79 |
3.21 |
Mar 2007 |
15,000 |
7.73 |
7.98 |
7.90 |
2.08 |
2.15 |
3.87 |
Apr 2007 |
15,000 |
7.53 |
7.87 |
7.72 |
2.87 |
3.36 |
3.16 |
May 2007 |
18,500 |
7.59 |
7.70 |
7.79 |
2.33 |
2.57 |
2.33 |
Jun 2007 |
35,000 |
7.41 |
7.76 |
6.67 |
3.23 |
4.11 |
3.97 |
Jul 2007 |
12,500 |
5.07 |
5.94 |
6.87 |
4.48 |
2.70 |
4.56 |
Aug 2007 |
20,500 |
6.74 |
7.37 |
7.42 |
2.11 |
1.41 |
2.46 |
Sep 2007 |
25,000 |
7.08 |
7.33 |
7.48 |
2.07 |
2.91 |
2.83 |
Oct 2007 |
28,500 |
7.11 |
7.45 |
7.37 |
2.16 |
1.73 |
3.23 |
Nov 2007 |
22,500 |
7.47 |
7.65 |
7.75 |
1.63 |
1.38 |
1.88 |
Dec 2007 |
7,500 |
7.41 |
7.60 |
7.69 |
4.41 |
4.67 |
3.67 |
Jan 2008 |
19,000 |
7.08 |
7.24 |
7.39 |
2.63 |
1.61 |
4.36 |
Feb 2008 |
15,500 |
7.33 |
7.40 |
7.51 |
2.15 |
2.91 |
2.78 |
Mar 2008 |
5,000 |
7.33 |
7.45 |
7.40 |
3.97 |
4.17 |
3.34 |
Apr 2008 |
22,000 |
7.28 |
7.41 |
7.53 |
1.70 |
1.36 |
2.36 |
May 2008 |
21,000 |
7.41 |
7.55 |
7.61 |
2.65 |
2.78 |
3.05 |
Jun 2008 |
11,500 |
8.01 |
8.42 |
7.93 |
2.00 |
2.76 |
2.80 |
Jul 2008 |
16,000 |
9.07 |
9.33 |
9.39 |
2.35 |
2.72 |
2.70 |
Aug 2008 |
23,500 |
9.15 |
9.31 |
9.24 |
2.99 |
2.86 |
4.35 |
Sep 2008 |
25,000 |
8.69 |
8.92 |
8.83 |
3.06 |
3.04 |
3.57 |
@ : Total for the financial year.
Note: 1. 182-day TBs were reintroduced with effect from April 2005.
2. Notified amounts are inclusive of issuances under the Market Stabilisation Scheme (MSS). |
On an average basis, both the 36-currency trade weighted nominal effective exchange rate (NEER) and real effective exchange rate (REER) of the Indian rupee appreciated by 4.8 per cent and 4.7 per cent, respectively, between March 2008 and August 2008 (Table 45). Between March 2008 and September 2008, the 6-currency trade weighted NEER and REER of the rupee depreciated by 8.5 per cent and 3.7 per cent, respectively. On October 14, 2008, the 6-currency trade weighted NEER and REER of the rupee experienced a depreciation of 10.8 per cent and 6.7 per cent, respectively, over their end-March 2008 levels.
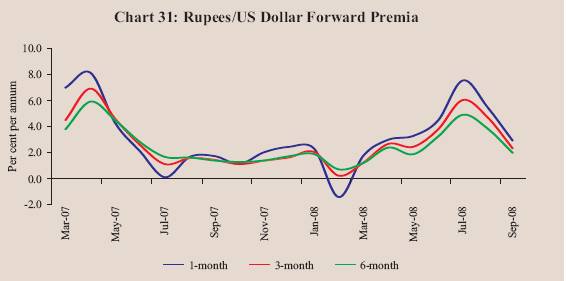
Forward premia that had increased during first four months of 2008-09 began to decline since August 2008 reflecting cash US dollar shortage in the spot market (Chart 31).
The average daily turnover in the foreign exchange market increased to US $ 52.2 billion during 2008-09 (April-September) as compared with US $ 43.3 billion a year ago (Chart 32). While the inter-bank turnover increased from US $ 31.1 billion to US $ 37.6 billion, the merchant turnover increased from US$ 12.1 billion to US $ 14.6 billion. The ratio of inter-bank to merchant turnover at 2.6 during April-September 2008-09 was almost the same as a year ago.
Credit Market
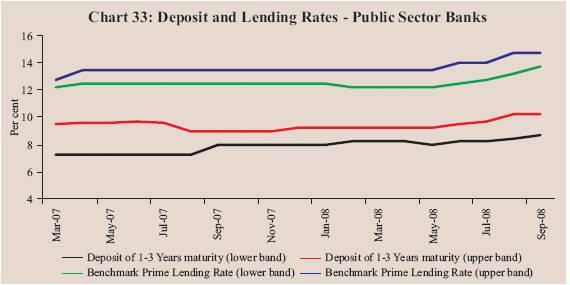
During the second quarter of 2008-09 (up to September), scheduled commercial banks (SCBs) increased their deposit rates for various maturities by 25-150 basis points. Interest rates offered by public sector banks (PSBs) on deposits of maturity of one year to three years increased from the range of 8.25-9.50 per cent in June 2008 to the range of 8.75-10.25 per cent in September 2008. Interest rates of private sector banks on deposits of maturity of one year to three years increased from the range of 8.00-9.50 per cent to the range of 8.30-10.50 per cent, while the deposit rates of foreign banks on maturity of one year to three years increased from the range of 3.50-9.75 per cent to the range of 3.50-10.50 per cent during the same period (Table 46).
Table 45: Nominal and Real Effective Exchange Rate of the Indian Rupee |
(Trade Based Weights) |
Year/Month |
Base : 1993-94 (April-March) = 100 |
|
6-Currency Weights |
36-Currency Weights |
|
NEER |
REER |
NEER |
REER |
1 |
2 |
3 |
4 |
5 |
2005-06 |
|
72.28 |
107.30 |
89.85 |
102.35 |
2006-07 |
|
69.49 |
105.57 |
85.89 |
98.48 |
2007-08 (P) |
74.17 |
114.09 |
93.92 |
105.13 |
Mar 2007 |
|
70.23 |
107.46 |
87.11 |
100.53 |
Apr 2007 |
|
72.74 |
111.63 |
91.80 |
102.88 |
May 2007 |
|
75.19 |
115.73 |
94.69 |
106.30 |
Jun 2007 |
|
75.37 |
115.22 |
94.97 |
106.22 |
Jul 2007 |
|
75.15 |
115.10 |
94.84 |
106.29 |
Aug 2007 |
|
74.44 |
114.10 |
94.38 |
105.62 |
Sep 2007 |
|
74.64 |
115.03 |
94.65 |
106.21 |
Oct 2007 |
|
75.45 |
115.79 |
95.29 |
106.41 |
Nov 2007 |
|
74.34 |
113.90 |
94.27 |
104.95 |
Dec 2007 |
|
74.65 |
114.52 |
94.68 |
105.25 |
Jan 2008 |
|
74.31 |
114.23 |
94.29 |
105.22 |
Feb 2008 |
P |
73.41 |
113.06 |
93.11 |
103.89 |
Mar 2008 |
P |
70.38 |
110.87 |
90.01 |
102.35 |
Apr 2008 |
P |
70.63 |
112.16 |
93.27 |
101.94 |
May 2008 |
P |
67.48 |
108.23 |
89.00 |
97.89 |
Jun 2008 |
P |
66.38 |
108.20 |
87.62 |
98.28 |
July 2008 |
P |
65.83 |
107.58 |
85.04 |
95.94 |
Aug 2008 |
P |
67.22 |
111.05 |
94.32 |
107.14 |
Sep 2008 |
P |
64.37 |
106.79 |
- |
- |
Oct 14, 2008 P |
62.58 |
103.67 |
- |
- |
NEER: Nominal Effective Exchange Rate.
REER: Real Effective Exchange Rate.
P: Provisional. -: Not available.
Note: 1. Data from 2007-08 onwards are provisional.
2. Rise in indices indicates appreciation of the rupee and vice versa. |
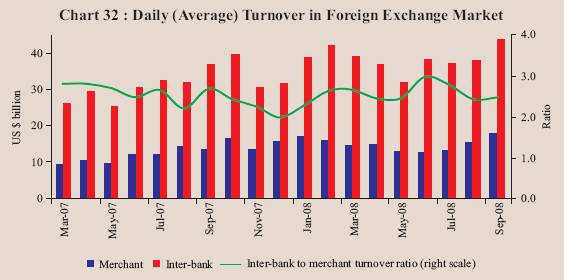
Table 46: Deposit and Lending Rates |
(Per cent) |
Item |
March |
March |
March |
June |
September |
|
2006 |
2007 |
2008 |
2008 |
2008 |
1 |
2 |
3 |
4 |
5 |
6 |
1. |
Domestic Deposit Rate |
|
|
|
|
|
|
Public Sector Banks |
|
|
|
|
|
|
|
Up to 1 year |
2.25-6.50 |
2.75-8.75 |
2.75-8.50 |
2.75-9.00 |
2.75-10.25 |
|
|
More than 1 year and
up to 3 years |
5.75-6.75 |
7.25-9.50 |
8.25-9.25 |
8.25-9.50 |
8.75-10.25 |
|
|
More than 3 years |
6.00-7.25 |
7.50-9.50 |
8.00-9.00 |
8.00-9.35 |
8.50-9.75 |
|
Private Sector Banks |
|
|
|
|
|
|
|
Up to 1 year |
3.50-7.25 |
3.00-9.00 |
2.50-9.25 |
3.00-8.75 |
3.00-9.75 |
|
|
More than 1 year and up to 3 years |
5.50-7.75 |
6.75-9.75 |
7.25-9.25 |
8.00-9.50 |
8.30-10.50 |
|
|
More than 3 years |
6.00-7.75 |
7.75-9.60 |
7.25-9.75 |
8.00-10.00 |
8.25-10.25 |
|
Foreign Banks |
|
|
|
|
|
|
|
Up to 1 year |
3.00-6.15 |
3.00-9.50 |
2.25-9.25 |
3.00-9.25 |
3.50-9.75 |
|
|
More than 1 year and up to 3 years |
4.00-6.50 |
3.50-9.50 |
3.50-9.75 |
3.50-9.75 |
3.50-10.50 |
|
|
More than 3 years |
5.50-6.50 |
4.05-9.50 |
3.60-9.50 |
3.60-9.50 |
3.60-11.00 |
2. |
Benchmark Prime Lending Rate |
|
|
|
|
|
|
|
Public Sector Banks |
10.25-11.25 |
12.25-12.75 |
12.25-13.50 |
12.50-14.00 |
13.75-14.75 |
|
|
Private Sector Banks |
11.00-14.00 |
12.00-16.50 |
13.00-16.50 |
13.00-17.00 |
13.75-17.75 |
|
|
Foreign Banks |
10.00-14.50 |
10.00-15.50 |
10.00-15.50 |
10.00-15.50 |
10.00-16.00 |
3. |
Actual Lending Rate* |
|
|
|
|
|
|
|
Public Sector Banks |
4.00-16.50 |
4.00-17.00 |
4.00-17.75 |
4.00-18.00 |
- |
|
|
Private Sector Banks |
3.15-20.50 |
3.15-25.50 |
4.00-24.00 |
4.00-25.00 |
- |
|
|
Foreign Banks |
4.75-26.00 |
5.00-26.50 |
5.00-28.00 |
5.00-25.50 |
- |
4. |
Weighted Average Lending Rate |
11.97 |
11.92 |
- |
- |
- |
- : Not available.
* : Interest rate on non-export demand and term loans above Rs.2 lakh excluding lending rates at the extreme five per cent on both sides. |
On the lending side, the benchmark prime lending rates (BPLRs) of PSBs increased by 75-125 basis points from a range of 12.50-14.00 per cent in June 2008 to the range of 13.75-14.75 per cent by September 2008 (Chart 33). Private sector banks and foreign banks also increased their BPLR from the range of 13.00-17.00 per cent and 10.00-15.50 per cent, respectively, to the range of 13.75-17.75 per cent and 10.00-16.00 per cent, respectively, during the same period. The weighted average BPLR of public sector banks, private sector banks and foreign banks also increased from 12.94 per cent, 15.22 per cent and 14.06 per cent, respectively, in June 2008 to 13.92 per cent, 16.37 per cent and 14.38 per cent, respectively, in August 2008.
Government Securities Market
Yields in the Government securities market hardened at the beginning of the current financial year with the yield of the 10-year paper reaching 8.28 per cent on April 21, 2008 in response to increase in domestic inflation (Chart 34). Thereafter, yields began to ease on the back of comfortable liquidity conditions. The decision to keep policy rates unchanged in the Annual Policy Statement for the year 2008-09, announced on April 29, 2008, also helped the market to rally. Subsequently, heightened inflationary expectations emanating from the sharp increase in global commodity prices, especially crude oil prices led to the hardening of yields. The 10-year yield rose to 8.69 per cent by end-June 2008 and further to 9.51 per cent on July 15, 2008 in the backdrop of higher than expected inflation reading and the increased domestic political uncertainty. Government securities yields, however, eased moderately at the beginning of the second fortnight of July 2008 tracking of softening in crude oil prices before hardening subsequent to the increase in the LAF repo rate and the CRR in the First Quarter Review of Annual Monetary Policy for the Year 2008-09. The 10-year yield at end-July was at 9.32 per cent. Government securities yields, however, eased during the first fortnight of August 2008 tracking the fall in global crude oil prices and easing of liquidity conditions at the close of the fortnight. Government securities yields declined and were broadly range-bound thereafter. The 10-year yield at end-August stood at 8.78 per cent. The yields continued to ease during the first fortnight of September 2008 in the backdrop of softening of crude oil prices. The yields, however, hardened considerably in the second fortnight of the month as the liquidity conditions tightened mainly reflecting advance tax outflows in conjunction with the impact of adverse developments in international financial markets. The 10-year yield was placed at 8.63 per cent at end-September 2008. Since then, the Government securities yields have eased. The CRR reduction of 250 basis points with effect from October 11, 2008 has also facilitated the decline of yields. The 10-year yield was placed at 7.69 per cent on October 16, 2008.
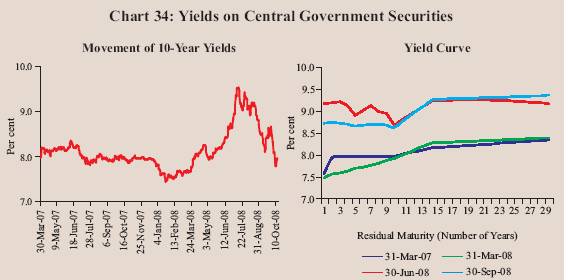
The Government securities yield curve, which had moved upward during end-March to end-July 2008, moved downwards subsequently till end-September 2008. A notable feature was inversion of the yield curve with yield of 10-year paper falling below the yields of sub-10-year segment. Accordingly, the spread between 10-year and 1-year yields, which was 45 basis points at end-March 2008, turned negative (-) 11 basis points at end-September 2008 (-49 basis points as at end-June 2008). The yield spread reflected the concentration of trading around the 10-year tenor as well as the impact of monetary policy actions at the short end. The spread between 30-year and 10-year yields was 74 basis points at end-September 2008 (47 basis points at end-March 2008).
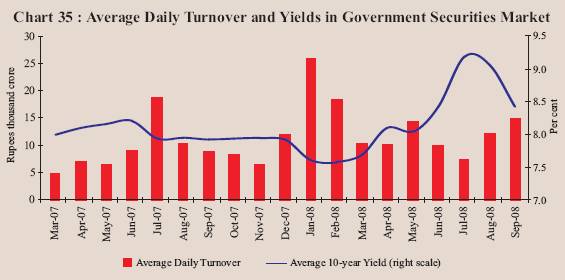
The daily turnover in the Central Government securities market (based on number of trading days) averaged Rs.11,498 crore during July-September 2008, which was around one per cent higher than that in the preceding quarter (Chart 35).
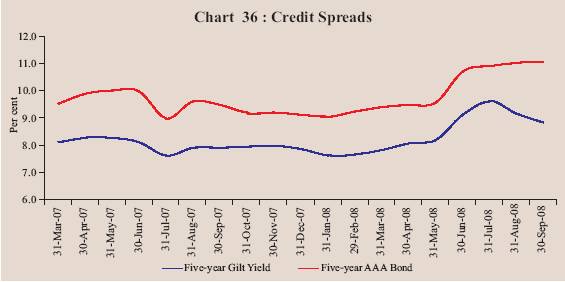
The yield on 5-year AAA-rated corporate bonds hardened during the second quarter of 2008-09. The credit spread between the yields on 5-year AAA-rated bonds and 5-year government securities was 216 basis points at end-September 2008 as compared with 156 basis points at end-March 2008 (Chart 36).
Equity Market
Primary Market
The primary market segment of the domestic capital market witnessed slackness in resource mobilisation during the second quarter of 2008-09. Cumulatively, resources raised through public issues declined sharply to Rs.12,361 crore during April-September 2008 from Rs.31,850 crore during the corresponding period of 2007. The number of issues also declined considerably to 32 from 60 (Table 47). Out of 32 issues during April-September 2008, 19 were initial public offerings (IPOs) issued by private sector companies, constituting 16.0 per cent of total resource mobilisation. Furthermore, all the issues during April-September 2008 were equity issues by private non-financial companies except one issue by private-financial company. The average size of public issues declined to Rs.386 crore during April-September 2008 from Rs.531 crore during April-September 2007.
Table 47: Mobilisation of Resources from the Primary Market |
(Amount in Rupees crore) |
Item |
April - September 2007 |
April - September 2008 P |
|
No. of Issues |
Amount |
No. of Issues |
Amount |
1 |
2 |
3 |
4 |
5 |
A. Prospectus and Rights Issues* |
|
|
|
|
1. |
Private Sector (a+b) |
57 |
28,518 |
32 |
12,361 |
|
a) |
Financial |
5 |
11,021 |
1 |
448 |
|
b) |
Non-financial |
52 |
17,497 |
31 |
11,913 |
2. |
Public Sector (a+b+c) |
3 |
3,332 |
- |
- |
|
a) |
Public Sector Undertakings |
2 |
2,516 |
- |
- |
|
b) |
Government Companies |
- |
- |
- |
- |
|
c) |
Banks/Financial Institutions |
1 |
816 |
|
|
3. |
Total (1+2) |
60 |
31,850 |
32 |
12,361 |
|
of which: |
|
|
|
|
|
(i) |
Equity |
59 |
31,350 |
32 |
12,361 |
|
(ii) |
Debt |
1 |
500 |
- |
- |
|
|
|
April-June 2007 |
April-June 2008 |
B. Private Placement |
|
|
|
|
1. |
Private Sector (a+b) |
428 |
30,744 |
276 |
22,882 |
|
a) |
Financial |
195 |
13,600 |
140 |
13,091 |
|
b) |
Non-financial |
233 |
17,144 |
136 |
9,791 |
2. |
Public Sector (a+b) |
23 |
19,695 |
28 |
11,837 |
|
a) |
Financial |
17 |
12,664 |
12 |
5,329 |
|
b) |
Non-financial |
6 |
7,031 |
16 |
6,508 |
3. |
Total (1+2) |
451 |
50,439 |
304 |
34,719 |
|
of which: |
|
|
|
|
|
(i) |
Equity |
- |
- |
- |
- |
|
(ii) |
Debt |
451 |
50,439 |
304 |
34,719 |
Memo: |
|
|
|
|
|
C. Euro Issues (April-September) |
10 |
11,284 |
10 |
4,652 |
P : Provisional. * : Excluding offers for sale. - : Nil/Negligible. |
Mobilisation of resources through private placement declined by 31.2 per cent during April-June 2008 as compared with an increase of 62.0 per cent during April-June 2007 (Table 47). Public sector entities accounted for 34.1 per cent of total mobilisation during April-June 2008, lower than the corresponding period of the previous year (39.1 per cent). Resource mobilisation through financial intermediaries (both from public sector and private sector) registered a decline of 29.9 per cent over the corresponding period of last year, accounting for 53.1 per cent of the total mobilisation during April-June 2008. Resources raised by non-financial intermediaries also declined by 32.6 per cent (47.0 per cent of total resource mobilisation) during April-June 2008 over the corresponding period of last year.
During April-September 2008, the resources raised through Euro issues –American Depository Receipts (ADRs) and Global Depository Receipts (GDRs) – by Indian corporates declined considerably by 58.8 per cent to Rs.4,652 crore as compared with the corresponding period of the previous year. All the Euro issues during April-September 2008 were GDR issues (Table 47).
During April-September 2008, net mobilisation of funds by mutual funds declined sharply by 97.7 per cent to Rs. 2,477 crore attributed to the uncertain conditions prevailing in the stock markets (Table 48). Net outflows were witnessed under both the income/debt-oriented schemes and growth/equity-oriented schemes.
Secondary Market
The performance of the domestic stock markets during the first half of 2008-09 witnessed four distinct phases (Chart 37). In the first phase between April 1 and May 21, 2008, the markets staged recovery. On May 21, 2008, the BSE Sensex registered gains of 10.2 per cent over end-March 2008. The upward trend was attributed to better than expected fourth quarter results of 2007-08 declared by IT majors, net purchases by FIIs in the Indian equity market and some easing of international crude oil prices.
Table 48 : Resource Mobilisation by Mutual Funds |
(Rupees crore) |
|
April-March |
April-September |
Category |
2007-08 |
2007-08 |
2008-09 |
|
Net |
Net |
Net |
Net |
Net |
Net |
|
Mobilisation@ |
Assets # |
Mobilisation @ |
Assets # |
Mobilisation @ |
Assets # |
1 |
2 |
3 |
4 |
5 |
6 |
7 |
Private Sector |
1,33,304 |
4,15,621 |
95,845 |
3,93,431 |
-2,667 |
3,95,074 |
Public Sector * |
20,498 |
89,531 |
9,768 |
83,558 |
5,144 |
88,205 |
Total |
1,53,802 |
5,05,152 |
1,05,613 |
4,76,989 |
2,477 |
4,83,279 |
@: Net of redemptions.
#: End-period.
*: Including UTI Mutual fund.
Note: Data exclude funds mobilised under Fund of Funds Schemes.
Source: Securities and Exchange Board of India. |
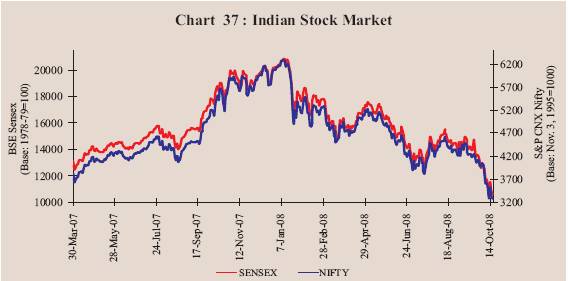
In the second phase between May 22 and July 16, 2008, the market sentiment turned cautious on account of increase in international crude oil prices, hike in domestic retail fuel prices, rise in domestic inflation rate, net sales by FIIs in the Indian equity market, concerns over rising trade deficit and depreciation of the rupee, downward trend in major international equity markets, domestic political uncertainties and other sector and stock-specific news. The BSE Sensex closed at 12576 on July 16, 2008.
In the third phase from July 17, 2008 to first week of September 2008, domestic stock markets recovered notwithstanding some intermittent corrections, on account of restoration of domestic political stability and decline in international crude oil prices. As a result, both the BSE Sensex and the S&P CNX Nifty closed higher at 14945 and 4482, respectively, on September 08, 2008, registering gains of 18.8 per cent and 17.4 per cent, respectively, over their July 16, 2008 levels. However, both the BSE Sensex and the S&P CNX Nifty recorded losses of 4.5 per cent and 5.3 per cent, respectively, over their end-March 2008 levels.
In the fourth phase beginning from the second week of September 2008, domestic stock markets turned volatile, reflecting decline in the international stock markets triggered by bankruptcy/sell-out/restructuring of some of the world’s largest financial institutions resulting in severe disruptions in international financial markets, heavy net sales by FIIs, sharp fall in the value of rupee, decline in global metal prices and slowdown in industrial growth. The BSE Sensex reached a low of 9975 on October 17, 2008. Efforts were made by Governments and central banks worldwide to restore normalcy in financial markets. In India, the Government, the Reserve Bank and the Securities and Exchange Board of India (SEBI) took several measures to ease liquidity through reduction of CRR, conduct of special 14-day repo to enable banks to meet liquidity requirements of mutual funds, reduction of repo rate, relaxation of external commercial borrowing norms for infrastructure companies and easing of restrictions on issue of participatory notes by FIIs against securities, including derivatives, as underlying. As a result of these measures, the stock markets made some recovery. Both the BSE Sensex and the S&P CNX Nifty closed at 10223 and 3122, respectively, on October 20, 2008, registering losses of 34.7 per cent and 34.0 per cent, respectively, over their end-March 2008 levels. Between end-March 2008 and October 20, 2008, the BSE Sensex moved in a range of 9975-17600.
According to the data released by the SEBI, FIIs made net sales of Rs.32,298 crore (US$ 8,006 million) in the Indian equity market during 2008-09 (up to October 13, 2008) as against net purchases of Rs.61,992 crore (US$ 15,061 million) during the corresponding period of the previous year (Chart 38). Mutual funds, on the other hand, made net purchases of Rs.6,452 crore during 2008-09 (up to October 13, 2008) as compared with net purchases of Rs.3,265 crore during the corresponding period of last year.
The sectoral indices witnessed a downward trend during the current financial year (up to October 14, 2008) (Table 49). Selling pressure was witnessed across the board, viz., metal, consumer durables, capital goods, auto, oil and gas, public sector undertakings, banking, IT, fast moving consumer goods and healthcare sector stocks.
In tandem with the downward trend in stock prices, the price-earnings (P/E) ratios of the 30 scrips included in the BSE Sensex declined from 20.1 at end-March 2008 to 16.2 at end-September 2008. The market capitalisation of the BSE also declined by 18.9 per cent between end-March 2008 and end-September 2008. The turnover of both BSE and NSE in the cash segment during April-September 2008, however, rose by 16.7 per cent over that in the corresponding period of 2007. The turnover in the derivative segment of both BSE and NSE also increased by 10.6 per cent during April-September 2008 over the corresponding period of the previous year. The volatility in the stock market measured as coefficient of variation, also increased during April-September 2008 (Table 50).
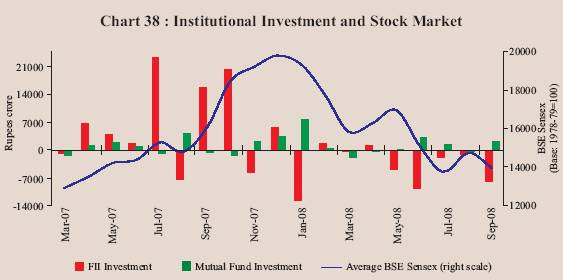
Table 49: BSE Sectoral Stock Indices |
(Base: 1978-79=100) |
Sector |
Variation (per cent) |
|
End-March 2007 @ |
End-March 2008 @ |
October 14, 2008 # |
1 |
2 |
3 |
4 |
Fast Moving Consumer Goods |
-21.4 |
31.7 |
-15.2 |
Public Sector Undertakings |
-3.2 |
25.4 |
-22.5 |
Information Technology |
21.6 |
-27.6 |
-17.1 |
Auto |
-8.5 |
-7.1 |
-24.2 |
Oil and Gas |
30.5 |
56.0 |
-23.9 |
Metal |
-4.3 |
65.2 |
-51.1 |
Health Care |
-5.4 |
5.4 |
-11.5 |
Bankex |
24.2 |
18.0 |
-21.8 |
Capital Goods |
11.1 |
54.4 |
-36.6 |
Consumer Durables |
11.1 |
8.8 |
-40.0 |
BSE 500 |
9.7 |
24.3 |
-30.9 |
BSE Sensex |
15.9 |
19.7 |
-26.6 |
@: Year-on-year variation.
#: Variation over end-March 2008.
Source: Bombay Stock Exchange Limited. |
Table 50: Stock Market Indicators |
Indicator |
BSE |
NSE |
|
2006-07 |
2007-08 |
April-September |
2006-07 |
2007-08 |
April-September |
|
|
|
2007 |
2008 |
|
|
2007 |
2008 |
1 |
|
2 |
3 |
4 |
5 |
6 |
7 |
8 |
9 |
1. |
BSE Sensex / S&P CNX Nifty |
|
|
|
|
|
|
|
|
|
(i) End-period |
13072 |
15644 |
17291 |
12860 |
3822 |
4735 |
5021 |
3921 |
|
(ii) Average |
12272 |
16569 |
14679 |
15059 |
3572 |
4897 |
4300 |
4511 |
2. |
Coefficient of Variation |
11.1 |
13.7 |
6.2 |
8.7 |
10.4 |
14.4 |
5.9 |
8.3 |
3. |
Price-Earning Ratio @ |
20.3 |
20.1 |
23.3 |
16.2 |
18.4 |
20.6 |
22.6 |
16.9 |
4. |
Price-Book Value Ratio*@ |
5.1 |
5.2 |
5.5 |
3.4 |
4.9 |
5.1 |
5.4 |
3.3 |
5. |
Yield* (per cent per annum)@ |
1.3 |
1.0 |
1.0 |
1.4 |
1.3 |
1.1 |
1.1 |
1.5 |
6. |
Listed Companies |
4,821 |
4,887 |
4,871 |
4,926 |
1,228 |
1,381 |
1,319 |
1,424 |
7. |
Cash Segment Turnover |
|
|
|
|
|
|
|
|
|
(Rupees crore) |
9,56,185 |
15,78,856 |
6,27,022 |
6,82,658 |
19,45,285 |
35,51,038 |
13,34,318 |
16,05,906 |
8. |
Derivative Segment
Turnover (Rupees crore) |
59,007 |
2,42,308 |
1,12,316 |
11,984 |
73,56,242 |
1,30,90,478 |
52,90,968 |
59,63,895 |
9. |
Market Capitalisation
(Rupees crore) @ |
35,45,041 |
51,38,015 |
52,02,955 |
41,65,388 |
33,67,350 |
48,58,122 |
48,86,561 |
39,00,185 |
10.Market Capitalisation to
GDP Ratio (per cent)@ |
85.5 |
109.5 |
121.2 |
85.3 |
81.2 |
103.1 |
113.9 |
79.9 |
|
|
|
|
|
|
|
|
|
|
* : Based on 30 scrips included in the BSE Sensex and 50 scrips included in the S&P CNX Nifty.
@: As at end-period.
Source: Bombay Stock Exchange Ltd. (BSE) and National Stock Exchange of India Ltd. (NSE). |
1 A detailed account of the financial market developments during April-June 2008 was covered in the Macroeconomic and Monetary Developments: First Quarter Review 2008-09.
2 World Economic Outlook, and Global Financial Stability Report, International Monetary Fund, October 2008. |
 IST,
IST,


