 IST,
IST,
V. Financial Markets
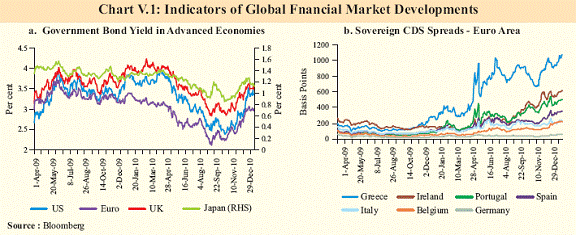
The global financial market conditions largely reflected concerns relating to sovereign debt in the Euro-zone, ample global liquidity resulting from quantitative easing (QE2) in the US and uncertain growth outlook in other advanced economies. Indian markets functioned in an orderly manner although there was a rise in equity prices in the third quarter of 2010-11, partly driven by higher portfolio flows, in line with the trend in other EMEs. In January 2011, equity prices moderated, partly reflecting market expectations of tighter monetary policy in response to higher inflation. The forex market also remained orderly and witnessed two way movements. Severe tightness in liquidity that developed in the last few months of 2010 impacted rates in different segments of the money market. The interest rates/yields on overnight, CPs, CDs, CBLO, Treasury Bills, government dated securities and bank deposits increased. Housing prices in major cities rose in general in the second quarter of 2010-11 and to contain excessive leveraging in the housing sector, the Reserve Bank tightened prudential measures for housing credit. Global asset price trends and capital inflows influenced the domestic markets V.1 Renewed concerns regarding sovereign debt crisis in the Euro area and the multi-paced global recovery dominated global financial markets, which underpinned frequent re-pricing of risks. The emerging market economies (EMEs) attracted greater portfolio flows in search of better returns, given the easy availability of liquidity in developed countries especially after the announcement of QE2. These flows, in turn, exerted upward pressures on currencies and asset prices in EMEs, leading some of these economies to resort to macroprudential measures and soft capital controls. V.2 The Indian financial markets remained orderly, notwithstanding the impact of global developments and tight liquidity conditions in domestic markets. Call rate firmed up in step with policy rates and tight liquidity conditions. It mostly remained above the upper bound of the LAF corridor during the third quarter of 2010-11. Both commercial paper (CP) and certificate of deposit (CD) markets remained active as alternative sources of finance. The yield curve for Government Securities (G-Sec) shifted, reflecting expectation of policy rate changes in an inflationary environment. The Indian Rupee appreciated moderately against the US dollar and stock prices rose on the back of strong foreign portfolio inflows. Prices in the housing market in general continued the rising trend during the second quarter of 2010-11. Frequent re-pricing of risks in the international financial markets reflected persisting uncertainties V.3 Sovereign risks in the Euro-area resurfaced during the fourth quarter of 2010 which resulted in higher G-Sec yields and widening of CDS spreads (Charts V.1 a and b). Increased capital inflows into the EMEs exerted upward pressures on their currencies and equity prices (Table V.1). V.4 Indian financial markets, particularly the equity and foreign exchange markets were impacted by the global developments. Widening interest rate differential due to divergent monetary policies followed by advanced economies and India led corporates to take greater recourse to external commercial borrowings (ECBs). Easy global liquidity and the strong growth prospects of the Indian economy encouraged inflows from foreign institutional investors (FIIs) seeking higher returns. The rupee appreciated against major currencies during the beginning of the third quarter of 2010-11, mainly due to strong FII inflows, but corrected subsequently, in line with the movement of the US dollar vis-a-vis other major currencies and moderation of FII inflows (Table V.2).
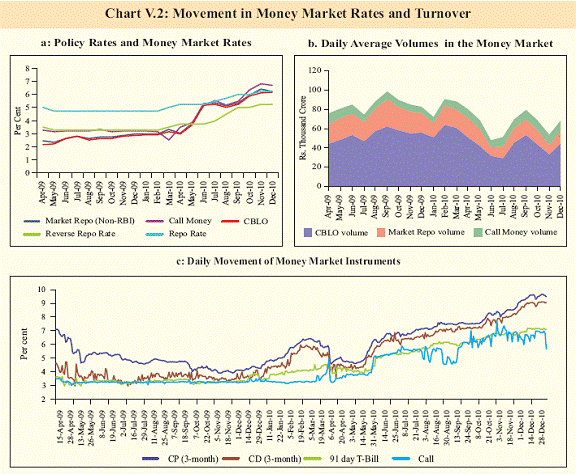
Policy measures were taken to manage liquidity conditions as money market rates hardened V.5 During the third quarter of 2010-11, there was a tightening of liquidity on account of persistence of large government cash balances, above-trend currency expansion and mismatch between growth in bank credit and deposits. The call rate mostly remained above the upper bound of the LAF corridor during the third quarter, reflecting the tight liquidity conditions (Chart V.2a). The rates in the collateralised segments (which accounted for more than 80 per cent of the total volume) generally moved in tandem, with the call rate albeit below it. In order to stabilise overnight inter-bank rates closer to the operative policy rate, the Reserve Bank implemented liquidity management measures (see Table IV.2 of Chapter IV for details). The activity in the collateralised borrowing and lending obligation (CBLO) and market repo segments showed marginal moderation vis-avis the uncollateralised market, reflecting demand for funds in excess of available securities for collateral backing (Chart V.2b). Secondary market yields on CDs and CPs witnessed higher increases by the end of the third quarter as compared to the overnight rates as well as the Treasury Bills of comparable maturity (Table V.3, Chart V.2c).
V.6 The average fortnightly issuance of CDs during the third quarter was higher than that in the previous quarter; issuances of CPs also increased as companies accessed alternative avenues for funds, given the tight liquidity conditions. Leasing and finance, and manufacturing companies continued to be the major issuers of CPs (Table V.4). The Weighted Average Effective Interest Rate (WAEIR) on CDs and Weighted Average Discount Rate (WADR) of CPs in the primary markets increased during the third quarter reflecting demand for funds.
V.7 The yield on Treasury Bills in the primary market firmed up during the third quarter of 2010-11 (Table V.5). The calendar for issuance of Treasury Bills for the fourth quarter of 2010- 11, released on December 31, 2010, projected mobilisation of `17,000 crore, over and above the rollover during the quarter.
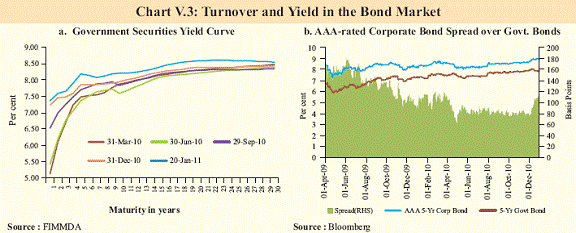
G-Sec yield curve shift reflects expectation of policy rate changes in an inflationary environment V.8 The prevalence of tight liquidity conditions and expectations of further hike in the Reserve Bank’s policy rates were reflected in an upward movement in primary as well as secondary yields for short and medium-term GSecs during the third quarter. Though long-term yields remained range-bound, the short-term and medium-term yields eased temporarily in November, reflecting improvement in liquidity conditions due to reduction in Government cash balances and OMO purchases of G-Sec by the Reserve Bank. In January 2011, the short-term as well as long-term yields have again hardened on inflation concerns (Chart V.3a). The average daily turnover of G-Sec in the secondary market declined during the third quarter of 2010-11. V.9 The spreads on five-year corporate bonds over the corresponding government bond yield hovered in a narrow range of 73-85 basis points during October-November 2010, but increased during the second half of December 2010, partly reflecting the deficit liquidity conditions (Chart V.3b). V.10 Taking into account the need for fiscal consolidation and the strong buoyancy in tax and non-tax revenue (particularly receipts under 3G spectrum auctions), the indicative calendar for the issuance of dated securities during the second half of 2010-11 was scaled down by ` 10,000 crore. Nearly 89 per cent of the GOI’s gross market borrowing programme for 2010- 11 was completed during the year (up to January 19, 2011). Both the average maturity of debt issuances and weighted average yield increased during 2010-11 (up to January 19, 2011), as compared with the corresponding period of the previous year (Table V.6). Despite hardening of yields, investors’ sentiment remained positive, as evident from the bid-cover ratio of the auctions that stood in the range of 1.4-3.9 during 2010-11 so far and 1.7-3.1 during the third quarter. As the yield curve flattened at the longer end, more long dated securities were issued during the second half so far, taking advantage of the yield curve movements.
V.11 As regards State Government market borrowings, about 50 per cent of the gross allocations for the States for 2010-11 were raised by 22 States up to January 19, 2011 as compared with nearly 90 per cent of the gross borrowings raised during the comparable period of 2009- 10. Taking into account the comfortable cash balances of the State Governments coupled with buoyant National Savings Scheme Fund (NSSF) flows there may be a moderation in their borrowings for 2010-11. Weighted average yields on market borrowings went up by 34 basis points so far during 2010-11. The credit market exhibits strengthening of monetary policy transmission V.12 The scheduled commercial banks (SCBs) raised the deposit rates to step up their deposit mobilisation to support the high credit growth (Table V.7). Several banks revised their base rates upwards in the range of 25-100 basis points during July-January 17, 2011. Forty SCBs also increased their BPLR in the range of 50-150 bps during July-January 17, 2010.
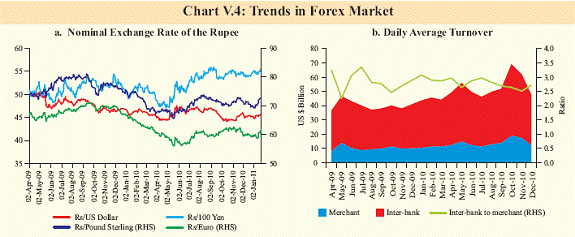
The forex market remains orderly, despite larger capital inflows V.13 The Indian rupee exhibited a two-way movement against major international currencies with minimal intervention or capital account management during the third quarter of 2010-11(Chart V.4a). With the sharp appreciation of the rupee during October 2010, forward premia firmed up across maturities, reflecting the increased demand for forward cover. Forward premia eased subsequently, but remained higher than in the first two quarters of 2010-11. The turnover in both inter-bank and merchant segments of the forex market increased in October 2010 but declined thereafter (Chart V.4b).
V.14 The offshore market for Indian Rupee grew in size in the past five years reflecting the increasing globalisation of the economy, and the need for non-residents to hedge the rupee risk in their portfolio. The preliminary triennial central bank survey results published by the Bank for International Settlements (BIS) in April 2010 shows that more than half of the average daily turnover in forex derivatives on Indian Rupees took place offshore. Trading volumes in currency futures, which had spiked in September 2010, with the commencement of operations by the United Stock Exchange of India (USEI), declined thereafter up to December 2010. The volumes recovered in January 2011, so far.
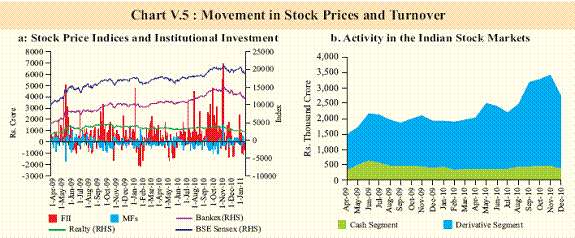
Volatile equity markets reflect largely the impact of volatile portfolio flows V.15 The Indian equity markets remained volatile, in line with the global trend during the third quarter of 2010-11. Strong domestic fundamentals helped in attracting FII flows in equities, even though mutual funds turned net sellers. However, as concerns relating to Ireland’s debt rating resurfaced in November 2010, the volume of FII support to the equity markets declined considerably since the last week of the month. The market regained some strength by the end of the third quarter, in view of strong growth prospects of the Indian economy and expectations of encouraging corporate results (Table V.8). As compared to the rise in the benchmark BSE Sensex by 2.2 per cent during the third quarter, the banking and reality indices declined by 4.6 per cent and 23.4 per cent, respectively, in view of the concerns relating to the banks’ financing of the reality sector (Chart V.5a). In the recent period, particularly from the beginning January 2011, equity markets have witnessed some correction in anticipation of policy response to high inflation. FIIs turned net sellers in 2011 (up to January 19). V.16 The activity in the primary segment of the domestic capital market continued to display signs of buoyancy during October-November 2010. Resources raised through public issues increased considerably during April-December 2010 as compared to the corresponding period last year (Table V.9). There was a net outflow of resources mobilised by mutual funds during April-December 2010 as compared to an inflow during the corresponding period of the previous year due to tight liquidity conditions exerting pressure on redemptions. Mobilisation of resources through private placement increased by 2.7 per cent during April-September 2010 largely on account of debt issuances by the financial companies. V.17 The FIIs were net buyers and mutual funds turned net sellers during April- December 2010 and this trend reversed in January 2011 (up to January 11) (Chart V.5a). Net FII investment in Indian equities increased strongly during the first two months of the third quarter, while investment in debt remained subdued. FII investments, however, witnessed some slowdown in December 2010, mainly on account of year-end redemption pressures which resulted in a moderation of turnover in both cash and derivative segments (Chart V.5b).
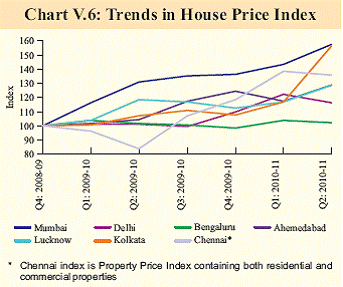
Rise in property prices continues V.18 Property prices continued to rise in most cities during the second quarter of 2010-11, as reflected in the quarterly House Price Index (HPI) based on data collected from the Department of Registration and Stamps (DRS). However, property prices in Delhi and Chennai recorded some moderation (Chart V.6). In November 2010, with a view to preventing excessive leveraging, the Reserve Bank had tightened the prudential norms for housing credit. While orderly financial markets would support the growth momentum, liquidity conditions would reflect the antiinflationary stance V.19 During the third quarter of 2010-11, the interest rates in most segments of financial markets shot up, mainly reflecting the deficit liquidity conditions. Going forward, the recent substantial easing of liquidity conditions on account of policy actions initiated by the Reserve Bank and reduction in the unusually high Government balances may reduce the pressure on the rates. The expected continuation of the robust growth momentum suggests that demand for financing economic activities would increase, which have to be met by banks and markets in a more competitive environment. Banks would have to respond to the structural mismatch between deposit and credit growth through appropriate rate adjustments. The risk of volatile portfolio flows impacting asset prices and exchange rate could be expected to persist, while maintaining orderly conditions in various segments of the financial markets would continue to be a policy priority.
|
|||||||||||||||||||||||||||||||||||||||||||||||||||||||||||||||||||||||||||||||||||||||||||||||||||||||||||||||||||||||||||||||||||||||||||||||||||||||||||||||||||||||||||||||||||||||||||||||||||||||||||||||||||||||||||||||||||||||||||||||||||||||||||||||||||||||||||||||||||||||||||||||||||||||||||||||||||||||||||||||||||||||||||||||||||||||||||||||||||||||||||||||||||||||||||||||||||||||||||||||||||||||||||||||||||||||||||||||||||||||||||||||||||||||||||||||||||||||||||||||||||||||||||||||||||||||||||||||||||||||||||||||||||||||||||||||||||||||||||||||||||||||||||||||||||||||||||||||||||||||||||||||||||||||||||||||||||||||||||||||||||||||||||||||||||||||||||||||||||||||||||||||||||||||||||||||||||||||||||||||||||||||||||||||||||||||||||||||||||||||||||||||||||||||||||||||||||||||||||||||||||||||||||||||||||||||||||||||||||||||||||||||||||||||||||||||||||||||||||||||||||||||||||||||||||||||||||||||||||||||||||||||||||||||||||||||||||||||||||||||||||||||||||||||||||||||||||||||||||||||
पेज अंतिम अपडेट तारीख:


