 IST,
IST,


V. Financial Markets
Financial market conditions remained benign as long-term rates in major advanced economies were broadly unchanged and equity markets remained buoyant. Short-term interest rates, however, moved up in a number of economies with the firming up of inflationary pressures. Financing conditions in emerging markets also remained favourable reflecting improved economic fundamentals, the increased presence of long-term investors and continued search for yields. At the same time the current benign environment of low long-term rates and flat yield curves is believed to have contributed to larger global imbalances and higher levels of debt, particularly by the household sector, thus, increasing potential vulnerabilities.
Short-term interest rates rose further during the second quarter across a number of countries, especially emerging economies. The US Federal Reserve raised Federal Funds target rate by 25 basis points for the 11th consecutive time to 3.75 per cent on September 20, 2005. In a few countries such as the UK and Sweden, short-term interest rates softened further during the second quarter in the face of a weakening of economic activity (Table 31).
In contrast to the behaviour of short-term rates, long-term government bond yields in the US have been almost unchanged since end-March 2005 leading to a flattening of the yield curve. Yields had initially declined during April-June
Table 31: Short-term Interest Rates
|
(Per cent) |
||||
|
Country |
March 2004 |
March 2005 |
June 2005 |
September 2005 |
|
1 |
2 |
3 |
4 |
5 |
|
Advanced Economies |
||||
|
Euro Area |
1.96 |
2.15 |
2.10 |
2.15 |
|
Japan |
0.03 |
0.02 |
0.02 |
0.02 |
|
Sweden |
2.12 |
1.97 |
1.48 |
1.46 |
|
UK |
4.31 |
4.95 |
4.75 |
4.56 |
|
US |
1.04 |
2.90 |
3.33 |
3.85 |
|
Emerging Market Economies |
||||
|
Argentina |
2.88 |
4.56 |
6.94 |
6.69 |
|
Brazil |
16.02 |
19.25 |
19.74 |
19.51 |
|
China |
n.a. |
2.25 |
2.30 |
4.38 |
|
Hong Kong |
0.17 |
2.79 |
3.36 |
4.12 |
|
India |
4.24 |
5.37 |
5.37 |
5.49 |
|
Malaysia |
3.00 |
2.82 |
2.87 |
2.92 |
|
Philippines |
9.19 |
7.25 |
5.88 |
8.13 |
|
Singapore |
0.69 |
2.06 |
2.06 |
2.34 |
|
South Korea |
3.90 |
3.54 |
3.52 |
3.94 |
|
Thailand |
1.31 |
2.64 |
2.75 |
3.90 |
|
n.a. : Not available. |
||||
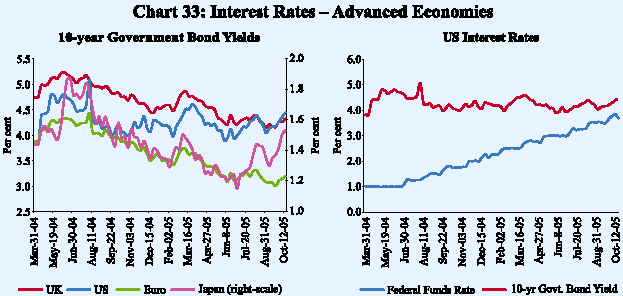
2005 on expectations that monetary authorities could slow down policy tightening due to fragility in the economic recovery (Chart 33). Structural factors such as increased demand for fixed income products from pension funds and insurance companies in response to regulatory changes also provided support to long-term gilts. In the US, the 10-year Treasury yield at 3.8 per cent was at a 14-month low in early-June 2005. Japanese and Euro area bond yields also dropped to record lows in June 2005. Similarly, yield curves in Australia, New Zealand and the UK flattened or inverted. During July 2005, yields, however, firmed up in the run up to the widely anticipated revaluation of the Chinese currency on July 21, 2005. Yields edged up on the expectation that the revaluation will moderate foreign exchange reserves accretion of China and other Asian central banks which, in turn, might reduce demand for US dollar assets by these central banks. With the Chinese authorities continuing to manage the renminbi tightly, the yields, however, reversed their increasing trend. More recently, yields in the US have again firmed up on signs of strong growth and upward revisions to the expected path of policy rates.
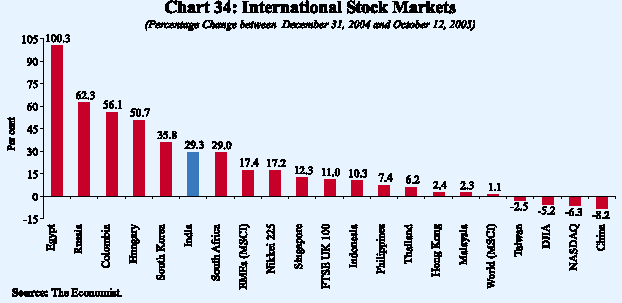
Equity markets exhibited resilience against higher oil prices and witnessed rallies reflecting strong corporate profitability. During the calendar year 2005 so far (up to October 12, 2005), stock markets in India have outperformed all major Asian markets excepting South Korea (Chart 34). Stock markets in some emerging economies outside Asia yielded even higher returns led by Egypt (100.3 per cent since end-December 2004), followed by Russia, Colombia and Hungary.
The US dollar has appreciated against major currencies during 2005-06 so far, reflecting growing interest and growth differential in favour of the US and uncertainty relating to growth prospects in the Euro area (Chart 35). The US dollar, however, slid during July-August 2005 as the market’s focus returned to structural concerns, namely the twin budget and external deficits in the US. The
long anticipated revaluation of the Chinese renminbi on July 21, 2005 was received calmly, with little lasting impact in the financial markets. The renminbi has appreciated little since the July revaluation.
Indian financial markets have remained broadly stable during 2005-06 so far. Comfortable liquidity kept money market segments generally around the reverse repo rate. The foreign exchange market remained more or less orderly. Yields in the Government securities market which had hardened in April 2005 reflecting higher crude oil prices and increase in the reverse repo rate have since been range bound. In the credit market, key interest rates edged up as commercial credit offtake continued to remain strong and broad-based. The primary market
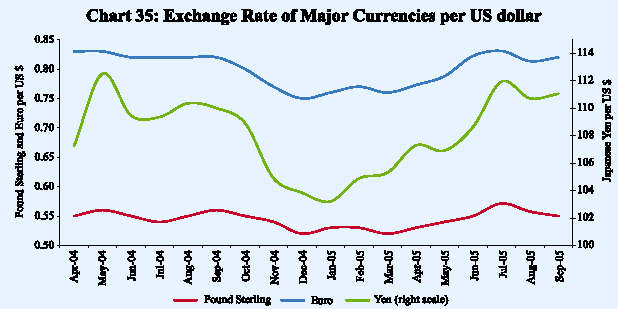
Table 32: Domestic Financial Markets at a Glance
|
Month |
Call Money |
Govt. Securities |
Foreign Exchange |
Liquidity |
Equity |
|||||||||||
|
Management |
||||||||||||||||
|
Average |
Average |
Average |
Average |
Average |
Average |
RBI’s net |
Average |
Average |
Average |
Average |
Average |
Average |
Average |
|||
|
Daily |
Call |
10-Year |
Daily |
Daily |
Exchange |
Foreign |
Forward |
MSS |
Daily |
Daily |
Daily |
BSE |
S&P |
|||
|
Turnover |
Rates* |
Yield@ |
Turnover |
Inter- |
Rate |
Currency |
Premia |
Outstan- |
Reverse |
BSE |
NSE |
Sensex** |
CNX |
|||
|
(Rs. |
(Per |
(Per |
(Rs. |
bank |
(Rs.per |
Sales(-)/ |
3-month |
ding # |
Repo |
Turnover |
Turnover |
Nifty** |
||||
|
crore) |
cent) |
cent) |
crore)+ |
Turnover |
US $) |
Purchases |
(Per |
(Rs. |
(LAF) |
(Rs. |
(Rs. |
|||||
|
(US $ |
(+) |
cent) |
crore) Outstanding |
crore) |
crore) |
|||||||||||
|
million) |
(US $ |
(Rs. |
||||||||||||||
|
million) |
crore) |
|||||||||||||||
|
1 |
2 |
3 |
4 |
5 |
6 |
7 |
8 |
9 |
10 |
11 |
12 |
13 |
14 |
15 |
||
|
2004-05 |
||||||||||||||||
|
April |
12,916 |
4.29 |
5.10 |
10,029 |
10,302 |
43.93 |
7,427 |
- 0.35 |
14,296 |
75,006 |
2,243 |
5,048 |
5809 |
1848 |
||
|
May |
10,987 |
4.30 |
5.19 |
6,202 |
8,882 |
45.25 |
-220 |
-1.33 |
27,518 |
74,502 |
2,188 |
4,710 |
5205 |
1640 |
||
|
June |
10,973 |
4.35 |
5.50 |
5,860 |
7,847 |
45.51 |
-413 |
0.93 |
35,183 |
61,981 |
1,681 |
3,859 |
4824 |
1506 |
||
|
July |
8,632 |
4.31 |
5.91 |
4,206 |
7,756 |
46.04 |
-1,180 |
2.25 |
43,739 |
59,594 |
1,793 |
4,265 |
4973 |
1568 |
||
|
August |
11,562 |
4.41 |
6.38 |
4,173 |
5,947 |
46.34 |
-876 |
2.85 |
48,541 |
42,692 |
1,736 |
3,948 |
5144 |
1615 |
||
|
September |
17,088 |
4.45 |
6.08 |
5,854 |
7,348 |
46.09 |
19 |
2.20 |
52,421 |
31,589 |
1,800 |
4,023 |
5423 |
1692 |
||
|
October |
16,667 |
4.63 |
6.73 |
3,636 |
7,262 |
45.78 |
-99 |
2.87 |
53,660 |
10,805 |
1,730 |
3,785 |
5702 |
1795 |
||
|
November |
13,820 |
5.62 |
7.14 |
2,607 |
9,930 |
45.13 |
3,792 |
2.20 |
54,157 |
-5,066 |
1,787 |
4,102 |
5961 |
1874 |
||
|
December |
19,527 |
5.28 |
6.73 |
4,305 |
9,447 |
43.98 |
1,393 |
2.02 |
52,085 |
7,570 |
2,184 |
5,026 |
6394 |
2022 |
||
|
January |
16,534 |
4.72 |
6.68 |
3,566 |
9,114 |
43.75 |
0 |
2.50 |
53,790 |
18,721 |
2,310 |
5,249 |
6307 |
1978 |
||
|
February |
16,041 |
4.76 |
6.58 |
4,640 |
11,583 |
43.68 |
4,974 |
1.99 |
58,141 |
19,895 |
2,484 |
4,999 |
6595 |
2067 |
||
|
March |
15,293 |
4.72 |
6.65 |
2,835 |
11,286 |
43.69 |
6,030 |
1.82 |
63,737 |
29,809 |
2,706 |
5,139 |
6679 |
2096 |
||
|
2005-06 |
||||||||||||||||
|
April |
17,213 |
4.77 |
7.02 |
3,001 |
9,880 |
43.74 |
0 |
1.96 |
65,638 |
30,675 |
1,890 |
4,136 |
6379 |
1987 |
||
|
May |
15,269 |
4.99 |
7.13 |
3,805 |
10,083 |
43.49 |
0 |
1.57 |
68,539 |
22,754 |
1,971 |
3,946 |
6483 |
2002 |
||
|
June |
20,135 |
5.10 |
6.88 |
6,807 |
10,871 |
43.58 |
-104 |
1.40 |
70,651 |
13,916 |
2,543 |
4,843 |
6926 |
2134 |
||
|
July |
20,046 |
5.02 |
7.12 |
3,698 |
10,812 |
P |
43.54 |
2,473 |
1.56 |
70,758 |
10,754 |
3,095 |
6,150 |
7337 |
2237 |
|
|
August |
16,158 |
5.02 |
7.04 |
4,239 |
11,462 |
P |
43.62 |
1,552 |
0.69 |
71,346 |
34,832 |
3,452 |
6,624 |
7726 |
2358 |
|
|
September |
16,292 |
5.05 |
7.04 |
5,207 |
9,750 |
P |
43.92 |
n.a. |
0.62 |
67,617 |
31,570 |
3,871 |
6,923 |
8272 |
2512 |
|
|
*:Average of daily weighted call money borrowing rates. |
||||||||||||||||
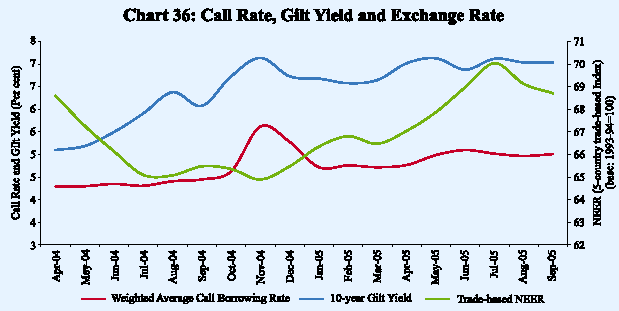
segment of the equity market gathered momentum with increase in both the number of issues and the resources raised on the back of a buoyant secondary market and strong macroeconomic fundamentals. The secondary market staged a strong rally which pushed the BSE Sensex to new highs touching 8800 mark in early-October 2005 (Table 32 and Chart 36).
Money Market
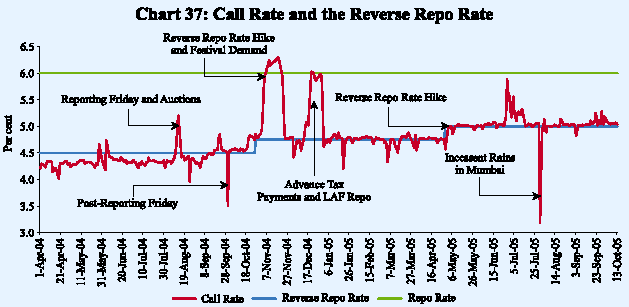
Money markets during 2005-06 so far have been marked by comfortable liquidity conditions stemming from the overhang in the system outstanding Liquidity Adjustment Facility (LAF) and Market Stabilisation Scheme (MSS) balances at end-March 2005 stood at Rs.83,541 crore. Despite FII outflows in April 2005, the Reserve Bank had to supplement reverse repo operations with sale of Government paper under the MSS to absorb liquidity and balance market conditions. Average daily call money borrowing rates ruled at sub-reverse repo rate levels on many occasions. With the increase in the fixed reverse repo rate by 25 basis points on April 29, 2005, call rates also edged up by a similar magnitude. Towards the end of June 2005, call rates rose above the reverse repo rate under liquidity pressures – average balances under LAF reverse repos fell from Rs.22,754 crore during May 2005 to Rs.13,916 crore during June 2005 – emanating from advance tax payments and scheduled Treasury Bills auctions. The Reserve Bank injected Rs.210 crore and Rs.575 crore under the LAF repo on June 28, 2005 and June 30, 2005, respectively, to assuage the demand pressures. On a net basis, however, there was liquidity absorption on these days.
Liquidity conditions improved by the second half of July 2005 due to cancellation of some scheduled Treasury Bills auctions and return of advance tax payments to the banking system. Large foreign currency purchases from the authorised dealers during July-August 2005 also improved liquidity conditions and this was reflected in a jump in average balances under LAF reverse repos from Rs.10,754 crore in July to Rs.34,832 crore in August 2005. The call money market, thus, remained broadly stable during August 2005 and the first half of September 2005. During the second half of September 2005 the call money market witnessed mild pressure, reflecting advance tax outflows and scheduled auctions. The Reserve Bank injected Rs.1,640 crore and Rs.1,000 crore under the LAF repo on September 28, 2005 and September 29, 2005, respectively. On a net basis, however, there was liquidity absorption on these days. The call money rate was 5.06 per cent as on October 19, 2005 (Chart 37).
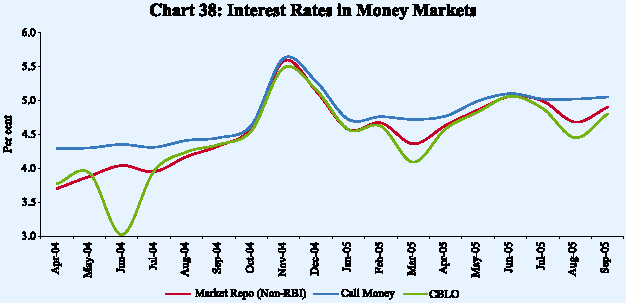
The turnover in the call/notice money market during 2005-06 so far has been range bound reflecting the process of phasing out of non-bank participants from the call money market, which was completed on August 6, 2005 (Table 33). Turnover increased during June-July due to higher activity reflecting some liquidity pressures. The emergence of alternative avenues of deployment of funds such as the market repo (other than with the Reserve Bank) and the Collateralised Borrowing and Lending Obligation (CBLO) segments which provide funds at a lower cost also explain the relative decline in call money market turnover (Chart 38). The supply of funds in the CBLO segment has been augmented by the participation of mutual funds and financial institutions. Members operating in the CBLO segment of the Clearing Corporation of India Limited (CCIL) have increased from 110 in March 2005 to 125 in early-October 2005.
Other Money Market Instruments
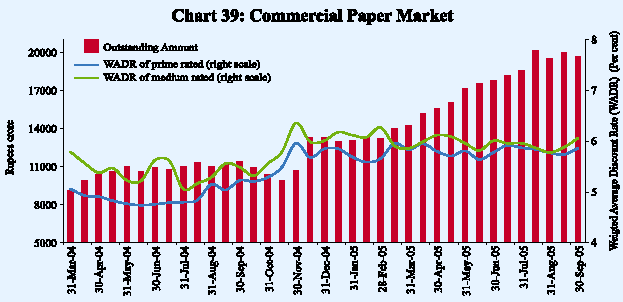
The commercial paper (CP) market remained buoyant with outstanding CPs increasing from Rs.14,235 crore at end-March 2005 to Rs.19,725 crore by September 30, 2005. Leasing and finance companies continue to be the largest
Table 33: Activity in Money Market Segments
|
(Rupees crore) |
|||||||
|
Average Daily Turnover |
Outstanding Amount |
Forward Rate |
|||||
|
Agreements/ |
|||||||
|
Month |
Call |
Term |
Repo |
Collateralised |
Commercial |
Certificates |
|
|
Interest |
|||||||
|
Money |
Money |
Market |
Borrowing |
Paper |
of Deposit |
||
|
Rate |
|||||||
|
Market |
Market |
(Outside |
and |
||||
|
Swaps |
|||||||
|
the |
Lending |
||||||
|
(Notional |
|||||||
|
LAF) |
Obligation |
||||||
|
Amount) |
|||||||
|
(CBLO) |
|||||||
|
1 |
2 |
3 |
4 |
5 |
6 |
7 |
8 |
|
2004-05 |
|||||||
|
April |
12,916 |
325 |
15,195 |
2,496 |
10,362 |
4,725 |
5,76,808 |
|
May |
10,987 |
372 |
15,932 |
3,872 |
11,038 |
4,860 |
6,11,595 |
|
June |
10,973 |
274 |
17,517 |
4,015 |
10,950 |
5,438 |
6,04,669 |
|
July |
8,632 |
445 |
19,226 |
4,508 |
11,038 |
5,478 |
5,90,118 |
|
August |
11,562 |
311 |
13,561 |
4,962 |
11,002 |
4,480 |
6,40,173 |
|
September |
17,088 |
487 |
18,178 |
6,149 |
11,371 |
5,112 |
8,53,191 |
|
October |
16,667 |
539 |
15,719 |
8,466 |
10,409 |
4,785 |
9,25,175 |
|
November |
13,820 |
407 |
18,560 |
9,651 |
10,719 |
6,118 |
9,50,151 |
|
December |
19,527 |
504 |
21,922 |
9,962 |
13,272 |
6,103 |
9,75,135 |
|
January |
16,534 |
514 |
17,556 |
7,701 |
13,092 |
4,237 |
10,14,442 |
|
February |
16,041 |
878 |
17,562 |
8,952 |
13,189 |
9,214 |
9,46,293 |
|
March |
15,293 |
1,253 |
14,688 |
9,625 |
14,235 |
12,078 |
10,62,242 |
|
2005-06 |
|||||||
|
April |
17,213 |
661 |
12,174 |
10,369 |
15,598 |
16,602 |
10,76,513 |
|
May |
15,269 |
545 |
13,688 |
12,233 |
17,182 |
17,689 |
10,72,684 |
|
June |
20,135 |
534 |
17,163 |
12,075 |
17,797 |
19,270 |
10,93,367 |
|
July |
20,046 |
717 |
18,103 |
15,291 |
18,607 |
20,768 |
12,18,072 |
|
August |
16,158 |
754 |
21,325 |
14,544 |
19,508 |
23,568 |
13,15,084 |
|
September |
16,292 |
1,116 |
18,872 |
17,143 |
19,725 |
25,604* |
13,15,306 |
|
* : As on September 16, 2005. |
|||||||
issuers of CPs, partly reflecting the phasing out of these companies from accessing public deposits. The share of these companies in the total CP outstanding increased from 59.6 per cent at end-March 2005 to 65.6 per cent by September 30, 2005. Manufacturing and other companies and financial institutions are the other issuers with shares of 19.1 per cent and 15.3 per cent, respectively, as on September 30, 2005. Despite a pick-up in issuances, the weighted average discount rate (WADR) on CPs at 5.87 per cent on September 30, 2005 was almost the same as at end-March 2005 (5.84 per cent), reflecting strong investment interest by mutual funds in an environment of comfortable liquidity (Chart 39).
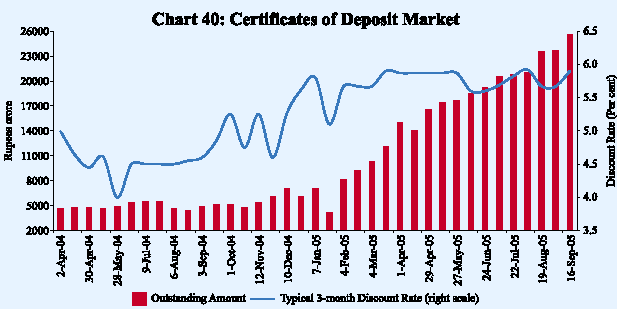
The market for certificates of deposit (CDs) has also remained buoyant during the year so far, reflecting their cost attractiveness to banks vis-à-vis time deposits as well as banks’ demand for funds in the wake of the acceleration in demand for bank credit. The outstanding CDs increased from Rs.14,975 crore in early-April 2005 to Rs.25,604 crore by September 16, 2005 mainly on account of higher issuances by some private sector banks. The higher recourse to CDs was also driven by the reduction in the minimum maturity period to seven days. Outstanding CDs were 5.4 per cent of aggregate deposits of issuing banks as on September 16, 2005, up from 1.6 per cent a year ago, indicating the growing importance of CDs as a source of funds for the issuing banks. The typical three-month discount rate on CDs at 5.90 per cent on September 16, 2005 was exactly the same as at end-March 2005 (Chart 40). As in the case of CPs, mutual funds have emerged as key investors in CDs.
Amongst other money market segments, the market for forward rate agreements and interest rate swaps (FRAs/IRS) continued to expand with the participation of select public sector banks, primary dealers (PDs) and foreign and private sector banks (see Table 33). In most of these contracts, the NSE-Mumbai Inter-Bank Offered Rate (MIBOR), Mumbai Inter-Bank Forward Offered Rate (MIFOR), secondary market yields of the Government of India securities with a residual maturity of one year and the primary cut-off yield on 364-day Treasury Bills were used as the benchmark rates.
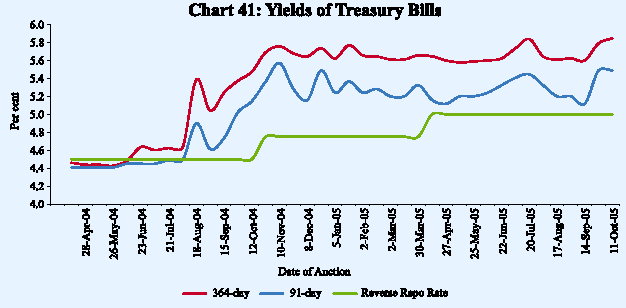
Treasury Bills
Reflecting comfortable liquidity conditions and easing of headline inflation, yields in Treasury Bills (TBs) auctions have been broadly unchanged since March 2005. Yields had edged up marginally during July 2005 reflecting some liquidity tightness. With improvement in liquidity conditions and further softening of headline inflation, bidding interest revived and average yields declined by 18-
Table 34: Treasury Bills in the Primary Market
|
Month |
Average Implicit Yield at Minimum |
Bid-Cover Ratio |
||||
|
Cut-off Price (Per cent) |
||||||
|
91-day |
182-day |
364-day |
91-day |
182-day |
364-day |
|
|
1 |
2 |
3 |
4 |
5 |
6 |
7 |
|
2004-05 |
||||||
|
April |
4.38 |
4.44 |
2.15 |
2.47 |
||
|
May |
4.39 |
4.33 |
2.93 |
2.46 |
||
|
June |
4.44 |
4.55 |
2.61 |
1.28 |
||
|
July |
4.46 |
4.60 |
2.39 |
2.06 |
||
|
August |
4.76 |
5.00 |
1.81 |
3.36 |
||
|
September |
4.72 |
5.14 |
2.51 |
2.83 |
||
|
October |
5.15 |
5.46 |
1.82 |
2.75 |
||
|
November |
5.47 |
5.71 |
2.80 |
2.64 |
||
|
December |
5.30 |
5.69 |
2.69 |
2.81 |
||
|
January |
5.31 |
5.69 |
2.19 |
2.06 |
||
|
February |
5.25 |
5.65 |
2.99 |
2.81 |
||
|
March |
5.24 |
5.63 |
2.31 |
2.74 |
||
|
2005-06 |
||||||
|
April |
5.17 |
5.36 |
5.62 |
4.03 |
4.48 |
2.54 |
|
May |
5.19 |
5.35 |
5.58 |
3.30 |
3.37 |
2.29 |
|
June |
5.29 |
5.37 |
5.61 |
1.54 |
2.42 |
1.81 |
|
July |
5.46 |
5.67 |
5.81 |
1.21 |
2.58 |
1.68 |
|
August |
5.23 |
5.42 |
5.63 |
3.07 |
2.68 |
2.54 |
|
September |
5.24 |
5.37 |
5.70 |
1.52 |
1.45 |
1.61 |
|
Note: 182-day TBs were reintroduced with effect from April 2005. |
||||||
25 basis points across the various TBs during August 2005, close to their March 2005 levels. Yields edged up marginally in the last week of September reflecting some liquidity tightness. The yield spread between the 91-day and 364-day TBs at 46 basis points during September 2005 was marginally higher than the March 2005 level (39 basis points) (Table 34 and Chart 41).
Foreign Exchange Market
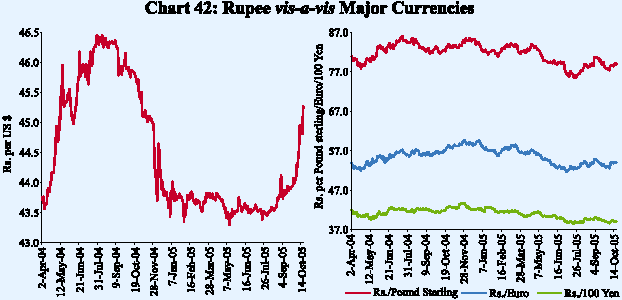
In the foreign exchange market, the Indian rupee has moved in a range of Rs.43.30–45.27 per US dollar during 2005-06 so far (up to October 19, 2005). Despite outflows by FIIs and a higher merchandise trade deficit, the rupee initially appreciated against the US dollar from Rs.43.76 at end-March 2005 to Rs.43.30 per US dollar on May 12, 2005. Subsequently, the rupee depreciated, reaching Rs.43.76 per US dollar on June 2, 2005 due to strengthening of the US dollar in the international markets. With the revaluation of the Chinese yuan on July 21, 2005, there were appreciation pressures and the rupee stood at Rs.43.56 per US dollar on August 18, 2005. The Reserve Bank made net market purchases of US $ 4.0 billion during July-August 2005. The rupee again came under pressure in the last week of August 2005 and reached Rs.44.12 per US dollar on September 1, 2005, under the impact of oil prices touching a peak of US $ 70.8 per barrel in the international market as Hurricane Katrina disrupted oil and gas production in Gulf of Mexico region in the US. Subsequently, the rupee recovered marginally and stood at Rs.44.08 on September 28, 2005. The rupee came under pressure in the first week of October 2005 in the face of sharp increase in the current account deficit, FII outflows and the strengthening of the US dollar in the international markets. The exchange rate stood at Rs.45.27 per US dollar on October 19, 2005. At this level, the Indian rupee has depreciated by 3.3 per cent over its level on March 31, 2005. Reflecting cross-currency movements, the rupee has, however, appreciated against the other major international currencies since end-March 2005: the Euro (4.8 per cent), the Pound sterling (3.9 per cent) and the Japanese yen (4.5 per cent) (Chart 42).
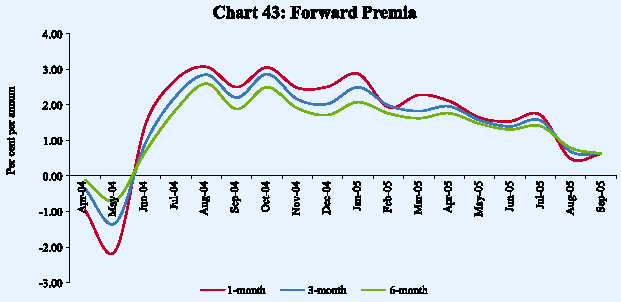
Forward premia continued to decline in tandem with narrowing interest differential following the further hikes in the US interest rates (Chart 43).
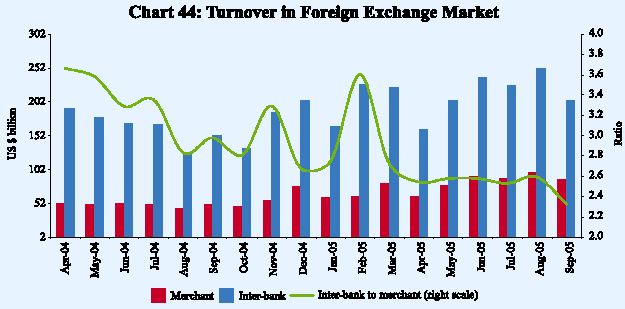
The turnover in the foreign exchange market (both merchant and inter-bank), which had dropped sharply to US $ 223.6 billion in April 2005 (US $ 305.7 billion in March 2005), recovered in the subsequent months to reach US $ 349.3 billion in August 2005. It fell again to US $ 292.8 billion in September 2005 (Chart 44).
Credit Market
The demand for credit from the commercial sector has strengthened further during 2005-06 so far (Chart 45). As on September 30, 2005, the year-on-year non-food credit extended by scheduled commercial banks grew by 31.5 per cent (net of conversion) on top of 24.9 per cent growth a year ago. Food credit recorded a marginal fall over its end-March 2005 level on account of lower procurement.
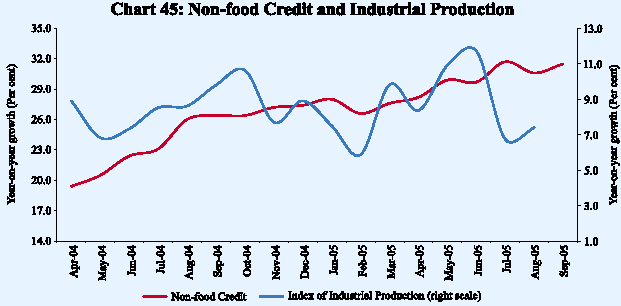
Demand for bank credit has been broad-based led by agriculture, industry and housing sectors (Table 35). The increase in industrial credit was mainly on account of infrastructure (viz., power, roads, ports and telecommunications), iron
Table 35: Deployment of Non-food Bank Credit
|
(Rupees crore) |
||||||
|
Sector/Industry |
Outstanding as on |
Year-on-year Variations |
||||
|
August 19, 2005 |
||||||
|
August 20, 2004 |
August 19, 2005 |
|||||
|
Absolute |
Per cent |
Absolute |
Per cent |
|||
|
1 |
2 |
3 |
4 |
5 |
6 |
|
|
1. |
Priority sector # |
3,81,991 |
56,744 |
25.9 |
1,05,945 |
38.4 |
|
Agriculture |
1,27,621 |
19,624 |
26.4 |
33,626 |
35.8 |
|
|
Small Scale |
73,568 |
4,610 |
7.9 |
10,331 |
16.3 |
|
|
Others |
1,80,802 |
32,510 |
37.7 |
61,988 |
52.2 |
|
|
2. |
Industry (Medium and Large) |
3,18,578 |
40,940 |
18.6 |
57,857 |
22.2 |
|
3. |
Wholesale Trade |
29,258 |
3,863 |
17.5 |
3,360 |
13.0 |
|
4. |
Other Sectors |
2,70,418 |
49,969 |
31.1 |
59,728 |
28.3 |
|
Housing |
97,349 |
22,074 |
54.6 |
34,866 |
55.8 |
|
|
Consumer Durables |
7,545 |
-167 |
-2.1 |
-179 |
-2.3 |
|
|
Non-Banking Financial Companies |
19,482 |
975 |
6.4 |
3,349 |
20.8 |
|
|
Real Estate Loans |
16,564 |
1,272 |
24.9 |
10,185 |
159.7 |
|
|
Advances against Fixed Deposits |
25,803 |
3,034 |
14.1 |
1,321 |
5.4 |
|
|
5. |
Non-food Gross Bank Credit (1 to 4) |
10,00,245 |
1,51,516 |
24.4 |
2,26,890 |
29.3 |
|
Memo: |
||||||
|
Industry (Medium, Large and Small) |
3,92,146 |
45,550 |
16.4 |
68,188 |
21.0 |
|
|
Petroleum |
16,277 |
5,520 |
57.4 |
1,143 |
7.6 |
|
|
Infrastructure |
82,444 |
17,382 |
64.7 |
22,778 |
38.2 |
|
|
Iron and Steel |
33,148 |
381 |
1.5 |
6,753 |
25.6 |
|
|
Other Metal & Metal Products |
10,915 |
1,055 |
13.6 |
2,077 |
23.5 |
|
|
Construction |
9,412 |
1,684 |
31.3 |
2,352 |
33.3 |
|
|
Paper & Paper Products |
6,778 |
626 |
12.1 |
979 |
16.9 |
|
|
Gems & Jewellery |
13,448 |
1,746 |
21.1 |
3,418 |
34.1 |
|
|
Rubber & Rubber Products |
4,146 |
355 |
14.1 |
1,280 |
44.7 |
|
|
Cotton Textiles |
21,529 |
2,362 |
15.9 |
4,285 |
24.8 |
|
|
Other Textiles |
18,731 |
1,594 |
11.2 |
2,927 |
18.5 |
|
|
Automobiles |
9,786 |
441 |
8.4 |
4,070 |
71.2 |
|
|
Cement |
6,811 |
-219 |
-3.7 |
1,051 |
18.2 |
|
|
Food Processing |
10,299 |
1,197 |
14.8 |
987 |
10.6 |
|
|
# : Excluding investment in eligible securities. |
||||||
and steel, cotton textiles, automobiles, and gems and jewellery. On a year-on-year basis, credit to agriculture recorded a robust growth of 35.8 per cent on top of 26.4 per cent growth a year ago reflecting various policy initiatives to improve the flow of credit to the sector. Credit to the housing sector continued to be strong benefiting from low interest rates and tax incentives. Credit to the commercial real estate sector increased sharply.
During the second quarter, foreign banks increased their deposit rates by about 25 basis points for shorter tenor, while public sector banks (PSBs) reduced their deposit rates for shorter tenor (Table 36). Lending rates of all banks hardened marginally in June 2005, though benchmark prime lending rates (BPLR) have remained unchanged since end-March 2005.
Table 36: Movements in Deposit and Lending Rates
|
(Per cent) |
|||||
|
Interest Rate |
March 2004 |
March 2005 |
June 2005 |
September 2005 |
|
|
1 |
2 |
3 |
4 |
5 |
|
|
1. |
Domestic Deposit Rate |
||||
|
Public Sector Banks |
|||||
|
Up to 1 year |
3.75-5.25 |
2.75-6.00 |
2.75-6.00 |
2.00-6.00 |
|
|
More than 1 year and up to 3 years |
5.00-5.75 |
4.75-6.50 |
5.25-6.25 |
5.25-6.25 |
|
|
More than 3 years |
5.25-6.00 |
5.25-7.00 |
5.50-6.50 |
5.50-6.50 |
|
|
Private Sector Banks |
|||||
|
Up to 1 year |
3.00-6.00 |
3.00-6.25 |
3.00-6.25 |
3.00-6.25 |
|
|
More than 1 year and up to 3 years |
5.00-6.50 |
5.25-7.25 |
5.00-7.00 |
5.00-7.00 |
|
|
More than 3 years |
5.25-7.00 |
5.75-7.00 |
5.50-7.25 |
5.75-7.00 |
|
|
Foreign Banks |
|||||
|
Up to 1 year |
2.75-7.75 |
3.00-6.25 |
3.00-5.50 |
3.00-5.75 |
|
|
More than 1 year and up to 3 years |
3.25-8.00 |
3.50-6.50 |
3.50-6.50 |
3.50-6.50 |
|
|
More than 3 years |
3.25.800 |
3.50-7.00 |
4.00-7.00 |
4.00-7.00 |
|
|
2. |
Benchmark Prime Lending Rate |
||||
|
Public Sector Banks |
10.25-11.50 |
10.25-11.25 |
10.25-11.25 |
10.25-11.25 |
|
|
Private Sector Banks |
10.50-13.00 |
11.00-13.50 |
11.00-13.50 |
11.00-13.50 |
|
|
Foreign Banks |
11.00-14.85 |
10.00-14.50 |
10.00-14.50 |
10.00-14.50 |
|
|
3. |
Actual Lending Rate* |
||||
|
Public Sector Banks |
4.00-16.00 |
2.75-16.00 |
3.35-16.50 |
n.a. |
|
|
Private Sector Banks |
4.50-22.00 |
3.15-22.00 |
3.15-24.94 |
n.a. |
|
|
Foreign Banks |
3.75-23.00 |
3.55-23.50 |
4.00-25.00 |
n.a. |
|
|
n.a. :Not available. |
|||||
Government Securities Market
Yields in the Government securities market since May 2005 have largely been range-bound with intra-year movements influenced by domestic liquidity conditions, inflationary expectations and volatility in crude oil prices. Yields edged up from the second week of April 2005 reflecting concerns arising from the persistent rise in international crude oil prices, higher than expected inflation and the hike in the reverse repo rate. The 10-year benchmark yield firmed up to 7.31 per cent on April 30, 2005 from 6.65 per cent on March 31, 2005. With the easing of headline WPI inflation, yields softened during May 2005 touching 6.94 per cent on June 1, 2005. The yields edged up again during the first half of July 2005 reaching 7.23 per cent on July 13, reflecting higher crude oil prices, liquidity concerns and anticipation of
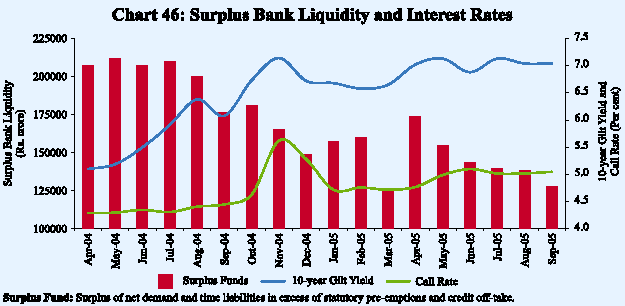
an increase in the reverse repo rate. Contraction in surplus bank liquidity also reduced the market appetite for the Government paper (Chart 46).
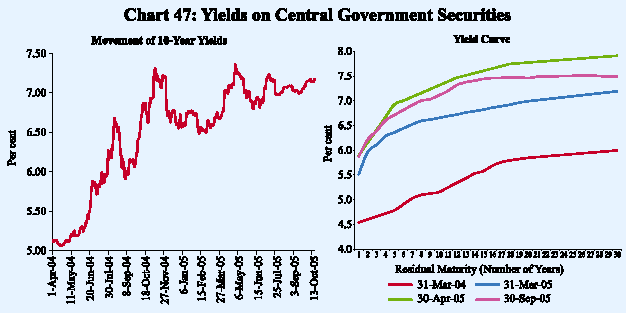
With the reverse repo rate being left unchanged on July 26, 2005 in the First Quarter Review of the Annual Statement on Monetary Policy and comfortable liquidity conditions, yields softened, reaching 6.98 per cent on July 29. Since then, the yields have remained broadly stable hovering at around seven per cent. The 10-year yield stood at 7.18 per cent on October 19, 2005, 53 basis points higher than its end-March 2005 level. The spread between 1-year and 10-year yields increased to 124 basis points at end-September 2005 (from 114 basis points at end-March). The spread between 10-year and 30-year yields, however, declined to 38 basis points (from 54 basis points at end-March) (Chart 47).
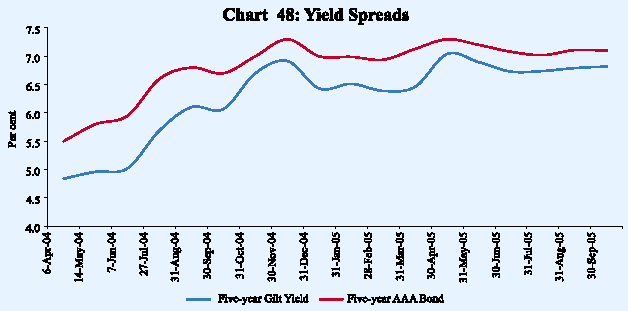
The yield on 5-year AAA-rated corporate bonds remained broadly at its end-March level and the yield spread over 5-year Government securities, thus, declined to 28 basis points at end-September 2005 from 67 basis points at end-March 2005 (Chart 48).
Equity Market
Capital markets exhibited buoyancy during the first half of 2005-06. Equity issues by corporates through initial public offerings and the privately placed debt issuances by the private sector companies witnessed substantial increase. Tapping of international markets by the Indian corporates also witnessed an encouraging trend. Both the BSE Sensex and S&P CNX Nifty touched historic high levels during June-October 2005. Satisfactory progress of the monsoon, robust industrial growth, satisfactory corporate results, strong investments by foreign institutional investors (FIIs) and mutual funds, and firm trends in international markets enthused the market sentiment.
Primary Market
The public issues segment continued to exhibit buoyancy during April-September 2005 in line with the trends witnessed in 2004-05. Both the numbers of public issues and amounts mobilised increased sharply (Table 37). The average size of public issues at Rs.193 crore in April-September 2005 was much lower than the average size of Rs. 388 crore in the corresponding period of the previous year. The bulk of the resources was raised by way of equity issues. Non-Government public limited companies (private sector) accounted for 63.4 per cent of resources mobilised by way of public issues. Three public sector banks raised equity worth Rs.2,520 crore. Out of 55 issues during April-September 2005, 26 issues were initial public offerings (IPOs), constituting 63.1 per cent of resource mobilisation as compared with nine out of 25 issues being IPOs during April-September 2004 (constituting 26.7 per cent of resource mobilisation). All the IPOs in the current financial year so far have been by companies in the private sector except one from a public sector financial company.
Mobilisation of resources through private placement recorded an increase of 75.4 per cent during the first quarter of 2005-06 (Table 37). Private sector entities continued to dominate the private placement market with a share of 61.0 per cent in total mobilisation during April-June 2005. Financial intermediaries (both from public and private sectors) accounted for 56.4 per cent of the total mobilisation under the private placements during April-June 2005.
Apart from domestic capital markets, the Indian corporates also accessed international markets and the resources raised through Euro issues increased by 180.0 per cent to Rs.3,828 crore during April-September 2005.
Gross mobilisation of funds by mutual funds during April-September 2005 increased by 18.0 per cent to Rs.5,00,123 crore over the corresponding period of the previous year. Most mutual fund schemes witnessed large inflows under their various schemes. As a result, net funds mobilised by mutual funds (net of redemptions) increased substantially by 193.6 per cent to Rs.36,822 crore during April-September 2005 over the corresponding period of the
Table 37: Mobilisation of Resources from the Primary Market
|
(Amount in Rupees crore) |
|||||||
|
Item |
April-September 2004 |
April-September 2005 P |
|||||
|
No. of Issues |
Amount |
No. of Issues |
Amount |
||||
|
1 |
2 |
3 |
4 |
5 |
|||
|
A. |
Prospectus and Rights Issues* |
||||||
|
1. |
Private Sector (a+b) |
25 |
8,462 |
51 |
6,740 |
||
|
a) |
Financial |
5 |
3,705 |
4 |
509 |
||
|
b) |
Non-financial |
20 |
4,757 |
47 |
6,231 |
||
|
2. |
Public Sector (a+b+c) |
- |
- |
4 |
3,892 |
||
|
a) |
Public Sector Undertakings |
- |
- |
- |
- |
||
|
b) |
Government Companies |
- |
- |
- |
- |
||
|
c) |
Banks/Financial Institutions |
- |
- |
4 |
3,892 |
||
|
3. |
Total (1+2) |
25 |
8,462 |
55 |
10,632 |
||
|
Of which: |
|||||||
|
(i) |
Equity |
25 |
8,462 |
54 |
10,514 |
||
|
(ii) |
Debt |
- |
- |
1 |
118 |
||
|
B. |
Private Placement+ |
||||||
|
1. |
Private Sector |
143 |
7,111 |
239 |
12,475 |
||
|
a) |
Financial |
79 |
4,655 |
83 |
7,368 |
||
|
b) |
Non-financial |
64 |
2,456 |
156 |
5,107 |
||
|
2. |
Public Sector |
29 |
4,555 |
39 |
7,980 |
||
|
a) |
Financial |
11 |
1,760 |
29 |
4,170 |
||
|
b) |
Non-financial |
18 |
2,795 |
10 |
3,810 |
||
|
3. |
Total (1+2) |
172 |
11,666 |
278 |
20,455 |
||
|
Memo Item: |
|||||||
|
Euro Issues |
6 |
1,367 |
17 |
3,828 |
|||
|
P :Provisional. * : Excluding offers for sale. + : April-June. |
|||||||
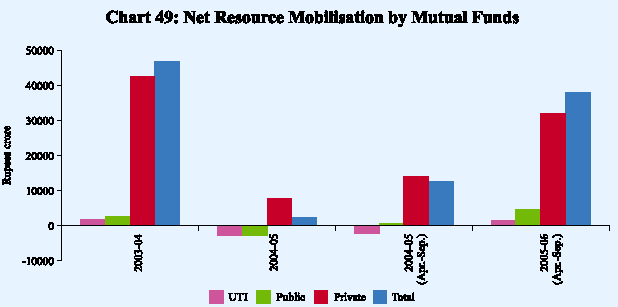
previous year. UTI Mutual Fund witnessed net inflows of Rs.1,376 crore during April-September 2005 as against net outflows of Rs.2,148 crore during the corresponding period of the previous year. The private sector and public sector mutual funds recorded net inflows of Rs.30,945 crore and Rs.4,501 crore, respectively, during April-September 2005 as compared with Rs.14,078 crore and Rs.608 crore, respectively, during April-September 2004 (Chart 49). Scheme-wise, 75.0 per cent of the gross mobilisation of funds was under liquid/ money market oriented schemes during April-September 2005. Net inflows were witnessed in case of both income/debt-oriented schemes and growth/ equity-oriented schemes. Net mobilisation of resources under growth/equity oriented schemes maintained its trend mainly due to attractive returns from these schemes in a buoyant secondary market.
Secondary Market
The stock markets remained buoyant during the first half of 2005-06. The BSE Sensex touched all time highs reaching the 8800 mark on October 4, 2005 reflecting strong macroeconomic fundamentals and robust corporate earnings (Table 38 and Chart 50). Strong liquidity support from both FIIs and mutual funds, satisfactory progress of monsoon, firm trend in the international markets and surge in ADR prices also helped to boost the market sentiment. Announcement of fresh reform measures such as allowing foreign private sector banks to acquire weak private sector banks in India, allowing 100 per cent foreign direct investment in construction sector and permitting pension funds to invest in equity markets also buoyed up the market. The stock markets, however, witnessed some correction in the period beginning October 5, 2005 due to slow down in FII inflows, cautious approach by investors ahead of second quarter corporate results, profit booking at higher levels and weak trend in international markets. The BSE Sensex stood at 7971 on October 19, 2005.
Table 38: Corporate Financial Performance
|
(Growth rates in per cent) |
||||||||
|
2003-04 |
2004-05 |
2004-05 |
2005-06 |
|||||
|
Q1 |
Q2 |
Q3 |
Q4 |
Q1 |
||||
|
1 |
2 |
3 |
4 |
5 |
6 |
7 |
8 |
|
|
Sales |
15.4 |
25.2 |
24.8 |
23.7 |
24.1 |
21.0 |
18.5 |
|
|
Expenditure |
14.7 |
24.0 |
23.4 |
22.4 |
24.3 |
19.8 |
18.0 |
|
|
Gross Profits |
26.6 |
38.9 |
36.0 |
35.8 |
30.5 |
35.3 |
32.0 |
|
|
Interest Cost |
-11.5 |
-2.0 |
-3.2 |
2.1 |
-13.0 |
-5.4 |
-13.5 |
|
|
Profits After Tax |
57.9 |
53.8 |
51.2 |
45.3 |
45.5 |
51.4 |
54.2 |
|
|
Memo : |
||||||||
|
(Amount in Rupees crore) |
||||||||
|
No. of Companies |
2201 |
1273 |
1255 |
1353 |
1464 |
1301 |
2355 |
|
|
Sales |
4,28,072 |
5,68,476 |
1,35,156 |
1,53,040 |
1,62,193 |
1,79,632 |
1,94,608 |
|
|
Expenditure |
4,29,080 |
4,90,204 |
1,15,656 |
1,31,227 |
1,40,574 |
1,56,647 |
1,66,972 |
|
|
Gross Profits |
48,852 |
72,406 |
17,234 |
20,448 |
20,017 |
23,736 |
25,577 |
|
|
Interest Cost |
14,724 |
12,528 |
3,597 |
3,584 |
3,273 |
3,177 |
4,241 |
|
|
Profits After tax |
26,281 |
47,333 |
10,396 |
13,004 |
13,196 |
16,798 |
16,726 |
|
|
Note : 1.Growth rates are percentage change in the level for the period under reference over the corresponding |
||||||||
During the current financial year so far (up to October 19, 2005), the BSE Sensex has risen by 22.8 per cent over its end-March level, while the S&P CNX Nifty has increased by 18.5 per cent. The price-earnings (P/E) ratio of BSE Sensex stood at 16.2 as on October 19, 2005 as compared with 15.6 at end-March 2005 (Table 39).
The rally in the stock markets has been broad-based. BSE 500 increased by 18.9 per cent on a point-to-point basis between October 19, 2005 and end-
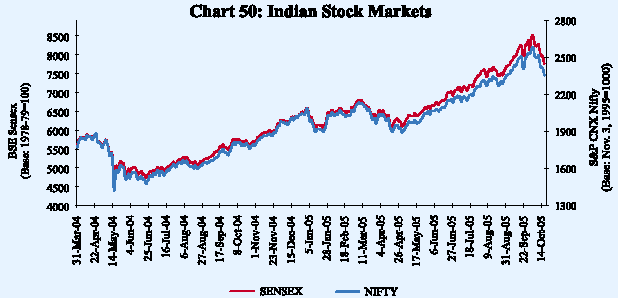
Table 39: Stock Market Indicators
|
Indicator |
BSE |
NSE |
||||||
|
2003-04 |
2004-05 |
April-September |
2003-04 |
2004-05 |
April-September |
|||
|
2004-05 |
2005-06 |
2004-05 |
2005-06 |
|||||
|
1 |
2 |
3 |
4 |
5 |
6 |
7 |
8 |
9 |
|
Average BSE Sensex / |
||||||||
|
S&P CNX Nifty |
4492 |
5741 |
5221 |
7187 |
1428 |
1805 |
1642 |
2205 |
|
Volatility |
23.0 |
11.2 |
6.8 |
9.6 |
23.3 |
11.3 |
7.3 |
8.8 |
|
P/E Ratio (End-period)* 18.6 |
15.6 |
16.7 |
17.8 |
20.7 |
14.6 |
14.6 |
16.2 |
|
|
Turnover (Rs. crore) |
5,03,053 |
5,18,715 |
2,44,913 |
3,61,054 |
10,99,535 |
11,40,071 |
5,53,969 |
6,95,049 |
|
Market Capitalisation |
||||||||
|
(Rs. crore) |
||||||||
|
(End-period) |
12,01,207 |
16,98,429 |
13,09,420 |
22,54,376 |
11,20,976 |
15,85,585 |
12,27,550 |
20,98,263 |
|
* : For 30 scrips included in the BSE Sensex and 50 scrips included in the S&P CNX NIfty. |
||||||||
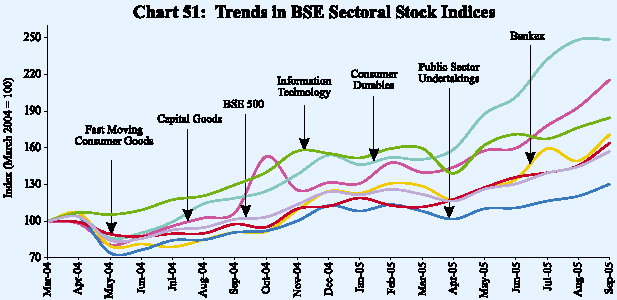
March 2005. Amongst the major sectoral indices, the BSE consumer durables registered the highest gain (51.5 per cent) over end-March 2005, followed by capital goods (42.9 per cent), fast moving consumer goods (FMCG) (33.4 per cent), bankex (18.7 per cent), IT (13.9 per cent) and public sector undertakings (PSUs) (10.7 per cent) (Chart 51). The consumer durables index rose sharply on account of good corporate results led by increase in sales in electronics and auto segments and merger and acquisition activities. The FMCG sector performed well mainly due to satisfactory progress of monsoon which is expected to increase sales of the FMCG products. The capital goods scrips gained due to robust industrial activity, especially in the manufacturing sector and continued encouraging investment climate.
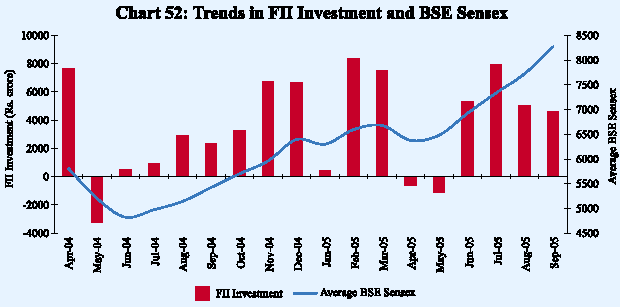
According to the Securities and Exchange Board of India (SEBI), FIIs made net investments of Rs.19,936 crore in the equity market during 2005-06
so far (up to October 19, 2005), substantially higher than that of Rs.13,307 crore during the corresponding period of the previous year (Chart 52). Mutual funds also made net purchases in equities of Rs.9,831 crore during 2005-06 so far (up to October 18, 2005) in contrast to sales of Rs.845 crore during the corresponding period of the previous year.
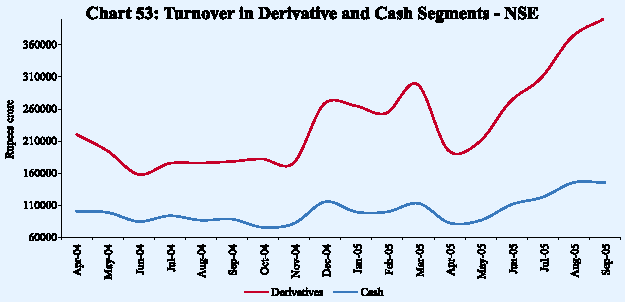
At the NSE, the total turnover in the cash segment increased by 25.5 per cent to Rs.6,95,049 crore during April-September 2005. The turnover in the NSE’s derivative segment continued to be higher than in the cash segment. It increased by 59.2 per cent to Rs.17,55,790 crore during April-September 2005 (Chart 53).

हे पेज शेअर करा:


भारतीय रिझर्व्ह बँक मोबाईल ॲप्लिकेशन इंस्टॉल करा आणि नवीनतम बातम्यांचा त्वरित ॲक्सेस मिळवा!
आमचे अॅप इंस्टॉल करण्यासाठी QR कोड स्कॅन करा


पेज अंतिम अपडेट तारीख:


