 IST,
IST,


Economic and Financial Developments in Andaman and Nicobar Islands1
Shri Deepak Mohanty, Executive Director, Reserve Bank of India
delivered-on डिसें 23, 2011
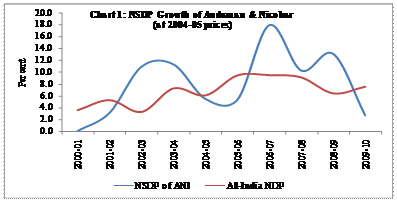
I thank the Andaman Chamber of Commerce and Industry for inviting me to address this distinguished gathering. This picturesque Union Territory (UT) of Andaman & Nicobar Islands (ANI) in the Bay of Bengal covers 0.25 per cent of the national geographical area but accounts for only a fractional share of 0.03 per cent of national population. This explains why ANI has the lowest population density of 46 per square kilometre as against 382 at the all-India level. The high literacy rate and per capita income make ANI as one of the leading UTs in India in terms of socio-economic developments. Further, the lushness of its landscape with bio-diversity and attractive spots for eco-tourism make it a prime tourist attraction. Notwithstanding these social and geographical advantages, ANI faces several developmental challenges, especially in the aftermath of tsunami that wreaked large-scale damage in December 2004. Apart from natural and rich human resources, it is important to have a well-functioning financial system for sustainable economic development. In recognition of this, the Reserve Bank has stepped up its efforts in recent years to enhance the penetration of the formal financial sector and promote financial inclusion with a view to improving the well-being of our society. In this regards, the Reserve Bank has been undertaking special initiatives for extending the outreach of banking facilities in states and union territories. Against this backdrop, I propose to briefly outline the economic and financial structure of the UT of ANI as well as highlight various financial inclusion initiatives taken by the Reserve Bank. In conclusion, I shall flag some issues that need policy attention. Background Andaman & Nicobar Islands, a Union Territory of India since 1956, is an archipelago of 572 islands (306 islands and 266 rocks) and has a geographic area of 8,249 square kilometre. Of these islands, only 38 have human habitation. The UT is bestowed with abundant green vegetation and marine wealth besides huge potential for culture fisheries. It covers the Indian subcontinent’s richest rain-forest and houses indigenous tribes of Negroid and Mongoloid origins. The diversified mangroves have been included in the World Wildlife Fund (WWF) Global 200 list of the world’s highest priority biodiversity ‘hot spots’. Furthermore, these islands are included in the UNESCO-designated Biosphere Reserve/Zone (Indo-Malayan Bio-geographic Zone). According to the Forest Survey of India (2005), 87 per cent of the total geographical area of ANI is under forest cover and only about 50,000 hectare is available for cultivation and allied activities distributed among various islands. At present, the major crops being grown are paddy, coconut, arecanut, vegetables and fruits. ANI has an aggregate coastline of 1,912 kilometres, which is about one-fourth of the total coastline of India. The Exclusive Economic Zone (EEZ) around the islands encompasses around 0.6 million square kilometre which is 30 per cent of the EEZ of India. This provides a great opportunity for development of fisheries and other marine resources. Social Indicators As per the Census 2011, the total population of ANI registered a decennial growth of 6.7 per cent with a total population of about 3.80 lakh. ANI consists of three districts, viz., South Andaman district, North and Middle Andaman district and Nicobar district. Over 88 per cent population of the UT lives in the first two districts of which 37 per cent live in urban areas. Nicobar district does not have any urban area. While the sex ratio in North and Middle Andaman and South Andaman districts has increased to 925 and 874, respectively, in 2011 from 884 and 824 in 2001, the sex ratio of Nicobar district has decreased to 778 in 2011 from 857 in 2001. The population density in ANI has increased from 43 per square kilometre in 2001 to 46 per square kilometre in 2011. The literacy rate in the Islands was high at 86.3 per cent in 2011 as compared with 74.0 per cent at the all-India level (Table 1). Macroeconomic Structure The UT of ANI has significant potential for growth given its natural resource endowment. However, the comparative isolation of the islands from the mainland, scattered islands, difficult communication system, and heavy reliance on the government for supply of inputs and smaller base of local market are the major constraints in achieving rapid growth. In line with the national economy, during the last decade, the economy of ANI has undergone significant structural transformation. The dominance of primary sector has declined and the share of the tertiary sector has increased. The reduction in the share of primary sector could partly be attributable to reduction in cutting of forest timber as per the decision of the Supreme Court. Further, there was reduction of agricultural produce due to submerging of land in the wake of the tsunami. The increase in the share of services sector is attributable to enhanced construction activities due to rehabilitation measures and increased government expenditure in the post-tsunami period. The share of industrial sector, however, remained more or less stagnant. As per the available information from the Central Statistical Office (CSO), in 2009-10 the per capita income (NSDP) of ANI was over 62 per cent higher than all-India per capita income. However, during 2009-10, the growth in NSDP of ANI decelerated to 2.7 per cent mainly due to the sharp decline in the growth of the industrial and agriculture sectors. Notwithstanding this deceleration in growth, the average annual growth rate improved during the second half of the 2000s to almost 10 per cent from 6 per cent in the first half. The average growth of NSDP of ANI generally remained higher than that of the all-India NDP during the period 2005-10 (Chart 1).
The increase in the average growth of NSDP of ANI during 2005-10 was mainly driven by industrial and services sector. The industrial sector made a sharp recovery from a low growth rate of 1.5 per cent during the first half of the 2000s to 12.4 per cent in the second half of the decade. However, it is observed that the growth rate in this sector has remained highly volatile during the entire decade. The agriculture sector witnessed a turnaround from negative growth during 2000-05 to a growth rate of 3.7 per cent during 2005-10 (Table 2).
Drivers of Growth Keeping with the overall trend in the country, the economic activity in the UT is dominated by the tertiary sector and its share has been continuously rising. The share of the primary sector has been declining and the share of the secondary sector in NSDP is static at around 3 per cent. There is hardly any manufacturing activity in the UT which is mostly concentrated in wood processing, and with the present restrictions on the exploitation of forests has led this activity to stagnate. Within the tertiary sector, construction activities, transport, storage and communication and public administration have been the major drivers of growth. Agriculture The average rainfall in the islands is very high and spread over eight months during April-November each year which produces a humid tropical climate. The agro-climatic condition in these islands is suitable for cultivation of plantation crops like coconut, arecanut, fruits like banana, mango, pineapple, guava, jackfruit and spice like clove, nutmeg and pepper. The soil has low water retention capacity. Out of a total reported geographical area of 8,24,900 hectares in 2009-10, the total cropped area in the Islands stood at 16,535 hectares (Table 3).
Among the major crops, while the production of paddy has increased, the yield has gone down. The production of coconut, which covers maximum area under production, remained stagnant. Performances of other plantation crops were mixed. According to Agriculture Census 2005-06, the number of operational holdings as well as area have increased primarily for the holding size-class of less than 1 hectare and to a lesser extent for holding size 1 to 2 hectares. Mainly institutional land falls in the 10 plus holding class. The average size of operational holdings has also decreased from 2 hectare in 2000-01 to 1.88 hectare in 2005-06 which indicate the increasing fragmentation of land holdings in the UT (Table 4). Industry The absence of a sizeable local market for manufactured goods and the need to bring much of the raw materials from the mainland are considered the main impediments in the development of industries. Therefore, large and medium scale industrial activity is absent in ANI. The industrial base of ANI consists mainly of small and tiny industries. The industries in the region are mainly timber and agro-based. The recent years have seen a decline in industrial output owing to closure of wood-based industrial units. There are 1,961 registered small-scale industrial (SSI) units in the Union Territory as at end-March 2010 (Table 5). Tourism The Andaman & Nicobar Islands have an unique combination of sprawling beaches, rising hinterland and dense equatorial forests. More than 50 per cent of the forest area is Tribal Reserves, National Parks and Wildlife sanctuaries. Any development activity in the islands including tourism has to be sensitive to ecological fragility. The key challenge facing the growth of tourism in ANI is connectivity and the commensurate infrastructure to ensure better accessibility. In this context, there is considerable scope for public-private partnership in sustainable development of tourism in the region. In recent years, the private sector has increased its role in providing transport services, theatres, restaurants and shops. The number of units as well as employment provided by the private sector has increased over time. This trend needs to be reinforced. Infrastructure Given the geographical and topographical peculiarities of these islands, including separation by sea over great distances, there is no single power-grid for all the electrified islands but several diesel generator sets cater independently to the power requirements of an area/island. At present, ANI faces significant power shortage. Due to a steady rise in population the demand for inter-island ferrying of goods and movement of people has become important. Lack of adequate transport facilities is a serious bottleneck in the economic development of the islands. Further opening up of air traffic could give a boost to trade and tourism.Fiscal Scenario As Andaman and Nicobar Islands is a Union Territory (UT) without legislature, all allocations for receipts and expenditure are made from the Union Budget. The UT’s primary source of revenue emanates from non-tax receipts, which constitutes more than 80 per cent of revenue receipts. Non-tax revenues have been steadily increasing in recent years. On an average, total revenue receipts to GSDP ratio was around 4.7 per cent during 2007-12. The tax to GSDP ratio in ANI was less than 1 per cent which was far below the all-India average of 5 per cent for all states. Revenue expenditure to GSDP ratio increased mainly on account of the Sixth Pay Commission award. However, capital outlay to GSDP ratio has declined (Table 6).
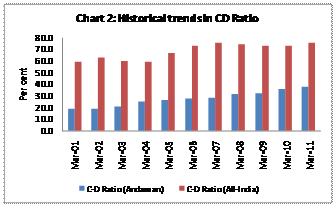
Financial Developments It is important to have a well-functioning financial system for sustainable economic development. While the Reserve Bank has been actively engaged in the development of the financial sector, it has stepped up its efforts in recent years to enhance the penetration of the formal financial sector and promote financial inclusion with a view to improving the well-being of our society. Let me first broadly outline the financial fabric of ANI. There was a gradual improvement of banking penetration in ANI in recent years. This is evident from the fact that the average population per bank branch improved to11,000 at end-June 2010 from 13,000 at end-June 2002. The banking network is largely dominated to public sector banks. The recent trend in the growth rate of deposits in ANI was lower than the corresponding growth rate recorded at all-India level. The credit deposit (C-D) ratio in ANI at 37.6 per cent at end-December 2010 was significantly lower than the ratio of 76.7 per cent at the all-India level (Chart 2 and Table 7).
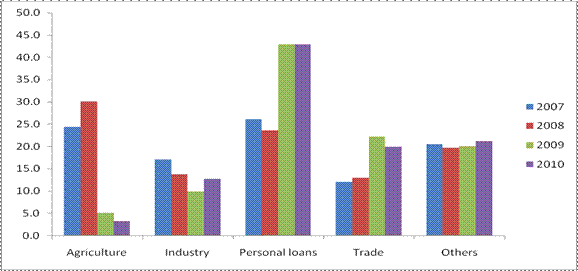
As at end-March 2010, almost 58.3 per cent of total priority sector advances were absorbed by small enterprises. Agriculture accounted for only 8.3 per cent of total priority sector advances during the same period. The occupational credit structure is dominated by personal loans, followed by advances to trade and industry (Chart 3).
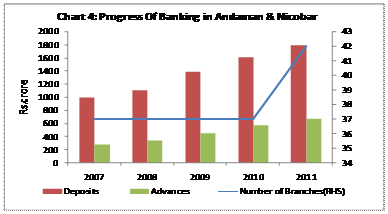
Financial Inclusion In the context of financial inclusion initiative taken by the Reserve Bank, the banks are being sensitised to pursue the inclusive drive. It may be observed that the progress of banking in terms of the branch expansion was stagnant during the period 2007 to 2010 though there was an improvement in terms of deposits and credit expansion. Due to the recent initiatives taken by the Reserve Bank, the number of branches has increased from 37 in 2010 to 42 in 2011 (Chart 4).
Further, in pursuance of the overall financial inclusion strategy, a total of 47 villages with population over 1,000 were identified in the three districts of ANI. Of these, 17 villages have been identified in South Andaman, 21 in North and Middle Andaman and 9 in Nicobar. A total of 37,370 no-frill accounts have been opened up to end-June 2011 in ANI. As at end-March 2010, the total number of Kisan Credit Card (KCC) issued in ANI was 7,000 and the amount of loan sanctioned under the scheme was ` 158 crore. As at end- June 2011 a total of ` 9.5 crore was disbursed to 1260 SHGs.Financial Inclusion Measures Financial inclusion is important for bringing the poor and under-privileged sections of the society within the banking fold and thereby generating and sustaining equitable growth. Let me now turn to the various measures initiated by the Reserve Bank for promoting financial inclusion. First, the Reserve Bank for long has instituted a mechanism called ‘priority sector lending’ through which credit is channelised to certain preferred sectors, which, inter alia, include small-scale industry, small businesses and agriculture. In the post-reform period, the priority sector group has been expanded to include advances to retail trade, educational loans, micro-finance and low-cost housing. This has helped in furthering the cause of financial inclusion. Second, the Union Finance Minister announced in the Budget 2010-11 that every village in the country with over 2000 population must have access to banking services by March 2012. In order to operationalise this process, commercial banks have prepared financial inclusion plans which have been submitted to the Reserve Bank. As brick-and-mortar branches will not be viable in very small centres, the approach is to meet this challenge through the business correspondent (BC) model and by leveraging communication technology. Under this model, banks appoint agents who provide basic banking services at the door-step of a client on behalf of the bank. Third, the Reserve Bank has asked banks to open no-frills accounts. These accounts have no or very low minimum balance requirement and have provisions for small loans by way of overdrafts. This is a very convenient account for small depositors, especially in rural areas. Fourth, a major impediment for a common person to open bank account is the ‘Know Your Customer’ (KYC) norm. The norm has been relaxed for small accounts, viz., deposits up to ` 50,000 and credit up to `1 lakh. A simple introduction by an existing account-holder in a bank should be adequate to open an account. In this regard, Aadhar, the Unique Identification Number (UID) Project of the Central Government, which aims at providing a unique ID number for everyone in the country, will help the poor to establish their identity to meet the banks’ KYC norms. Fifth, farmers can get credit from banks conveniently through Kisan Credit Cards (KCCs) and General Purpose Credit Cards (GCCs). Sixth, financial literacy becomes critically important. While several banking facilities are available, a common person may not be aware of them. Hence, the Reserve Bank has initiated a ‘Project Financial Literacy’ with the objective of disseminating information regarding the central bank and general banking concepts to various target groups. Our ‘Financial Education’ website link offers basics of banking, finance and central banking for children of all ages. Our website is also available in 13 languages.Finally, this is also a learning process for the Reserve Bank. We recognise that being responsible for banking, we must be sensitive to the needs of a common person. Accordingly, our Governor, Dr. Subbarao initiated the outreach programme as a part of our Platinum Jubilee celebrations. Under the outreach programme, the top management of the Reserve Bank visits at least one village in every state and union territory with state government officials and commercial banks to give focused attention on financial inclusion. This has been highly enriching experience for us to understand the ground realities. Accordingly, we have decided to continue these programmes. Policy Challenges First, the developmental activities pursued so far have been propelled by direct involvement of government in all areas of economic activities. However, there is a need for broad-based economic strategy with greater involvement of the private sector. Second, the limited size of the local market is a major constraint to growth. The UT should focus on a outward-looking policy of exports to the mainland in areas in which it has a natural advantage such as marine products, horticulture and floriculture. Third, the islands have an exclusive economic zone (EEZ) which is about 30 per cent of the country’s EEZ and endowed with unique marine habitat and coral diversity. However, this resource is not adequately tapped. There is a need to develop fishery for export to the mainland. This will not only boost the income of the UT but also significantly reduce transport cost as currently ships ferrying goods to the islands return empty to the mainland. Fourth, there is a need for renewed thrust on agriculture. Horticulture, floriculture, plantation crops, medicinal plants and dye plants offer a lot of opportunities for the potential investors. Fifth, given the high level of literacy and strategic location there is strong potential for development of information technology. Sixth, tourism potential of the islands can be promoted through high-value low-volume eco-tourism. This will need greater investment in tourism infrastructure. Seventh, the Great Nicobar Island is located centrally between Singapore/Colombo and just north of the sea traffic route to South East Asia and beyond. This is an extremely busy route and substantial part of the world's commercial traffic flows through this area. Development of South Eastern tip of Nicobar as a trans-shipment port for container handling, bunkering and refuelling of international/national ships passing through this route has great economic and strategic potential. Eighth, with the step-up in economic activity, the investment demand can be enhanced. The banks need to be more proactive in supporting private investment and enterprise. This will help in improving the current low level of C-D ratio through greater penetration of banking. Conclusion The comparative isolation of the Andaman and Nicobar islands from the mainland, scattered landscape, difficult communication system, heavy reliance on government departments for supply of inputs and smaller base of local market are the main impediments to the rapid growth of the economy. However, the UT of ANI has immense potential for achieving higher growth aided mainly by extensive marine resources, high literacy rate, conducive work environment and strategic location. In achieving this goal, government efforts need to be supplemented by private initiatives where the banking sector has an important role to play. This will help in further improving the well-being of masses in the islands. 1 Speech by Shri Deepak Mohanty, Executive Director, Reserve Bank of India, delivered at Andaman Chamber of Commerce and Industry in Port Blair, on 22nd December 2011. The assistance provided by Dr. P.K. Nayak and Shri Suraj. S is acknowledged. |
||||||||||||||||||||||||||||||||||||||||||||||||||||||||||||||||||||||||||||||||||||||||||||||||||||||||||||||||||||||||||||||||||||||||||||||||||||||||||||||||||||||||||||||||||||||||||||||||||||||||||||||||||||||||||||||||||||||||||||||||||||||||||||||||||||||||||||||||||||||||||||||||||||||||||||||||||||||||||||||
पेज अंतिम अपडेट तारीख:


