 IST,
IST,


Understanding and Managing Interest Rate Risk at Banks
Dr. Viral V. Acharya, Deputy Governor, Reserve Bank of India
delivered-on जाने 15, 2018
|
Let me at the outset wish all of you a happy and healthy New Year. Thank you to Fixed Income Money Markets and Derivatives Association (FIIMDA) and its organizing team for inviting me to deliver this keynote address at its Annual Meet. I will speak today about understanding and managing better the interest rate risk at Indian banks. I will start, however, by looking elsewhere and historically, often a very good place to start. In the period after the Global Financial Crisis, bank exposures to sovereign debt have increased significantly in many economies, including advanced ones, deepening the linkage of bank balance sheets with sovereign debt. Several important drivers are deemed to be at work behind this phenomenon:
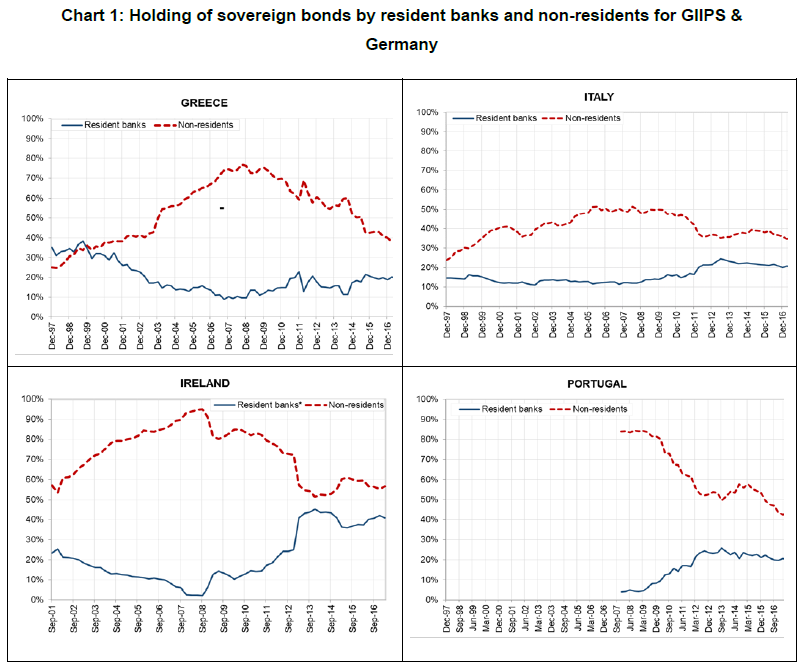
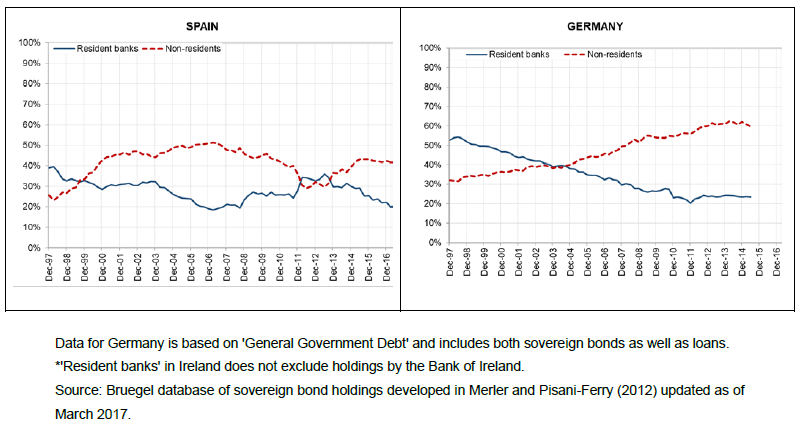
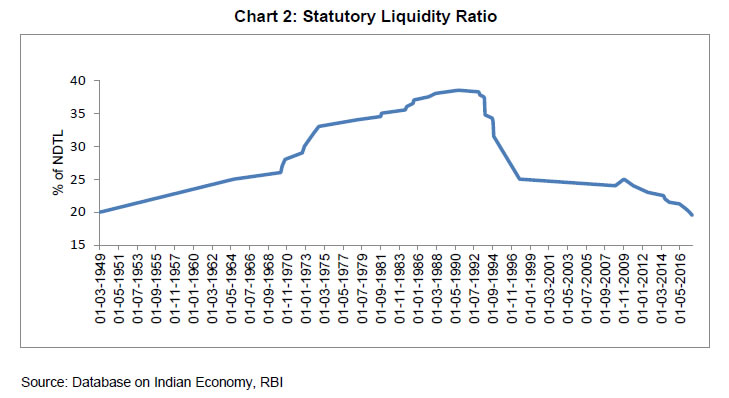
While sovereign bonds may be safer and more liquid than other instruments at a given point of time, there is no guarantee that they will remain so as both credit risk and liquidity risk of sovereign debt are dynamic in nature, and in fact, can shift deceptively so as these risks materialize from seemingly calm initial states. Sovereign debt-bank nexus and Eurozone sovereign debt crisis The potential negative impact of sovereign debt-bank nexus and the need for addressing it has attracted much international attention, particularly in Europe. Exposures of resident banks to domestic sovereign debts in countries that faced debt crisis (Greece, Italy, Ireland, Portugal, and Spain, or GIIPS) increased significantly during and after the crisis. Moreover, the increased exposure of banks to sovereign debts exhibited a domestic bias in case of the riskier sovereigns, i.e., the GIIPS, with share of resident banks increasing while that of non-residents declining; the holdings of resident banks continue to be at a high level (Chart 1). The large holdings of domestic sovereign debt by banks played a key role in exacerbating the sovereign debt crisis in peripheral European countries. From January 2007 until the first bank bailout announcement in late September 2008, there was a sustained rise in bank credit spreads while sovereign credit spreads remained low. During September-October 2008, bank bailouts became a pervasive feature across developed economies and there was a significant decline in bank credit spreads with a corresponding increase in sovereign credit spreads. In effect, bank bailouts transferred credit risk from the financial sector to the sovereigns (Acharya, Drechsler and Schnabl, 2012; 2015). However, and especially post the Greek default in 2010, sovereign spreads in the GIIPS widened too over the German Bunds due to macroeconomic concerns in the European periphery, causing significant valuation losses for banks and casting doubt on their solvency. Concomitantly, rising yields on sovereign bonds enticed banks to stock up on their domestic sovereign exposures. With continuing access to short-term funding, notably in deposit and money markets, banks in GIIPS and even some non-GIIPS countries increased investments in GIIPS sovereign bonds so as to purchase “carry” over the German Bunds, hoping for future convergence of yield (Acharya and Steffen, 2015). This “carry trade” was particularly attractive for under-capitalized banks as a way to gamble for resurrection, effectively chasing quick Treasury gains with no additional capital requirement, but doubling up on economic risks if the carry were to widen even further... and it did. The Greek default and ensuing sovereign debt crises in the GIIPS countries showed that banks having significant exposures to sovereign debt were the most susceptible to fluctuations in sovereign borrowing costs and faced attendant market plus funding consequences. Such sovereign debt-bank nexus creates a two-way feedback loop. As banks are highly exposed to the domestic sovereign, any adverse movement in yields or materialisation of a sovereign event could trigger bank under-capitalization and bailouts, which imply further sovereign borrowing and rising sovereign yields, leading to further erosion of bank capital and need for further bailouts, and so on (Acharya, Drechsler and Schnabl, 2012; 2015). Understanding and managing well the banking sector’s exposure to risks embedded in domestic sovereign debt is thus not just a matter of banking sector’s profits and capital, but in fact it is one of overall macroeconomic stability. The Indian Context In India, the linkage between sovereign debt and bank balance sheets has always been strong given the Statutory Liquidity Ratio (SLR) prescriptions for banks and the historical role that banks have played in supporting public debt. Banks, under section 24 of the Banking Regulation Act, 1949, are required to maintain minimum liquid assets (basically Government securities – both Central Government securities or G-Secs, and sub-sovereign securities called State Development Loans (SDLs)) as a percentage of Demand and Time Liabilities (DTL). This ratio has historically been as high as 38.5%, but has gradually come down to 19.5% now (Chart 2), being brought steadily in line with international levels of the Liquidity Coverage Ratio (LCR) under Basel-III. The resulting large holding of G-Secs and SDLs by banks exposes them to re-pricing of governments’ borrowing costs which could rise due to inflationary, fiscal or other domestic as well as global macroeconomic developments. I propose to (i) draw attention to the significance of this interest rate risk exposure of Indian banks; (ii) urge banks to pay greater attention and devote more resources to their Treasury operations; and, (iii) lay out some options available to banks for managing the risk efficiently. Understanding Interest Rate Risk at Banks Let us start by first principles. Interest rate risk is most simply understood by looking at the (approximate) price equation for a bond portfolio when there is a (small) change in the underlying interest rates, such as the level of government’s borrowing cost: ∆P = - P × D × ∆Y, where In other words, the value of the investment portfolio is a function of three factors:
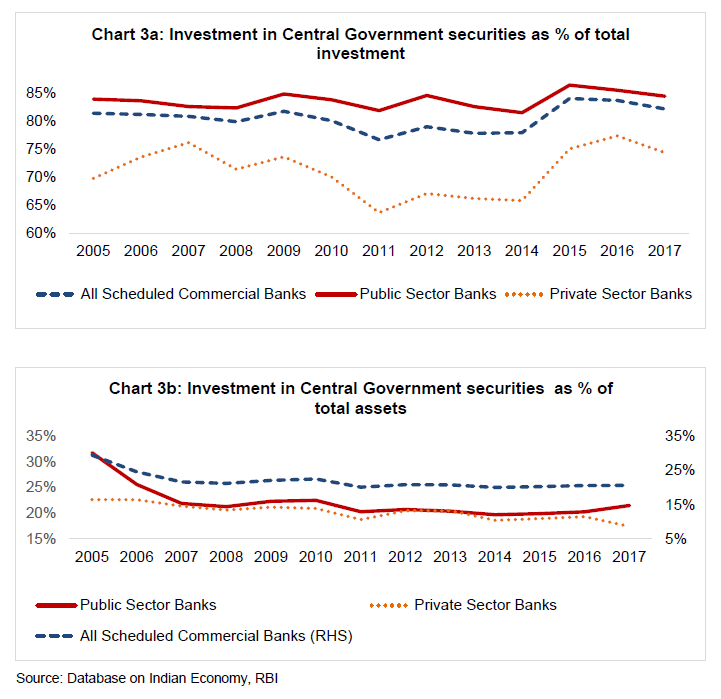
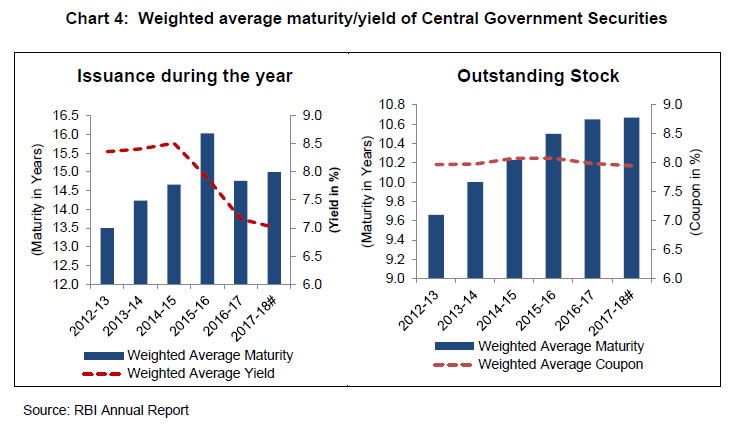
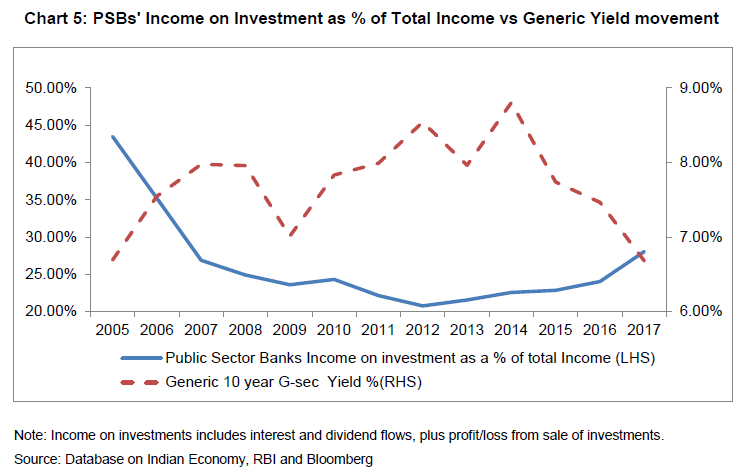
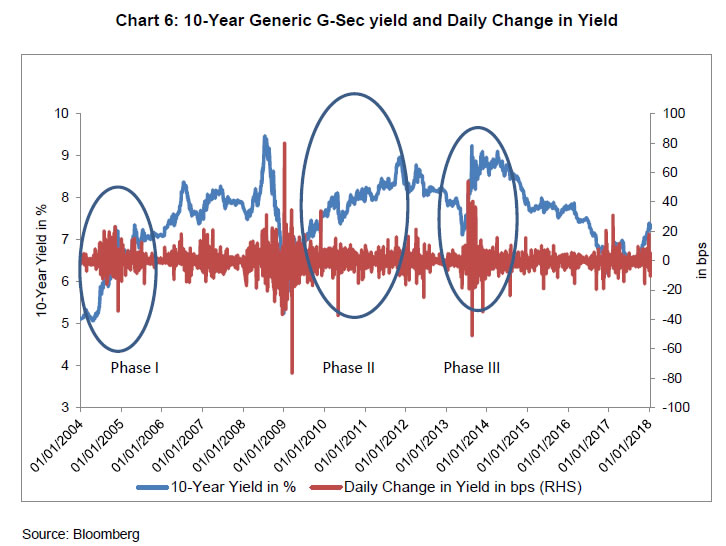
For example, a portfolio of size 1 trillion with 10 years of duration, falls in value by 10 billion upon a 0.1% or 10 basis points (bps) rise in the 10-year G-Sec benchmark yield. Let us consider each of these factors, in turn, in the present and historical Indian context. Size of the Portfolio2 The share of commercial banks in outstanding G-Secs is around 40% (June 2017). Investment of Scheduled Commercial Banks (SCBs) in G-Secs as a percentage of their total investment was around 82% for FY 2016-17. The corresponding figure for Public Sector Banks (PSBs) for FY 2016-17 is slightly higher at 84%. This exposure has noticeably increased since 2014 (Chart 3a). In spite of the relative stability of the consolidated Debt/GDP ratio of the government, the investor base for G-Secs in India is primarily limited to domestic institutions. As a result, there are often situations of oversupply of government bonds relative to demand. This appears to be the case especially for Indian banks going by their high excess SLR holdings. One reason banks end up holding high levels of government debt is because in the Indian milieu, they end up as residual holders in case of relative oversupply, as the appetite of other major institutional investor categories like insurance and pension funds is limited by their investment mandates. Another important reason in recent times has been that excess liquidity in the banking system did not end up being parked at the Reserve Bank’s liquidity mop-up operations which would have kept duration risk minimal. Instead, the surplus liquidity found its way into G-Secs as domestic sovereign debt is the most attractive investment for capital-starved banks looking for short-term gains even if at the expense of greater duration (as I explained earlier, this was the case also in the European context). As a result, the size of banking sector’s balance-sheet exposure to G-Secs, and hence, its interest rate risk, is high in an absolute sense, and is relatively elevated, when measured in proportion to total assets, for public sector banks relative to private banks (Chart 3b). Duration of investment book and the maturity structure of G-Secs The high interest rate exposure of banks from their G-Sec portfolios is attributable to not only the size of their holdings, but also to the increasing maturity of primary issuance. The weighted average maturity of the stock of Government securities has increased steadily from 9.66 yrs in 2012-13 to 10.67 yrs in 2017-18 (Chart 4). The average tenor of annual issuance during the last five years has been high at around 15 years. What are implications of this changing maturity structure of G-Secs for the duration of bank investment portfolios? The investment portfolio of banks is classified under three categories, viz., 'Held to Maturity (HTM)', 'Available for Sale (AFS)' and 'Held for Trading (HFT)'. Banks normally hold securities acquired by them with the intention to hold them up to maturity under HTM category. Only debt securities are permitted to be held under HTM with a few exceptions, e.g., equity held in subsidiaries. Holding securities under HTM provides cushion for banks from valuation changes. However, holding in HTM book is subjected to a ceiling. AFS and HFT categories together form the trading book of banks. Banks are permitted to decide on the extent of holdings under AFS and HFT based on their trading strategy, risk appetite, capital position, etc. Securities held under both these books are required to be marked to market. HFT book is required to be marked to market on a more frequent basis than AFS. Valuation frequency of investment is typically a determinant in the composition of investment book of banks. Correspondingly, shares of HTM, AFS and HFT are 55.4%, 42.5% and 2.1%, respectively, as on September 2017 (Financial Stability Report, RBI, December 2017). The average modified duration of the AFS book of banks is currently around 2.9 years. The comparable figure for PSBs is higher at 3.5 years and for PvtSBs is at 2.0 years. With relatively high duration and concentration of G-Secs in investment portfolio, bank earnings and capital remain exposed to adverse yield moves, especially as the share of investment income has been on the rise in the last five years. Chart 5 captures this fact succinctly that investment income of banks is highly sensitive to G-Sec yields – yields had by and large fallen in recent years, and consequently, investment income went up. In turn, and given the muted credit growth over this period, especially at PSBs, investment income has again started playing a rather important role in determining bank earnings. Movement in yields - Phases of sustained yield rise G-Sec yields in India have undergone episodic phases of sustained rise of close to 200 bps at regular intervals. Chart 6 identifies three major phases for the 10-year benchmark yield over the past 15 years:
My point in showing this time-series and episodic phases of G-Sec yield movements is that banks should not be surprised repeatedly when government bond yields rise sharply and their investment profits drop. RBI’s Financial Stability Reports (FSR) have regularly pointed out the impact of such large interest rate moves on capital and profitability of banks. Banks should know and understand this risk rather well. Perhaps they do, and the issue is really one of incentives that lead to their ignoring this risk, which I will turn to next. Heads I Win, Tails the Regulator Dispenses How have these episodic phases of sustained rise in G-Sec yield played out? During Phase I, responding to the clamour for regulatory forbearance, banks were permitted to hold G-Secs up to the mandated Statutory Liquidity Ratio (SLR) of 25% of Demand and Time Liabilities (DTL) under the Held to Maturity (HTM) accounting category. Regulation also enabled banks to shift securities from other accounting categories into the HTM category, as a one-time measure, a feature that has now acquired an annual dimension. A similar one-time transfer was extended during Phase III, in addition to deferment in recognition of valuation losses by six months, from September 2013 to March 2014. The impact of the persistent rise in yields during Phase II was eased to a great degree by regular open market purchases by RBI, which are typically employed for durable liquidity management and to ensure the proximity of money market rates to the overnight policy rate, rather than for management of long-term G-Sec yields. These are also the sort of measures some banks have again requested RBI to adopt in the current phase of rising yields, wherein yields have moved up from around 6.50% at end-August 2017 to around 7.45% now. Interest rate risk of banks cannot be managed over and over again by their regulator. The regulator, in interest of financial stability, is caught in such situations between a rock and a hard place, and often obliges. However, the trend of regular use of ex post regulatory dispensation to ease the interest rate risk of banks is not desirable from the point of view of efficient price discovery in the G-Sec market and effective market discipline on the G-Sec issuer. Nor does it augur well for developing a sound risk management culture at banks. Recourse to such asymmetric options – heads I win, tails the regulator dispenses – is akin to the use of steroids. They get addictive and have long-term adverse effects in the form of frequent relapse even though their use may be justified to relieve occasional intense pain. Hence, it would be better for the banking system to build its own immunity and strength, i.e., emphasise internally – and put in place processes for – efficient management of interest-rate risk.3 Let me then discuss what could be done by banks to achieve this. Managing Interest Rate Risk at Banks Management of the increasing interest rate exposure of the banking system needs to address both sides of the sovereign-bank nexus. While the long-term investor participation in government bond market needs to be deepened – both domestically and internationally, and the maturity structure of government debt kept sensitive to implications for bank balance-sheets, banks also need to manage the interest rate risk on the balance sheet by dynamically managing its size and duration as well as accessing markets for risk transfer. The desirable options follow from the bond price equation I presented earlier: ∆P = - P × D × ∆Y. Interest rate risk management options can thus be categorised as follows:
Measures that address the G-Sec portfolio size of banks The size of the G-Sec portfolio of banks is mainly a function of balance sheet choices made by banks among competing assets. Recognizing at the outset that G-Sec portfolio is subject to interest rate risk, a risk-management strategy can be put in place along the following lines:
None of this is rocket science but does require at the highest level of bank governance mechanisms a recognition of interest rate risk, an incentive to manage it, and a top-down organizational strategy to implement it. Measures that address the duration risk of banks How may banks better manage their duration risk? The efficiency with which this risk is currently managed leaves a lot to be desired. While duration risk management is constrained by the G-Secs issuer’s choice of maturity structure and liquidity in the secondary bond market, the risk can be managed more nimbly by also availing of hedging markets. PSBs account for about 70.6% of the banking sector assets. However, their participation in such hedging markets is limited or negligible. While their share in secondary market trading of G-Secs is about 33%, their share in hedging activity in the Interest Rate Swap (IRS) and Interest Rate Future (IRF) segments is only 4.61% and 13.40%, respectively. Let me elaborate. RBI introduced Rupee interest rate derivatives in the OTC market, viz., Interest Rate Swaps (IRS) and Forward Rate Agreement (FRA), in 1999. Interest Rate Futures (IRFs) were first introduced in the Indian markets in 2003 but only the current bond future contract, introduced in 2014, has seen reasonable activity. Liquidity in the interest rate products has generally been low. The open interest and daily volume in the interest rate futures market are usually between Rs.20-30 billion while the daily volume in the Overnight Indexed Swap (OIS) interest rate swap market is around Rs.150 billion. Besides, only a section of the banks are active in the OIS market. Compared to an average daily bond market volume of Rs.400-500 billion, interest rate derivative markets are thus rather thin. Wider participation by banks in interest rate derivative markets – both futures and swaps – is necessary for improving liquidity in these markets, which is necessary for banks to off-load their significant duration risk onto others. As more hedgers access these markets, there would be incentives for market makers to allocate more capital to these activities, kicking off a virtuous cycle of interest rate risk-sharing and leading over time to a more vibrant derivative market. In other words, the Treasury functions at banks need to be modernized with urgency, subjected to careful scrutiny by Boards, overlaid with prudent risk management practices, and trained to employ hedging instruments specifically targeted at managing interest rate risk. This takes me to the important issue of how banks should manage large changes in yields. Measures that manage the impact of potentially large changes in yield Given the nascent stage of our interest rate derivative markets, banks need to manage exposures to large changes in yield with a multitude of instruments and trading platforms. All options should be on the table. An oft-cited reason for the lack of such comprehensive risk management by banks is that hedging markets that can enable neutralization of large changes in yield lack the size or depth or liquidity to meet the needs of large banks. True as this argument is at some level, it is the very lack of participation by large banks that makes these markets illiquid and small. RBI systematically engages with the market to take necessary steps to create an enabling environment for markets to develop – creating trading, settlement and reporting infrastructure; introducing products; easing processes; etc. India’s G-Sec market infrastructure is arguably the best in the world. We have enabled guaranteed settlement in G-Secs, forex and interest rate swaps. Despite the existence of the facility to short sell and availability of futures and swap markets, it appears that for most banks investment activity essentially consists of two steps – buying and hoping for the best. But hope should not be a Treasury desk’s primary trading strategy. RBI has also permitted money market futures about a year back. Those directions were a significant deviation from the earlier prescriptive approach. Exchanges were given complete freedom to design and introduce products. We are yet to receive any proposal for approval. Similarly, interest rate options were also permitted sometime back, but market has still not kicked off. Years back RBI introduced the When Issued market and STRIPS, but neither has gained traction. Does all this imply that these interest rate products have no use for any participant? Or is it just that the market, dominated by banks, is not used to availing of risk management options, hoping instead for regulatory forbearance when episodic yield increase rears its ugly head? Conclusion Let me summarize. Market liberalization does not just involve the regulator easing business processes, introducing new products and creating new markets; it also requires participants to take initiative to reskill themselves for constantly evolving market conditions and products. Market development is a two-way interactive process between market participants and regulators. We are hoping that FIMMDA can rally banks and play its part going forward. Finally, it is encouraging that FIMMDA is developing the Code of Conduct covering its members’ activities in the interest rate markets. Along with FEDAI’s recent adoption of the Global Foreign Exchange Code, the entire range of bond, currency and related derivative markets would be subject to professional conduct in line with best international practice, once FIMMDA adopts the code. I hope that this process can be hastened and FIMMDA members adopt the code signing it on a public website by the end of the current quarter. References 1. Viral V. Acharaya, Itamar Drechsler, and Philipp Schnabl (2012), “A tale of two overhangs: the nexus of financial sector and sovereign credit risks,” Financial Stability Review, Banque de France, April 2012. 2. Viral V. Acharaya, Itamar Drechsler, and Philipp Schnabl (2015), “A Pyrrhic Victory? Bank bailouts and sovereign credit risk,” Journal of Finance, 69(6), 2689-2739. 3. Viral V. Acharaya and Sascha Steffen (2015), “The “greatest” carry trade ever? Understanding Eurozone bank risks,” Journal of Financial Economics, 115, 215-236. 4. Bruegel database of sovereign bond holdings developed in Merler and Pisani-Ferry (2012) (updated as of March 2017)- Silvia Merler and Jean Pisani-Ferry, “Who’s afraid of sovereign bonds”, Bruegel Policy Contribution 2012, February 2012 http://bruegel.org/publications/datasets/sovereign-bond-holdings/. 1 Speech delivered at the FIMMDA Annual Dinner, 2018 organised by the Fixed Income Money Market and Derivatives Association of India (FIMMDA) on January 15, 2018 at Hotel Taj Mahal Palace, Mumbai. 2 Government securities are defined under law as both Central Government securities (G-Secs) and State Development Loans (SDLs). In terms of management of interest rate risk in the investment book, both are equally important. In this speech, however, data and charts pertain to only G-Secs for simplicity. Inclusion of SDLs would not change the broad conclusions, and as they contribute to interest-rate risk, would only strengthen them. 3 There are other reasons for banks to focus more closely on interest rate risk that I haven’t touched upon in interest of simplicity and brevity. For instance, banks face not just the interest rate risk of the investment portfolio but also to the risk in the banking book. The present guidelines require banks in India to compute change in economic value of equity (ΔEVE) and net interest income (ΔNII) for the entire balance sheet and not just for the banking book positions. However, in order to promote global consistency, transparency and comparability of interest rate risk in the banking book (IRRBB) with that of global banks, banks would be required going forward to compute IRRBB separately and disclose it based on revised BCBS standards. Similarly, the Report of RBI’s Internal Study Group to Review the Working of the Marginal Cost of Funds based Lending Rate (MCLR) System has recommended that floating rate loans be referenced to an external benchmark. Once introduced, this would expose banks to higher market risk, necessitating more active management of interest rate risks. |
पेज अंतिम अपडेट तारीख:


