|
Today, the Reserve Bank released the data on performance of the private corporate sector during the first quarter of 2025-26, drawn from abridged quarterly financial results of 3,079 listed non-government non-financial companies. This summary position also includes comparable data for Q4:2024-25 and Q1:2024-25 to enable study of sequential (q-o-q) and annual (y-o-y) change (web-link https://data.rbi.org.in/DBIE/#/dbie/reports/Statistics/Corporate%20Sector/Listed%20Non-Government%20Non-Financial%20Companies).
Highlights
Sales
- Sales of listed private non-financial companies rose by 5.5 per cent (y-o-y) during Q1:2025-26 as compared to 7.1 per cent growth in the previous quarter (6.9 per cent in Q1:2024-25) (Table 1A).
- Aggregate sales growth (y-o-y) of 1,736 listed private manufacturing companies moderated further to 5.3 per cent during Q1:2025-26 from 6.6 per cent in the previous quarter, mainly dragged by weak performance of the petroleum industry (Table 2A and 5A, Chart 1).
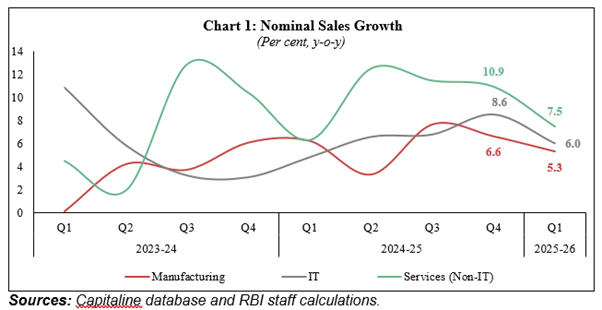
- Sales growth (y-o-y) of IT firms declined to 6.0 per cent during Q1:2025-26 from 8.6 per cent in the previous quarter, reversing upward trend seen since Q1:2024-25.
- Sales growth of non-IT services companies moderated to 7.5 per cent in Q1:2025-26, after recording double-digit growth in the previous three quarters, primarily due to lower sales growth recorded by the transport and storage companies.
Expenditure
- Manufacturing companies’ expenses on raw material increased at a slower pace of 4.5 per cent (y-o-y) as compared to 8.3 per cent during previous quarter, in tandem with moderation in sales growth; consequently, raw material to sales ratio moderated to 54.1 per cent during Q1 from 55.2 per cent in the previous quarter (Table 2A and 2B).
- Staff cost of manufacturing, IT and non-IT services companies rose by 8.3 per cent, 5.8 per cent and 8.0 per cent, respectively, during Q1:2025-26, lower than the growth recorded during the previous quarter. Staff cost to sales ratio for manufacturing, IT and non-IT services companies inched-up to 5.9 per cent, 48.8 per cent, and 10.6 per cent, respectively, during Q1:2025-26 from the previous quarter.
Pricing power
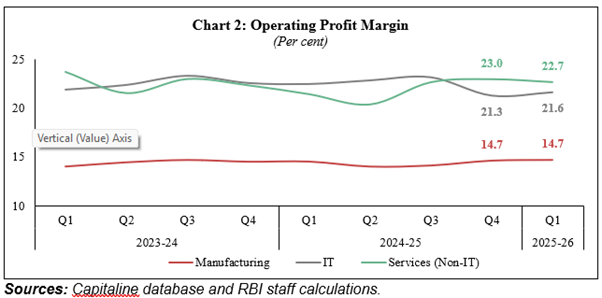
- Operating profit growth of manufacturing and non-IT services companies moderated to 6.9 per cent and 11.3 per cent, respectively, while it improved to 5.4 per cent for IT companies during Q1 from the previous quarter (Table 2A).
- Consequently, operating profit margins improved sequentially for IT companies during Q1:2025-26, while it moderated for non-IT services sector; operating profit margin for the manufacturing sector remained stable during Q1 (Table 2B and Chart 2).
Interest expenses
- With sequential rise in profits, manufacturing companies’ interest coverage ratio (ICR)1 improved to 9.1 in Q1:2025-26 from 8.7 in the previous quarter. Within services sector, while ICR of non-IT services companies remained stable, ICR of IT firms continued to remain at elevated level during Q1:2025-26 (Table 2B).
List of Tables
Table No. |
Title
|
|
1
|
A
|
Performance of Listed Non-Government Non-Financial Companies
|
Growth Rates
|
|
B
|
Select Ratios
|
|
2
|
A
|
Performance of Listed Non-Government Non-Financial Companies – Sector-wise
|
Growth Rates
|
|
B
|
Select Ratios
|
|
3
|
A
|
Performance of Listed Non-Government Non-Financial Companies according to Size of Paid-up-Capital
|
Growth Rates
|
|
B
|
Select Ratios
|
|
4
|
A
|
Performance of Listed Non-Government Non-Financial Companies according to Size of Sales
|
Growth Rates
|
|
B
|
Select Ratios
|
|
5
|
A
|
Performance of Listed Non-Government Non-Financial Companies according to Industry
|
Growth Rates
|
|
B
|
Select Ratios
|
|
Explanatory Notes
|
|
Glossary
|
Notes:
- The coverage of companies in different quarters varies, depending on the date of declaration of results; this is, however, not expected to significantly alter the aggregate position.
- Explanatory notes detailing the compilation methodology, and the glossary (including revised definitions and calculations that differ from previous releases) are appended.
(Puneet Pancholy)
Chief General Manager
Press Release: 2025-2026/969
1ICR (i.e., ratio of earnings before interest and tax to interest expenses) is a measure of debt servicing capacity of a company. The minimum value for ICR is 1 for a company to be viable.
|
 IST,
IST,


