 IST,
IST,
III. Monetary and Liquidity Conditions
Monetary Survey
Monetary and liquidity conditions have generally remained comfortable during 2005-06 so far despite a sustained pick-up in credit demand from the commercial sector to support the buoyant real economic activity. During December 2005, however, the banking system faced some liquidity pressures in the context of the redemption of India Millennium Deposits (IMDs). The Reserve Bank accordingly injected liquidity through repo operations. With the smooth redemption of the IMDs and other liquidity management measures, liquidity conditions eased during the first week of January 2006. Expansion of reserve money, which was higher throughout the first two quarters of the year, exhibited a deceleration during the third quarter. The rising demand for commercial credit was met by banks by restricting their incremental investments in Government papers (Table 15).
|
Table 15: Monetary Indicators |
||||||||||
|
(Amount in Rupees crore) |
||||||||||
|
Item |
Outstanding |
Variation (year-on-year) |
||||||||
|
as on |
||||||||||
|
January 6, |
2004-05 |
2005-06 |
||||||||
|
2006 |
Amount |
Per cent |
Amount |
Per cent |
||||||
|
1 |
2 |
3 |
4 |
5 |
6 |
|||||
|
I. |
Reserve Money* |
5,53,861 |
68,256 |
17.3 |
91,517 |
19.8 |
||||
|
II. |
25,34,422 |
2,58,791 |
13.5 |
3,48,327 |
15.9 |
|||||
|
Broad Money (M3) |
||||||||||
|
a) |
Currency with the Public |
3,97,856 |
39,146 |
12.8 |
52,861 |
15.3 |
||||
|
b) |
Aggregate Deposits |
21,31,915 |
2,18,413 |
13.5 |
2,95,362 |
16.1 |
||||
|
i) |
Demand Deposits |
3,39,271 |
42,122 |
18.9 |
74,627 |
28.2 |
||||
|
ii) |
Time Deposits |
17,92,644 |
1,76,291 |
12.7 |
2,20,735 |
14.0 |
||||
|
of which: Non-Resident Foreign Currency Deposits |
54,441 |
-184 |
-0.2 |
-20,914 |
-27.8 |
|||||
|
III. |
25,58,116 |
2,67,575 |
14.3 |
3,78,013 |
17.3 |
|||||
|
NM3 |
||||||||||
|
of which: Call Term Funding from Financial Institutions |
80,831 |
7,217 |
31.5 |
15,537 |
23.8 |
|||||
|
IV. |
a) |
26,28,182 |
2,73,254 |
14.3 |
4,03,771 |
18.5 |
||||
|
L1 |
||||||||||
|
of which: Postal Deposits |
99,771 |
17,136 |
25.8 |
16,124 |
19.3 |
|||||
|
b) |
26,29,833 |
2,68,639 |
14.0 |
4,03,525 |
18.4 |
|||||
|
L2 |
||||||||||
|
of which: FI Deposits |
1,651 |
-4,615 |
-70.9 |
-246 |
-13.0 |
|||||
|
c) |
26,49,673 |
2,68,236 |
13.8 |
4,03,467 |
18.3 |
|||||
|
L3 |
||||||||||
|
of which: NBFC Deposits |
19,840 |
-403 |
-2.0 |
-58 |
-0.3 |
|||||
|
V. |
Major Sources of Broad Money |
|||||||||
|
a) |
Net Bank Credit to the Government (i+ii) |
7,80,238 |
16,484 |
2.3 |
21,327 |
2.8 |
||||
|
i) |
Net Reserve Bank Credit to Government |
18,941 |
-50,426 |
21,206 |
||||||
|
of which: to the Centre |
18,925 |
-44,144 |
22,611 |
|||||||
|
ii) |
Other Banks’ Credit to Government |
7,61,298 |
66,911 |
9.8 |
121 |
0.0 |
||||
|
b) |
Bank Credit to Commercial Sector |
15,41,796 |
2,13,855 |
22.1 |
3,26,740 |
26.9 |
||||
|
c) |
Net Foreign Exchange Assets of Banking Sector |
6,55,339 |
95,498 |
19.0 |
56,534 |
9.4 |
||||
|
Memo items |
||||||||||
|
Scheduled Commercial Banks’ Aggregate Deposits |
19,39,640 |
2,10,124 |
14.5 |
2,81,617 |
17.0 |
|||||
|
Scheduled Commercial Banks’ Non-food Credit |
13,13,770 |
2,02,585 |
26.6 |
3,18,121 |
32.0 |
|||||
|
* : Data pertain to January 13, 2006. |
||||||||||
Higher appetite of non-bank institutions for Government papers further paved the way for meeting the augmented demand for commercial credit. As a result of these factors and also due to base effects, the broad money (M3) growth has been above the indicative trajectory of 14.5 per cent projected in the Annual Policy Statement (April 2005). M3 growth, however, decelerated from 17.9 per cent on December 23, 2005 to 15.9 per cent on January 6, 2006 reflecting the impact of redemption of IMDs. Expansion in the residency-based new monetary aggregate (NM3) – which excludes foreign currency non-resident deposits like IMDs – was higher than M3.
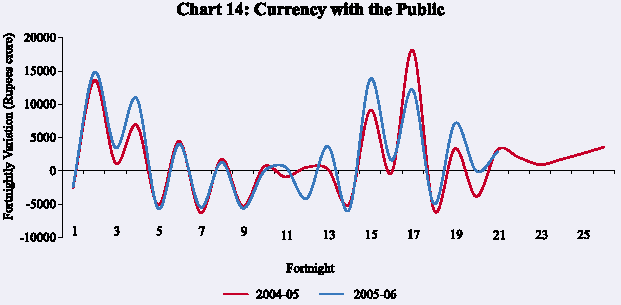
The year-on-year growth in demand for currency as on January 6, 2006 was higher than a year ago. Currency demand exhibited the usual intra-year seasonal pattern, typically increasing during festival seasons and the initial part of the month (Chart 14).
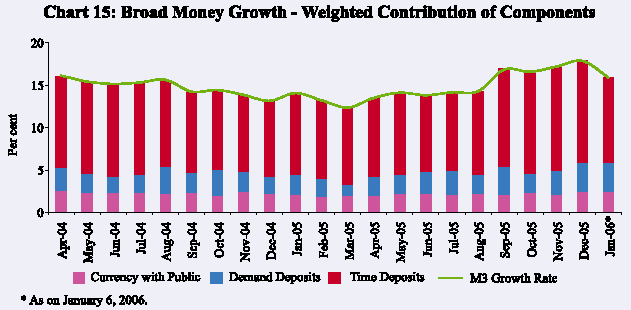
Demand deposits continued with their rapid growth for the second successive year mirroring the sustained pick-up in non-food credit and a buoyant primary capital market, with funds getting temporarily parked in demand deposits (Table 16). With the continued surge in demand deposits, some rise can be observed in weighted contribution of demand deposits in growth of broad money (Chart 15).
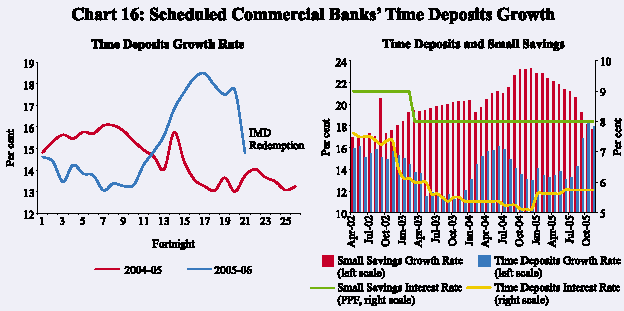
Year-on-year (y-o-y) growth in time deposits of scheduled commercial banks as on January 6, 2006 at 14.8 per cent was higher than that recorded a year ago (13.7 per cent; net of the conversion effect) partly reflecting the base effects. Deceleration in time deposits during the fortnight ended January 6, 2006, however, reflected the impact of IMD redemption. Mobilisation under small savings schemes decelerated to 17.7 per cent by end-November 2005 from a peak of 23.3 per cent
|
Table 16: Monetary Aggregates - Variations |
|||||||||
|
(Rupees crore) |
|||||||||
|
Item |
2004-05 |
2004-05 |
2005-06 |
||||||
|
Q1 |
Q2 |
Q3 |
Q4 |
Q1 |
Q2 |
Q3 |
|||
|
1 |
2 |
3 |
4 |
5 |
6 |
7 |
8 |
9 |
|
|
(=1+2+3 = 4+5+6+7-8) |
2,48,262 |
69,831 |
16,999 |
53,458 |
1,07,975 |
1,08,489 |
1,08,139 |
58,719 |
|
|
M3 |
|||||||||
|
Components |
|||||||||
|
1. |
Currency with the Public |
40,797 |
14,540 |
-3,098 |
15,422 |
13,933 |
19,626 |
-10,248 |
29,629 |
|
2. |
Aggregate Deposits with Banks |
2,06,106 |
56,754 |
19,342 |
37,725 |
92,284 |
90,885 |
1,17,616 |
29,826 |
|
2.1 Demand Deposits with Banks |
25,391 |
-14,038 |
2,094 |
15,721 |
21,614 |
15,150 |
32,907 |
5,004 |
|
|
2.2 Time Deposits with Banks |
1,80,716 |
70,792 |
17,248 |
22,004 |
70,671 |
75,735 |
84,709 |
24,822 |
|
|
3. |
‘Other’ Deposits with RBI |
1,359 |
-1,463 |
755 |
310 |
1,757 |
-2,021 |
771 |
-736 |
|
Sources |
|||||||||
|
4. |
Net Bank Credit to Govt. Sector |
15,002 |
12,986 |
-11,798 |
-4,524 |
18,338 |
10,673 |
-14,031 |
-684 |
|
4.1 RBI’s Net Bank Credit to Govt. Sector |
-62,882 |
-34,143 |
-6,179 |
184 |
-22,744 |
9,275 |
-25,251 |
19,879 |
|
|
4.1.1 RBI’s Net Credit to Central Govt. |
-60,177 |
-30,029 |
-4,499 |
203 |
-25,852 |
14,600 |
-25,251 |
19,812 |
|
|
4.2 Other Bank Credit to Govt. Sector |
77,884 |
47,129 |
-5,619 |
-4,708 |
41,082 |
1,397 |
11,220 |
-20,563 |
|
|
5. |
Bank Credit to Commercial Sector |
2,64,389 |
38,057 |
40,093 |
107,789 |
78,451 |
58,740 |
1,01,219 |
80,634 |
|
6. |
Net Foreign Exchange Assets of |
||||||||
|
Banking Sector |
1,22,669 |
49,206 |
-1,335 |
32,891 |
41,907 |
-13,378 |
24,062 |
23,741 |
|
|
6.1 Net Foreign Exchange Assets of RBI |
1,28,377 |
57,525 |
-5,260 |
31,462 |
44,651 |
-14,595 |
24,823 |
23,741 |
|
|
7. |
Governments’ Net Currency |
||||||||
|
Liabilities to the Public |
152 |
37 |
9 |
89 |
17 |
384 |
910 |
-124 |
|
|
8. |
Net Non-Monetary Liabilities of |
||||||||
|
Banking Sector |
1,53,949 |
30,454 |
9,969 |
82,788 |
30,738 |
-52,071 |
4,020 |
44,848 |
|
|
Memo items |
|||||||||
|
1. |
Non-resident Foreign Currency Deposits |
802 |
953 |
-189 |
-654 |
692 |
550 |
-447 |
1,602 |
|
2. |
SCBs’ Call-term Borrowing from |
||||||||
|
Financial Institutions |
44,853 |
5,409 |
530 |
35,464 |
3,451 |
1,395 |
6,426 |
2,587 |
|
|
3. |
Overseas Borrowing by Scheduled |
||||||||
|
Commercial Banks |
8,529 |
3,012 |
-658 |
6,267 |
-90 |
1,948 |
6,008 |
384 |
|
|
Note : Data reflect conversion of a non-banking entity into a banking entity on October 11, 2004. |
|||||||||
in December 2004. Thus, the differential between the growth rate of small savings and time deposits has narrowed over recent months (Chart 16).
Food credit, during the fiscal year so far, has increased by Rs.1,979 crore –reflecting a lower order of procurement of foodgrains – as compared with an increase of Rs.9,098 crore during the corresponding period of the previous year. On the other hand, a broad-based strengthening of economic activity continued to lead the demand for commercial sector’s credit demand. Scheduled commercial banks’ (SCBs’) non-food credit, on a year-on-year basis, registered a growth of 32.0 per cent as on January 6, 2006 on top of a base as high as 26.6 per cent a year ago. Incremental credit-deposit ratio of SCBs continues to hover around 100 per cent (Chart 17). Latest available data indicate that credit pick-up during April-October 2005 was led by agriculture, industry and housing. Non-SLR investments of SCBs, on the other hand, have declined during the current fiscal year. Accordingly, SCBs’
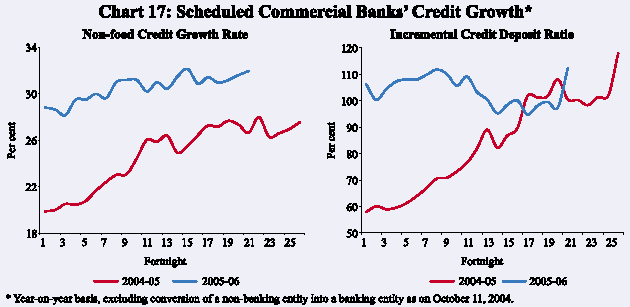
non-food credit, adjusted for non-SLR investments, recorded a year-on-year growth
of 28.3 per cent as on January 6, 2006 as compared with 27.9 per cent a year
ago.
In addition to bank credit, strong flow of funds from non-banks to the corporate sector continued during the third quarter. In particular, resources raised from ADR/ GDR issuances during the quarter ended December 2005 were almost five times the previous quarter. Equity issuances continued to be high during October-December 2005, benefiting from buoyancy in capital markets. Mobilisation through issuances of commercial papers, however, recorded a decline during October-December 2005 in view of tight liquidity conditions in domestic markets. Funds raised through external commercial borrowings (ECBs), after some moderation in the first quarter of 2005-06, again turned substantial during the second quarter. Recourse to medium and long-term ECBs nearly doubled over the first quarter. Short-term trade credits expanded sharply in contrast to a decline in the first quarter. Internal sources –backed by strong corporate sector profitability – also continued to be a substantial source of funds for the corporate sector (Table 17).
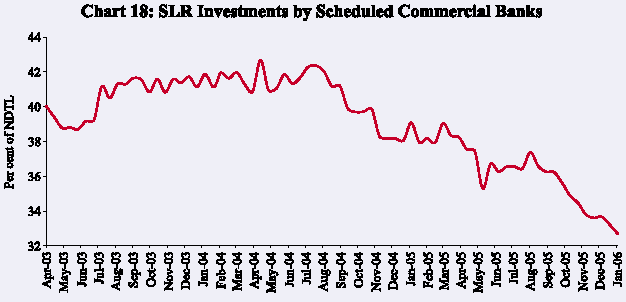
The continued surge in commercial credit had an impact on banks’ portfolio of Government papers. The combined gilt portfolio of commercial and co-operative banks has registered a decline of Rs.14,583 crore during the current fiscal so far (up to January 6, 2006) in contrast to an increase of Rs.50,988 crore (net of the conversion effect) a year ago. Consequently, commercial banks’ holding of government securities continued its downward trajectory: it fell to around 33 per cent of their net demand and time liabilities (NDTL) as on January 6, 2006 from nearly 36 per cent at end-September 2005 and around 39 per cent a year ago, but still in excess of the statutory requirement of 25.0 per cent (Chart 18).
|
Table 17: Select Sources of Funds to Industry |
||||||||||
|
(Rupees crore) |
||||||||||
|
Item |
2004-05 |
2005-06 |
||||||||
|
Q1 |
Q2 |
Q3 |
Q4 |
Q1 |
Q2 |
Q3 |
||||
|
1 |
2 |
3 |
4 |
5 |
6 |
7 |
8 |
|||
|
A. |
Bank Credit to Industry |
6,636 |
11,186 |
13,733 |
21,680 |
11,148 |
28,061 |
9,814@ |
||
|
B. |
Flow from Non-banks to Corporates |
|||||||||
|
1. |
Capital Issues * (i+ii) |
228 |
4,529 |
3,214 |
2,495 |
1,254 |
4,977 |
5,397 |
||
|
i) Non-Government Public Ltd. Companies (a+b) |
228 |
4,529 |
530 |
2,495 |
1,254 |
4,977 |
5,397 |
|||
|
a) Bonds/Debentures |
0 |
0 |
0 |
0 |
118 |
0 |
0 |
|||
|
b) Shares |
228 |
4,529 |
530 |
2,495 |
1,136 |
4,977 |
5,397 |
|||
|
ii) PSUs and Government Companies |
0 |
0 |
2,684 |
0 |
0 |
0 |
0 |
|||
|
2. |
ADR/GDR Issues + |
770 |
0 |
872 |
694 |
783 |
739 |
3,643 |
||
|
3. |
External Commercial Borrowings (ECBs) $ |
12,077 |
3,795 |
10,481 |
13,164 |
3,528 |
12,736 |
– |
||
|
4. |
Issue of CPs |
1,819 |
421 |
1,901 |
963 |
3,562 |
1,928 |
-2,544 |
||
|
C. |
Depreciation Provision ++ |
5,504 |
5,836 |
5,731 |
6,106 |
7,137 |
7,617 |
– |
||
|
D. |
Profit after Tax ++ |
10,396 |
13,004 |
13,196 |
16,798 |
16,726 |
18,169 |
– |
||
|
*:Gross issuances excluding issues by banks and financial institutions.
Figures are not |
||||||||||
Reserve Money Survey
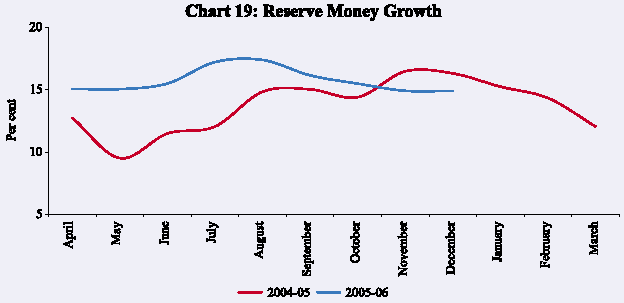
Reserve money growth as on January 13, 2006 at 19.8 per cent was higher than a year ago (17.3 per cent) (Chart 19). During 2005-06 so far, reserve money growth has generally remained above the growth trajectory of 2004-05 reflecting liquidity injection through LAF operations as well as the effect of the increase in the cash reserve ratio (CRR) by 50 basis points during September-October 2004. The dynamics of reserve money during the third quarter were driven by net injection of liquidity – initially through reversal of reverse repos and subsequently through repos under the LAF operations – in an environment of higher credit demand and redemption of IMDs.
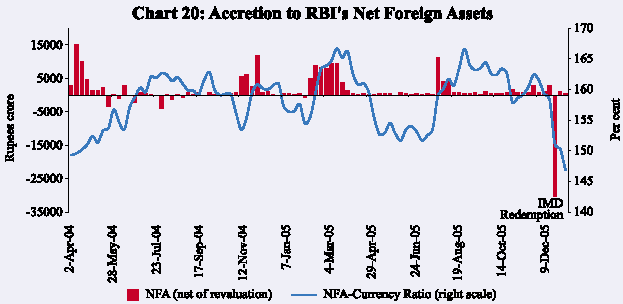
The Reserve Bank’s foreign currency assets (net of revaluation) have increased by Rs. 10,719 crore during fiscal 2005-06 (up to January 13) as compared with an increase of Rs. 60,875 crore during the corresponding period of 2004-05. The lower order of increase during the current year reflects redemption of IMDs on December 29, 2005 out of the foreign exchange reserves of the Reserve Bank (Chart 20). Most of the increase in the NFEA during the current fiscal was concentrated in the three-week period during July 23 – August 12, 2005. This period, as a result, witnessed relatively stronger liquidity absorption operations (Table 18).
|
Table 18: Variation in Major Components and Sources of Reserve Money |
|||||||||
|
(Rupees crore) |
|||||||||
|
Item |
2004-05 |
2004-05 |
2005-06 |
||||||
|
Q1 |
Q2 |
Q3 |
Q4 |
Q1 |
Q2 |
Q3 |
|||
|
1 |
2 |
3 |
4 |
5 |
6 |
7 |
8 |
9 |
|
|
Reserve Money |
52,623 |
-6,812 |
-6,285 |
31,546 |
34,174 |
7,177 |
1,072 |
25,428 |
|
|
Components |
|||||||||
|
1. |
Currency in Circulation |
41,633 |
14,317 |
-4,166 |
16,467 |
15,015 |
19,877 |
-9,479 |
29,130 |
|
2. |
Bankers’ Deposits with RBI |
9,631 |
-19,665 |
-2,874 |
14,769 |
17,401 |
-10,680 |
9,780 |
-2,967 |
|
3. |
Other Deposits with RBI |
1,359 |
-1,463 |
755 |
310 |
1,757 |
-2,021 |
771 |
-736 |
|
Sources |
|||||||||
|
1. |
RBI’s net credit to Government |
-62,882 |
-34,143 |
-6,179 |
184 |
-22,744 |
9,275 |
-25,251 |
19,879 |
|
of which: to Central Government |
-60,177 |
-30,029 |
-4,499 |
203 |
-25,852 |
14,600 |
-25,251 |
19,812 |
|
|
2. |
RBI’s credit to banks and commercial sector |
-833 |
-2,985 |
-740 |
3,726 |
-835 |
1,155 |
-1,869 |
101 |
|
3. |
NFEA of RBI |
128,377 |
57,525 |
-5,260 |
31,462 |
44,651 |
-14,595 |
24,823 |
23,741 |
|
4. |
Government’s Currency Liabilities to the Public |
152 |
37 |
9 |
89 |
17 |
384 |
910 |
-124 |
|
5. |
Net Non-Monetary Liabilities of RBI |
12,191 |
27,245 |
-5,885 |
3,916 |
-13,085 |
-10,957 |
-2,460 |
18,169 |
|
Memo items |
|||||||||
|
1. |
Net Domestic Assets |
-75,754 |
-64,336 |
-1,025 |
84 |
-10,477 |
21,771 |
-23,751 |
1,687 |
|
2. |
FCA, adjusted for revaluation |
115,044 |
33,160 |
-3,413 |
29,858 |
55,440 |
5,034 |
23,665 |
11,998 |
|
3. |
Net Purchases from Authorised Dealers |
91,105 |
30,032 |
-9,789 |
22,771 |
48,091 |
0 |
17,027 |
0 |
|
4. |
NFEA/Reserve Money (per cent) (end-period) |
125.3 |
126.1 |
126.7 |
124.9 |
125.3 |
120.5 |
125.3 |
123.7 |
|
5. |
NFEA/Currency (per cent) |
166.2 |
158.8 |
159.2 |
160.7 |
166.2 |
154.0 |
164.4 |
158.4 |
|
NFEA : Net Foreign Exchange Assets. |
|||||||||
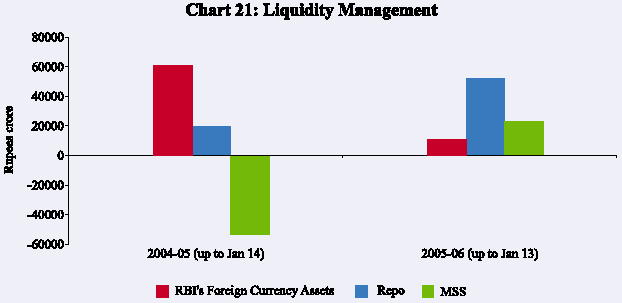
In the face of strong credit demand and the lower order of accretion of the foreign exchange reserves to the Reserve Bank during the current fiscal, liquidity management operations during 2005-06 so far have for the most part been in the form of net liquidity injection through operations under the liquidity adjustment facility (LAF) and unwinding of balances under the market stabilisation scheme (MSS) in contrast to liquidity absorption through a heavy reliance on issuances under the MSS during the comparable period of the preceding year (Chart 21).
In the absence of any subscription to the Government’s market borrowing programme, the Reserve Bank’s net credit to the Centre reflected liquidity management operations of the Reserve Bank (Table 19). Mirroring the liquidity
|
Table 19: Net Reserve Bank Credit to the Centre - Variations |
||||||||||
|
(Rupees crore) |
||||||||||
|
Item |
2004-05 |
2004-05 |
2005-06 |
|||||||
|
Q1 |
Q2 |
Q3 |
Q4 |
Q1 |
Q2 |
Q3 |
||||
|
1 |
2 |
3 |
4 |
5 |
6 |
7 |
8 |
9 |
||
|
Net Reserve Bank Credit to the Centre (1+2+3+4-5) |
-60,177 |
-30,029 |
-4,499 |
203 |
-25,852 |
14,600 |
-25,251 |
19,812 |
||
|
1. |
Loans and Advances |
0 |
3,222 |
-3,222 |
0 |
0 |
0 |
0 |
0 |
|
|
2. |
Treasury Bills held by the Reserve Bank |
0 |
0 |
0 |
0 |
0 |
0 |
0 |
0 |
|
|
3. |
Reserve Bank’s Holdings of Dated Securities |
12,323 |
-2,900 |
22,176 |
14,095 |
-21,048 |
8,221 |
-17,243 |
19,378 |
|
|
4. |
Reserve Bank’s Holdings of Rupee Coins |
57 |
175 |
-10 |
-94 |
-14 |
-40 |
-33 |
157 |
|
|
5. |
Central Government Deposits |
72,558 |
30,525 |
23,443 |
13,799 |
4,791 |
-6,419 |
7,974 |
-277 |
|
|
Memo items* |
||||||||||
|
1. |
Market Borrowings of Dated Securities by the Centre# |
80,350 |
28,000 |
26,000 |
14,000 |
12,350 |
42,000 |
39,000 |
24,000 |
|
|
2. |
Reserve Bank’s Primary Subscription to |
|||||||||
|
Dated Securities |
1,197 |
0 |
847 |
0 |
350 |
0 |
0 |
0 |
||
|
3. |
Repos (+) / Reverse Repos (-) (LAF), net position |
15,315 |
-26,720 |
34,205 |
27,600 |
-19,770 |
9,660 |
-14,835 |
18,635 |
|
|
4. |
Net Open Market Sales + |
2,899 |
429 |
427 |
871 |
1,171 |
1,543 |
941 |
261 |
|
|
5. |
Mobilisation under MSS |
64,211 |
37,812 |
14,444 |
353 |
11,602 |
7,469 |
-4,353 |
-19,713 |
|
|
6. |
Primary Operations $ |
-6,625 |
37,353 |
-30,484 |
-36,984 |
23,490 |
18,205 |
-24,689 |
-38,715 |
|
|
* : At face value. |
||||||||||
injection operations, the Reserve Bank’s net credit to the Centre has lodged an increase of Rs.69,955 crore during the current fiscal year so far (up to January 13, 2006) in contrast to a decline of Rs.27,012 crore during the comparable period of 2004-05.
Liquidity Management
Against the backdrop of sustained pick-up in domestic credit demand as also the redemption of IMDs, third quarter of fiscal 2005-06 witnessed liquidity injection operations by the Reserve Bank. Liquidity management operations during 2005-06 so far can be analysed in terms of four phases (Table 20). During the first period beginning end-March 2005 up to July 22, 2005, banks scaled down their balances under reverse repos due to the sharp widening of the trade deficit, the FII outflows during April-May 2005 and buoyant credit demand. Reversal of reverse repo operations led to net injection of primary liquidity by the Reserve Bank.
During July 23 - August 12, following the sudden spurt in foreign exchange inflows and a reduction in the Centre’s surplus investment balances with the Reserve Bank, liquidity in the system increased considerably; this resulted in a sharp increase in absorption of liquidity by the Reserve Bank through LAF reverse repo rising from Rs.10,485 crore as on July 22 to Rs.37,050 crore as on August 12, peaking at Rs.50,610 crore as on August 3, 2005.
In the third phase (August 13 – October 28), again, the Reserve Bank’s purchase of foreign exchange assets moderated. Government surplus balances
|
Table 20: Phases of Reserve Bank’s Liquidity Management Operations |
||||||
|
(Rupees crore) |
||||||
|
April 1 - |
July 23 - |
August 13 - |
October |
|||
|
July 22, |
August 12, |
October 28, |
29, 2005 - |
|||
|
2005 |
2005 |
2005 |
January 13, |
|||
|
2006 |
||||||
|
1 |
2 |
3 |
4 |
5 |
||
|
A. |
Drivers of Liquidity (1+2+3) |
-6,737 |
27,792 |
-15,127 |
-62,943 |
|
|
1. |
RBI’s Foreign Currency Assets (adjusted for revaluation) |
6,412 |
19,348 |
5,193 |
-20,235 |
|
|
2. |
Currency with the Public |
-15,274 |
-1,529 |
-7,940 |
-23,685 |
|
|
3. |
Others (residual) |
2,125 |
9,973 |
-12,380 |
-19,023 |
|
|
3.1 Surplus Cash balances of the Centre with the Reserve Bank |
6,053 |
5,972 |
-7,421 |
-14,633 |
||
|
B. |
Management of Liquidity (4+5+6+7) |
1,329 |
-24,567 |
16,187 |
81,985 |
|
|
4. |
Liquidity impact of LAF Repos |
8,845 |
-26,565 |
16,210 |
53,415 |
|
|
5. |
Liquidity impact of OMO* (net) |
0 |
0 |
0 |
0 |
|
|
6. |
Liquidity impact of MSS |
-7,516 |
1,998 |
-23 |
28,570 |
|
|
7. |
First round liquidity impact due to CRR change |
0 |
0 |
0 |
0 |
|
|
C. Bank Reserves # (A+B) |
-5,408 |
3,225 |
1,060 |
19,042 |
||
|
+: Indicates injection of liquidity into the banking system. |
||||||
with the Reserve Bank also started building up leading to some tightness in liquidity. Concomitantly, this phase again experienced unwinding of LAF reverse repo balances (Table 21 and Chart 22). On an average, liquidity conditions were broadly stable and comfortable and the call money rates, therefore, generally stayed within the repo rate corridor. In view of comfortable liquidity conditions till the third phase, the Reserve Bank injected liquidity through LAF repos only on four occasions; on a net basis, the Reserve Bank absorbed liquidity even on those four days.
During the fourth phase (end-October 2005 to mid-January 2006), the banking system faced tightness with liquidity pressures emanating from festival season currency demand, scheduled auctions, advance tax outflows and redemption of IMDs against the backdrop of sustained growth in credit demand. In view of the tight liquidity conditions, the Reserve Bank provided liquidity on a net basis to the market through repo operations during November 9-18, 2005 (daily average net injection of Rs.1,094 crore). In order to assuage the liquidity conditions, auctions of Treasury Bills (TBs) under the MSS were cancelled effective
|
Table 21: Liquidity Overhang |
||||
|
(Rupees crore) |
||||
|
Outstanding as on |
LAF |
MSS |
Centre's Surplus |
Total (2 to 4) |
|
last Friday of |
with the RBI @ |
|||
|
1 |
2 |
3 |
4 |
5 |
|
2004 |
||||
|
April |
73,075 |
22,851 |
0 |
95,926 |
|
May |
72,845 |
30,701 |
0 |
1,03,546 |
|
June |
61,365 |
37,812 |
0 |
99,177 |
|
July |
53,280 |
46,206 |
0 |
99,486 |
|
August |
40,640 |
51,635 |
7,943 |
1,00,218 |
|
September |
19,245 |
52,255 |
21,896 |
93,396 |
|
October |
7,455 |
55,087 |
18,381 |
80,923 |
|
November |
5,825 |
51,872 |
26,518 |
84,215 |
|
December |
2,420 |
52,608 |
26,517 |
81,545 |
|
2005 |
||||
|
January |
14,760 |
54,499 |
17,274 |
86,533 |
|
February |
26,575 |
60,835 |
15,357 |
1,02,767 |
|
March |
19,330 |
64,211 |
26,102 |
1,09,643 |
|
April |
27,650 |
67,087 |
6,449 |
1,01,186 |
|
May |
33,120 |
69,016 |
7,974 |
1,10,110 |
|
June |
9,670 |
71,681 |
21,745 |
1,03,096 |
|
July |
18,895 |
68,765 |
16,093 |
1,03,753 |
|
August |
25,435 |
76,936 |
23,562 |
1,25,933 |
|
September |
24,505 |
67,328 |
34,073 |
1,25,906 |
|
October |
20,840 |
69,752 |
21,498 |
1,12,090 |
|
November |
3,685 |
64,332 |
33,302 |
1,01,319 |
|
December |
-27,755# |
46,112 |
45,855 |
64,212 |
|
2006 |
||||
|
January* |
-32,575# |
41,183 |
36,348 |
44,956 |
|
* :As on January 14, 2006. |
||||
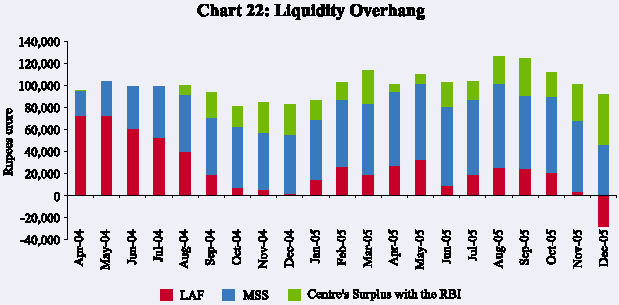
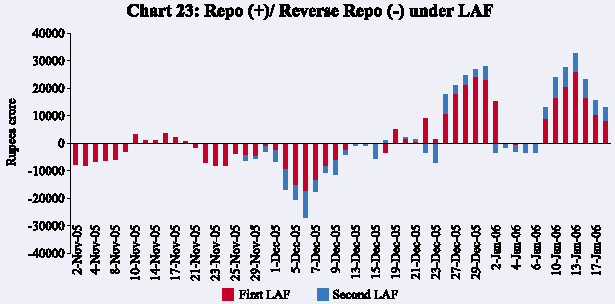
November 16, 2005. Moreover, to fine-tune the management of liquidity and in response to suggestions from the market participants, the Reserve Bank introduced a Second Liquidity Adjustment Facility (SLAF), with effect from November 28, 2005 (Chart 23).
Liquidity pressures again emerged from the second week of December 2005 and the outstanding balances under LAF reverse repos started coming down. The pressures increased further as advance tax outflows coincided with the redemption of the IMDs. In connection with the redemption of IMDs, the Reserve Bank sold foreign exchange of US $ 7.1 billion out of its foreign exchange reserves to the State Bank of India during December 27-29, 2005 against equivalent rupees
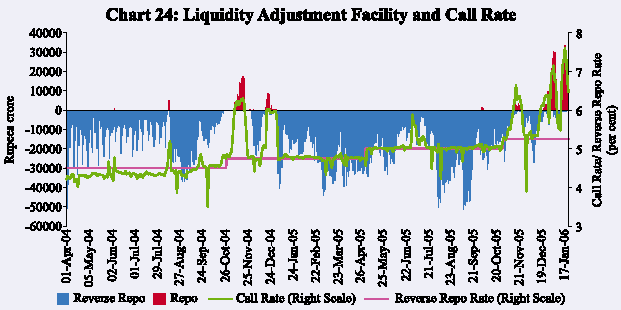
(Rs.31,959 crore). Reflecting the liquidity conditions, call rates remained above the repo rate during the second half of December 2005. Although during this phase there was unwinding of MSS balances on account of the decision to cancel the MSS portion of the TB auctions, liquidity pressures persisted. The Reserve Bank, therefore, injected liquidity through repo operations with a peak amount of Rs.30,110 crore on December 29, 2005 (daily average net injection of Rs.23,138 crore during December 26, 2005 - January 2, 2006) (Chart 24). Commercial banks’ borrowing from the Reserve Bank also increased during the fourth phase (Rs.2,089 crore) reflecting the liquidity conditions. On a review of the prevalent macroeconomic, monetary and liquidity conditions, including the redemptions of IMDs, the Reserve Bank decided on December 30, 2005 to suspend the issue of Treasury Bills and dated securities under the MSS. However, within the overall MSS ceiling for 2005-06, the Reserve Bank would retain the flexibility of conducting auctions under the MSS from time to time with sufficient notice to the market, in response to evolving circumstances. All these measures along with the smooth redemption of the IMDs and reduction in the Centre’s surplus investments eased the liquidity conditions during the first week of January 2006 and the call rates softened. Liquidity pressures re-emerged from the second week of January 2006 on account of outflows under auctions of dated securities. The Reserve Bank, therefore, injected liquidity through LAF repos during January 9-18, 2006. The outstanding repo amount stood at Rs.12,935 crore as on January 18, 2006.
ପେଜ୍ ଅନ୍ତିମ ଅପଡେଟ୍ ହୋଇଛି:


