 IST,
IST,
Industrial Outlook Survey of the Manufacturing Sector for Q2:2018-19 (Revised)
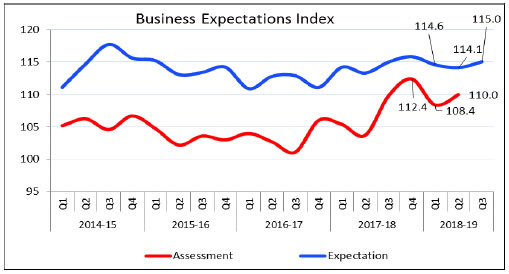
Today, the Reserve Bank released the results of the 83rd round of the Industrial Outlook Survey (IOS) conducted in July-September 2018. The Survey captures qualitative assessments of the business environment by companies in India’s manufacturing sector for Q2:2018-19 and their expectations for Q3:2018-191. Responses were received from 1095 companies in this round of the survey. Highlights:

1 The survey responses are those of the respondents and are not necessarily shared by the Reserve Bank of India. The 82nd round (Q1:2018-19) survey results were released on August 1, 2018 on the RBI website. 2 The Business Expectations Index (BEI) is a composite indicator calculated as a weighted (share of GVA of different industry group) net response of nine business indicators. The nine indicators considered for the computation of the BEI are: (1) overall business situation; (2) production; (3) order books; (4) inventory of raw material; (5) inventory of finished goods; (6) profit margins; (7) employment; (8) exports; and (9) capacity utilisation. It gives a snapshot of the business outlook in every quarter. BEI takes values between 0 and 200, and 100 is the threshold separating expansion from contraction. 3 Net Response (NR) is the difference of percentage of the respondents reporting optimism and that reporting pessimism. The range is -100 to 100. Any value greater than zero indicates expansion/optimism and any value less than zero indicates contraction/pessimism i.e., NR = (I – D); where, I is the percentage response of ‘Increase/optimism’, and D is the percentage response of ‘Decrease/pessimism’ and E is the percentage response as ‘no change/Equal’; I+D+E=100. For example, increase in production is optimism whereas decrease in cost of raw material is optimism. | |||||||||||||||||||||||||||||||||||||||||||||||||||||||||||||||||||||||||||||||||||||||||||||||||||||||||||||||||||||||||||||||||||||||||||||||||||||||||||||||||||||||||||||||||||||||||||||||||||||||||||||||||||||||||||||||||||||||||||||||||||||||||||||||||||||||||||||||||||||||||||||||||||||||||||||||||||||||||||||||||||||||||||||||||||||||||||||||||||||||||||||||||||||||||||||||||||||||||||||||||||||||||||||||||||||||||||||||||||||||||||||||||||||||||||||||||||||||||||||||||||||||||||||||||||||||||||||||||||||||||||||||||||||||||||||||||||||||||||||||||||||||||||||||||||||||||||||||||||||||||||||||||||||||||||||||||||||||||||||||||||||||||||||||||||||||||||||||||||||||||||||||||||||||||||||||||||||||||||||||||||||||||||||||||||||||||||||||||||||||||||||||||||||||||||||||||||||||||||||||||||||||||||||||||||||||||||||||||||||||||||||||||||||||||||||||||||||||||||||||||||||||||||||||||||||||||||||||||||||||||||||||||||||||||||||||||||||||||||||||||||||||||||||||||||||||||||||||||||||||
ପେଜ୍ ଅନ୍ତିମ ଅପଡେଟ୍ ହୋଇଛି:


