Introduction
5.1 Non-banking financial institutions (NBFIs), a heterogeneous group of diverse institutions, form an integral part of the Indian financial system providing a range of financial services. This is an important segment of financial institutions in India apart from commercial and co-operative banks. Within the non-banking financial institutions, development finance institutions (DFIs) are mostly Government-owned and have been the traditional providers of long-term project loans. Other non-banking institutions include a wide variety of intermediaries such as insurance companies, non-bank financial companies (NBFCs), primary dealers (PDs) and capital market intermediaries such as mutual funds.
5.2 Historically, all-India financial institutions (AIFIs or FIs) have played a very important role in providing medium and long-term credit to various sectors of the economy. However, in the changed operating environment, the relative significance of AIFIs has declined, especially after the conversion of two major financial institutions (IDBI and ICICI) into banks. NBFCs, incorporated under the Companies Act, 1956, are actively engaged in lease finance, hire purchase finance, investments in securities, grants of loans, including bills discounting, insurance, stock broking, merchant banking and housing finance. Primary dealers in the Government securities market constitute a systemically important segment of the NBFCs. The structure of the PD system underwent significant changes during 2006-07 as they were allowed to diversify into other businesses and wind up their step-down subsidiaries, if any. As a result of the restructuring, the number of stand-alone PDs reduced to 8 during 2006-07 from 17 in the previous year. Most of the PDs are promoted by banks.
5.3 NBFIs form a diverse group not only in terms of size and nature of incorporation, but functionally as well. Apart from enhancing competition in the financial system, these institutions play a crucial role in broadening the access of a vast section of the population to financial services by offering a variety of products and services. The overlap between products offered by banks and non-banking institutions is increasing by the day calling for a closer co-ordination in the regulation of banks and non-banks. The role that some of the FIs play acquired greater significance in view of the emergence of financial inclusion as one of the major policy objectives since they can play a critical role as an instrument of credit delivery, particularly in the small scale and retail sectors.
5.4 Given the importance of the NBFC sector, the Reserve Bank is examining the issue of smooth flow of bank finance to NBFCs in order to develop them into a financially strong sector with improved skills and technology. In view of the increased need to support financing of the SME sector and agri-related activities and taking into account the critical role that NBFCs can play as an instrument of credit delivery, the Small Industries Development Bank of India (SIDBI) and the National Bank for Agriculture and Rural Development (NABARD) have agreed to evolve a viable credit dispensation arrangement to provide resource support to NBFCs catering to the needs of the SME and agriculture sectors. These institutions would also evolve appropriate mechanisms, in consultation with NBFCs, to address their needs in this regard and provide support in terms of their capacity building to develop expertise for financing the SME and agricultural sectors.
5.5 Regulatory initiatives in respect of FIs during 2006-07 focussed mainly on strengthening the prudential guidelines relating to income recognition, asset classification and provisioning. Financial assistants sanctioned by FIs grew at a lower rate as compared with last year, while the disbursements witnessed a sharp rise. However, their balance sheets expanded at a significantly higher rate. Sharp growth in net interest income as well as non-interest income coupled with decline in operating expenses resulted in higher profits for the FIs. Asset quality of FIs improved significantly during the year. The capital adequacy ratio, in general, continued to be significantly higher than the minimum prescribed.
5.6 The focus of regulatory measures in respect to NBFCs was on diversifying their areas of businesses by allowing them to issue co-branded cards and distribute mutual fund products, regulation of systemically important NBFCs, fair practices code and corporate governance. There has been a marked shift in the policy stance of regulating non-deposit taking NBFCs having an asset size of Rs.100 crore and above due to their systemic importance. The assets/liabilities of NBFCs [excluding Residuary Non-banking Companies (RNBCs)] expanded at a much higher rate of 26.9 per cent during 2006-07 as compared with the moderate rise of 5.1 per cent during 2005-06. The financial performance of NBFCs turned around during 2006-07 entirely on account of sharp rise in fund based income, which offset the sharp rise in operating expenditure and financial expenditure. As a result both operating profits and net profit witnessed a rise. The asset quality also improved significantly. The proportion of NBFCs with CRAR above 30 per cent as also with CRAR of less than 12 per cent declined over the year.
5.7 The Primary dealer (PD) system underwent significant changes during 2006-07. In order to diversify the risks inherent in the PD business, PDs were permitted to diversify into other business lines while retaining the requirement of maintaining predominance in Government securities business. Concomitantly, with a view to ensuring that the balance sheets of the PDs do not get affected by the spillover of risks from other businesses/ subsidiaries and that the PDs are focused on their primary dealership activities, it was decided that PDs would not be permitted to set up step-down subsidiaries. Those PDs that already had step-down subsidiaries (in India and abroad) were advised to restructure the ownership pattern of those subsidiaries. In compliance with these guidelines, five PDs, which either had step-down subsidiaries or undertook businesses other than those specifically permitted, restructured their operations.
5.8 The income earned by PDs increased sharply during 2006-07. However, the increase in expenditure was significantly higher than the increase in income. As a result, net profits of PDs declined by 20 per cent. The CRAR of PDs was much in excess of the stipulated minimum of 15 per cent of aggregate risk weighted assets.
5.9 The present chapter is organised into four sections. The policy developments, business operations and financial performance of financial institutions are set out in Section 2. Section 3 focuses on the regulatory measures and the financial performance of NBFCs. The last section of the Chapter deals with the policy developments relating to primary dealers and their operations.
2. Financial Institutions
5.10 Over the years, a wide range of FIs came into existence to cater to the medium to long-term financing requirements of different sectors of the economy. Based on the major activity undertaken by them, AIFIs are classified into three broad categories. First, there exist the term-lending institutions, viz., Industrial Finance Corporation India Ltd. (IFCI), Industrial Investment Bank of India Ltd. (IIBI), Export-Import Bank of India (EXIM Bank) and Tourism Finance Corporation of India (TFCI). Second, there are refinance institutions such as NABARD, SIDBI and National Housing Bank (NHB), which extend refinance to banks as well as NBFIs. In the third category are the investment institutions such as LIC, which deploy their assets largely in marketable securities. State/regional level institutions are a distinct group and comprise various State Financial Corporations (SFCs), State Industrial and Development Corporations (SIDCs) and North Eastern Development Finance Corporation Ltd. (NEDFi). Some of these FIs have been notified as Public Financial Institutions by the Government of India under Section 4A of the Companies Act, 1956.
5.11 As at end-March 2007, there were seven FIs being regulated by the Reserve Bank, viz., EXIM Bank, IFCI, IIBI, NABARD, NHB, SIDBI and TFCI. Of these, five FIs (EXIM Bank, IFCI, NABARD, NHB, SIDBI) were under the full-fledged regulation and supervision of the Reserve Bank. FIs not accepting public deposits but having asset size of Rs.500 crore and above are subject to limited off-site supervision by the Reserve Bank. TFCI belongs to this category, while IIBI is in the process of voluntary winding-up. The exemption given to IFCI from NBFC regulations was withdrawn in August 2007 and it is now being regulated as a systemically important non-deposit taking non-banking financial company (NBFC-ND-SI).
Regulatory Initiatives for Financial Institutions
5.12 In continuation with the policy initiatives undertaken by the Reserve Bank in recent years for progressive upgradation of the regulatory norms for FIs in convergence with the norms across the financial sector, a number of measures were undertaken during 2006-07.
Income Recognition, Asset Classification and Provisioning
5.13 Norms for income recognition, asset classification and provisioning concerning Government guaranteed exposures were modified during 2006-07. Previously, asset classification and provisioning requirements in respect of State Government guaranteed exposures were contingent upon the invocation of the Government guarantee. Pursuant to the recommendations of the Technical Group on Refinancing Institutions (Chairman: Shri G P Muniappan), the asset classification and provisioning requirements were de-linked from the invocation of Government guarantee. With effect from March 31, 2007, State Government guaranteed advances and investments in State Government guaranteed securities attract the asset classification and provisioning norms if the interest and/or principal or any other amount due to the FI remains overdue for more than 90 days. However, the period of default in respect of agricultural activity is related to the agricultural cycle instead of 90 days. The credit facilities backed by guarantee of the Central Government, though overdue, may be treated as NPA only when the Government repudiates its guarantee when invoked. This provision for exemption from classification of Central Government guaranteed advances as NPA, however, is not applicable in the case of income recognition, where the existing norms continue.
Reduction in Regulatory Forbearance
5.14 Previously, certain public sector banks (PSU banks) were given relaxation from the prudential norms in respect of their restructured investment in IFCI Ltd. on a year-to-year basis from the year 2002-03. This relaxation was withdrawn during the year and the PSU banks were advised to mark to market their restructured investment in IFCI as on June 30, 2007. These banks have been allowed to phase out the necessary provisioning on a quarterly basis in respect of their restructured investment in IFCI Ltd. over four-quarters on a pro-rata basis, ensuring that the full provision is made by March 31, 2008.
Strengthening of Regulatory Focus on SIDBI
5.15 A number of measures were undertaken for tightening the regulatory focus on SIDBI, particularly with regard to its exposure to SFCs. The risk weight on SIDBI’s exposure to SFCs was raised from 100 per cent to 125 per cent. SIDBI was advised to make full provisions in respect of the SFCs that had defaulted even after restructuring/one-time settlement (OTS) package was extended to them and not to sanction refinance to those SFCs that continue to show negative net worth. Furthermore, in view of the large exposure of SIDBI to SFCs, which are prone to risks, SIDBI was advised to follow the norms applicable to banks in asset classification and provisioning in respect of its exposure to SFCs which involved a change to ‘borrower-wise’ classification from that of ‘facility-wise’ classification applicable to FIs. SIDBI has also been advised to ensure that all SFCs follow uniform accounting standards similar to those followed by banks.
Operations of Financial Institutions
5.16 Financial assistance sanctioned and disbursed by FIs continued to expand during 2006-07. While sanctions grew at a lower rate as compared with the last year, disbursements witnessed a sharp rise. The slowdown in sanctions was accounted for mainly by all-India term-lending institutions, especially SIDBI. Financial assistance sanctioned and disbursed by specialised financial institutions accelerated. In the case of investment institutions, while financial assistance sanctioned decelerated, financial assistance disbursed accelerated sharply accounted for mainly by LIC (Table V.1 and Appendix Table V.1).
Table V.1: Financial Assistance Sanctioned and Disbursed by Financial Institutions |
(Amount in Rs. crore) |
Item |
|
Amount |
Percentage Variation |
|
|
2005-06 |
2006-07 |
2005-06 |
2006-07 |
|
|
S |
D |
S |
D |
S |
D |
S |
D |
1 |
|
2 |
3 |
4 |
5 |
6 |
7 |
8 |
9 |
i) |
All-India Term-lending Institutions* |
11,975 |
9,287 |
12,234 |
10,679 |
31.4 |
47.1 |
2.2 |
15.0 |
ii) |
Specialised Financial Institutions# |
133 |
88 |
245 |
120 |
19.0 |
22.0 |
84.0 |
36.0 |
iii) |
Investment Institutions@ |
15,558 |
11,771 |
18,759 |
27,857 |
49.0 |
31.0 |
20.6 |
136.0 |
Total Assistance by FIs (i+ii+iii) |
27,666 |
21,146 |
31,238 |
38,656 |
41.0 |
38.0 |
12.9 |
82.8 |
S : Sanctions. D : Disbursements.
* : Relating to IFCI, SIDBI and IIBI.
# : Relating to IVCF, ICICI Venture and TFCI.
@ : Relating to LIC, GIC and erstwhile subsidiaries (NIA,UIIC & OIC).
Note : All data are provisional.
Source : Respective Financial Institutions. |
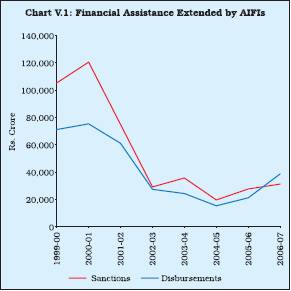
5.17 Financial assistance sanctioned and disbursed (in absolute terms) by AIFIs, after showing a decline between 2000-01 and 2004-05, increased in the last two years. In contrast to the trend witnessed in the last few years, the disbursements during 2006-07, were larger than the sanctions (Chart V.1).
Assets and Liabilities of FIs
5.18 The combined balance sheets of FIs during 2006-07 expanded at a higher rate of 14.9 per cent compared with 8.2 per cent in the previous year. On the liabilities side, the resources raised by way of bonds and debentures, which form the major constituent with 43.5 per cent share, increased at a lower rate of 8.4 per cent compared with 11.6 per cent during 2005-06 (Table V.2). Deposits and borrowings with their respective shares of about 13 per cent each, registered a much sharper increase during the year. The growth in deposits during the year was far more pronounced at 51.5 per cent in comparison with the modest increase of 8.7 per cent in the past year. On the assets side, loans and advances portfolio continued to expand, albeit with some moderation in sync with the sharp credit growth by the banking sector. Investment portfolio of FIs declined by 14.4 per cent over and above the decline of 23.5 per cent in the previous year.
Resources Mobilised by FIs
5.19 AIFIs raised resources during 2006-07 in both rupee and foreign currency. Rupee resources
Table V.2: Liabilities and Assets of |
Financial Institutions |
(As at end-March) |
(Amount in Rs. crore) |
Item |
Amount |
Percentage Variation |
|
2006 |
2007 |
2005-06 |
2006-07 |
1 |
2 |
3 |
4 |
5 |
Liabilities |
|
|
|
|
1. |
Capital |
5,431 |
4,888 |
1.9 |
-10.0 |
|
|
(3.7) |
(2.9) |
|
|
2. |
Reserves |
15,211 |
15,886 |
8.1 |
4.4 |
|
|
(10.5) |
(9.5) |
|
|
3. |
Bonds and |
67,145 |
72,766 |
11.6 |
8.4 |
|
Debentures |
(46.2) |
(43.5) |
|
|
4. |
Deposits |
14,520 |
21,998 |
8.7 |
51.5 |
|
|
(10.0) |
(13.2) |
|
|
5. |
Borrowings |
18,950 |
22,401 |
8.8 |
18.2 |
|
|
(13.0) |
(13.4) |
|
|
6. |
Other Liabilities |
24,217 |
29178 |
0.5 |
20.5 |
|
|
(16.7) |
(17.5) |
|
|
Total Liabilities/Assets |
1,45,474 |
1,67,117 |
8.2 |
14.9 |
|
|
(100.0) |
(100.0) |
|
|
Assets |
|
|
|
|
|
1. |
Cash and Bank |
9,915 |
10,125 |
-39.9 |
2.1 |
|
Balance |
(6.8) |
(6.1) |
|
|
2. |
Investments |
10423 |
8,922 |
-23.5 |
-14.4 |
|
|
(7.7) |
(5.3) |
|
|
3. |
Loans and Advances |
1,11,441 |
1,32,424 |
21.3 |
18.8 |
|
|
(76.6) |
(79.2) |
|
|
4. |
Bills Discounted/ |
1,810 |
1,922 |
72.7 |
6.2 |
|
Rediscounted |
(1.2) |
(1.2) |
|
|
5. |
Fixed Assets |
1,088 |
1,489 |
-5.0 |
36.9 |
|
|
(0.8) |
(1.0) |
|
|
6. |
Other Assets |
10,797 |
12,235 |
5.2 |
13.3 |
|
|
(7.4) |
(7.3) |
|
|
Note :
1. Data pertain to six FIs, viz., IFCI Ltd., TFCI Ltd.
NABARD, NHB, SIDBI and EXIM Bank.
IIBI Ltd. was under voluntary winding up as on March 31, 2007
. Data including IIBI Ltd. are only for the year ended March 31, 2006.
2. Figures in parentheses are percentages to total liabilities/assets.
Source : Balance sheets of respective FIs, unaudited off-site
returns for NHB and audited limited supervisory return for TFCI Ltd. |
include both long-term and short-term funds. While long-term rupee resources consist of bonds and borrowings, short-term resources comprise of commercial paper (CP), term deposits, inter-corporate deposits (ICDs), certificate of deposits (CDs) and borrowings from the term money market. Foreign currency resources mainly include bonds and borrowings.
5.20 Resources raised by FIs during 2006-07 were higher than those raised during 2005-06.
Table V.3: Resources Mobilised by Financial Institutions |
(As at end-March) |
(Amount in Rs. crore) |
Institution |
Total Resources Raised |
Total |
|
Long-term |
Short-term |
Foreign Currency |
Total |
Outstanding |
|
2006 |
2007 |
2006 |
2007 |
2006 |
2007 |
2006 |
2007 |
2006 |
2007 |
1 |
2 |
3 |
4 |
5 |
6 |
7 |
8 |
9 |
10 |
11 |
TFCI |
– |
– |
66 |
– |
– |
– |
66 |
– |
390 |
331 |
EXIM Bank |
3,260 |
3,212 |
1,124 |
3,249 |
3,063 |
4,159 |
7,446 |
10,620 |
15,836 |
21,137 |
SIDBI |
2,610 |
572 |
420 |
1,274 |
459 |
331 |
3,489 |
2,176 |
11,030 |
10,928 |
NABARD |
8,395 |
10,899 |
– |
– |
– |
– |
8,395 |
10,899 |
23,313 |
31,260 |
NHB |
5,342 |
9,682 |
1,220 |
3,079 |
– |
– |
6,562 |
12,761 |
16,344 |
18,475 |
Total |
19,607 |
24,365 |
2,764 |
7,602 |
3,522 |
4,490 |
25,958 |
36,456 |
66,913 |
82,131 |
– : Nil/Negligible.
Note : Long-term rupee resources comprise borrowings by way
of bonds/debentures, while short-term resources comprise
CPs, term deposits, ICDs, CDs and borrowing from the term
money. Foreign currency resources comprise largely bonds and
borrowings in the international market.
Source : Balance Sheets of respective FIs. |
Both short-term and long-term rupee resources increased. Resources raised in foreign currency also increased significantly. NHB mobilised the largest amount of resources, followed by NABARD, EXIM Bank and SIDBI (Table V.3 and Appendix Table V.2). IFCI and IIBI continued to be barred from mobilising fresh resources on account of their poor financial performance.
5.21 Resources raised by FIs from the money market during 2006-07 were significantly higher than those raised during 2005-06. In all, however, FIs utilised just 17.3 per cent of the umbrella limit sanctioned; the utilisation was 13.1 per cent during the previous year (Table V.4).
Table V.4: Resources Raised by Financial |
Institutions from the Money Market |
(Amount in Rs. crore) |
Instrument |
2004-05 |
2005-06 |
2006-07 |
1 |
2 |
3 |
4 |
A. Total |
3,339 |
1,977 |
3,293 |
|
i) Term Deposit |
705 |
44 |
89 |
|
ii) Term Money |
175 |
– |
– |
|
iii) Inter-corporate Deposits |
477 |
– |
– |
|
iv) Certificate of Deposits |
233 |
2 |
663 |
|
v) Commercial Paper |
1,749 |
1,931 |
2,540 |
Memo: |
|
|
|
B. |
Umbrella limit |
13,001 |
15,157 |
19,001 |
C. |
Utilisation of Umbrella limit |
25.7 |
13.1 |
17.3 |
|
(A as percentage of B) |
|
|
|
– : Nil/Negligible.
Source : Balance sheets of respective FIs. |
Sources and Uses of Funds
5.22 Total sources/deployment of funds of FIs increased sharply by 80.0 per cent to Rs.1,80,862 crore during 2006-07. Significantly, 45.6 per cent of the funds by FIs were generated internally and 48.6 per cent from external sources while 5.8 per cent of resources were generated through other sources. A large part of the funds raised were used for fresh deployments (58.8 per cent as against 71.9 per cent last year). The repayment of past borrowing registered a sharp rise, constituting 31.2 per cent of total deployments as against 14.3 per cent in the previous year. Interest payments increased sharply during the year (Table V.5 and Appendix Table V.3).
Cost and Maturity of Borrowings
5.23 The weighted average cost of resources of IFCI and TFCI declined marginally during 2006-07, while that of EXIM Bank, SIDBI, NABARD and NHB increased (Table V.6 and Appendix Table V.4). The weighted average maturity of resources of TFCI and NHB declined, while it increased in the case of IFCI, EXIM Bank, SIDBI and NABARD.
Lending Interest Rates
5.24 While NHB maintained its Prime Lending Rate (PLR), EXIM Bank, TFCI and SIDBI raised the rate during the year (Table V.7).
Table V.5: Pattern of Sources and Deployment |
of Funds of Financial Institutions* |
(Amount in Rs. crore) |
Item |
2005-06 |
2006-07 |
Percentage |
|
Variation |
|
2005-06 |
2006-07 |
1 |
2 |
3 |
4 |
5 |
A) |
Sources of Funds |
1,00,455 |
1,80,862 |
17.9 |
80.0 |
|
(i+ii+iii) |
(100.0) |
(100.0) |
|
|
|
(i) |
Internal |
63,557 |
82,441 |
18.7 |
29.7 |
|
|
|
(63.3) |
(45.6) |
|
|
|
(ii) |
External |
33,475 |
87,844 |
15.7 |
162.4 |
|
|
|
(33.3) |
(48.6) |
|
|
|
(iii) |
Others@ |
3,424 |
10,578 |
23.7 |
208.9 |
|
|
|
(3.4) |
(5.8) |
|
|
B) |
Deployment of Funds |
1,00,455 |
1,80,862 |
17.9 |
80.0 |
|
(i+ii+iii) |
(100.0) |
(100.0) |
|
|
|
(i) |
Fresh Deployments |
72,273 |
1,06,295 |
35.6 |
47.1 |
|
|
|
(71.9) |
(58.8) |
|
|
|
(ii) |
Repayment of past |
14,402 |
56,436 |
-28.1 |
291.9 |
|
|
Borrowings |
(14.3) |
(31.2) |
|
|
|
(iii) |
Other Deployments |
13,781 |
18,132 |
15.6 |
31.6 |
|
|
|
(13.7) |
(10.0) |
|
|
|
|
of which : |
|
|
|
|
|
|
Interest Payments |
4,502 |
5,567 |
-2.1 |
23.7 |
|
|
|
(4.5) |
(3.1) |
|
|
* : IFCI, TFCI, NABARD, NHB, SIDBI and EXIM Bank.
@ : Includes cash and balances with banks (cash in hand),
balances with the Reserve Bank and other banks.
Note : Figures in brackets are percentages to total.
Source : Respective FIs. |
Financial Performance of Financial Institutions
5.25 Net interest income of select all-India FIs increased to Rs.2,598 crore during 2006-07 from Rs.2,555 crore during 2005-06. In line with the trend in the previous year, non-interest income of FIs increased significantly during the year. However, in contrast to the sharp increase in the
Table V.6: Weighted Average Cost and Maturity |
of Rupee Resources Raised by Way of Bonds/ |
Debentures by Select AIFIs |
Institution |
Weighted Average |
Weighted Average |
|
cost (per cent) |
Maturity in years |
|
2005-06 |
2006-07 |
2005-06 |
2006-07 |
1 |
2 |
3 |
4 |
5 |
IFCI |
7.8 |
7.6 |
7.2 |
8.6 |
TFCI |
10.1 |
9.9 |
5.2 |
4.3 |
EXIM Bank |
6.9 |
7.3 |
4.6 |
4.9 |
SIDBI |
5.9 |
6.5 |
3.9 |
4.5 |
NABARD |
5.8 |
8.7 |
3.5 |
5.0 |
NHB |
6.4 |
7.5 |
2.2 |
2.0 |
Source : Respective FIs. |
Table V.7: PLR Structure of Select |
Financial Institutions |
(per cent) |
Effective From |
NHB |
EXIM Bank |
TFCI |
SIDBI |
1 |
2 |
3 |
4 |
5 |
March 2006 |
10.5 |
11.5 |
10.5 |
11.5 |
March 2007 |
10.5 |
12.5 |
11.0 |
12.0 |
Source : Respective FIs. |
previous year, the operating expenses of FIs registered a decline of 55.9 per cent during the year. As a result, the operating profit increased sharply by 73.6 per cent during the year. This was also reflected in the significant increase in net profit of FIs, despite higher provisions earmarked for taxation (Table V.8).
Table V.8: Financial Performance of Select |
All-India Financial Institutions* |
(Amount in Rs. crore) |
Item |
2005-06 |
2006-07 |
Variation |
|
|
|
Amount |
Percent- age |
1 |
2 |
3 |
4 |
5 |
A) |
Income (a+b) |
9,599 |
11,478 |
1,879 |
19.6 |
|
a) Interest Income |
8,246 |
9,565 |
1,319 |
16.0 |
|
|
(85.9) |
(83.3) |
|
|
|
b) Non-Interest Income |
1,353 |
1,913 |
560 |
41.4 |
|
|
(14.1) |
(16.7) |
|
|
B) |
Expenditure (a+b) |
7,606 |
7,811 |
205 |
2.7 |
|
a) Interest Expenditure |
5,691 |
6,967 |
1,276 |
22.4 |
|
|
(74.8) |
(89.2) |
|
|
|
b) Operating Expenses |
1,915 |
844 |
-1,071 |
-55.9 |
|
|
(25.2) |
(10.8) |
|
|
|
of which: Wage Bill |
372 |
462 |
90 |
24.2 |
C) |
Provisions for Taxation |
591 |
990 |
399 |
67.5 |
D) |
Profit |
|
|
|
|
|
Operating Profit (PBT) |
1,993 |
3,460 |
1,467 |
73.6 |
|
Net Profit (PAT) |
1,402 |
2,470 |
1,068 |
76.2 |
E) |
Financial Ratios@ |
|
|
|
|
|
Operating Profit (PBT) |
1.4 |
2.1 |
|
|
|
Net Profit (PAT) |
1.0 |
1.5 |
|
|
|
Income |
6.6 |
6.9 |
|
|
|
Interest Income |
5.7 |
5.7 |
|
|
|
Other Income |
0.9 |
1.1 |
|
|
|
Expenditure |
5.2 |
4.7 |
|
|
|
Interest expenditure |
3.9 |
4.2 |
|
|
|
Other Operating Expenses |
1.3 |
0.5 |
|
|
|
Wage Bill |
0.3 |
0.3 |
|
|
|
Provisions |
0.4 |
0.6 |
|
|
|
Spread (Net Interest Income) |
1.8 |
1.6 |
|
|
* : IFCI, IIBI, TFCI, NABARD, NHB, SIDBI and EXIM Bank.
@ : As percentage of total assets.
Note : Figures in brackets are percentage shares
in the respective total.
Source : Balance sheets of respective FIs,
unaudited off-site returns for NHB and audited limited
supervisory return for TFCI Ltd. |
Table V.9: Select Financial Parameters of Financial Institutions |
(As at end-March) |
(Per cent) |
Institution |
Interest Income/ |
Non-interest |
Operating |
Return on |
Net Profit |
|
Average |
Income/Average |
Profits/Average |
Average |
per Employee |
|
Working Funds |
Working Funds |
Working Funds |
Assets |
(Rs. crore) |
|
2006 |
2007 |
2006 |
2007 |
2006 |
2007 |
2006 |
2007 |
2006 |
2007 |
1 |
2 |
3 |
4 |
5 |
6 |
7 |
8 |
9 |
10 |
11 |
IFCI |
11.3 |
8.3 |
2.3 |
8.2 |
6.7 |
10.2 |
-0.6 |
5.8 |
-0.2 |
.. |
IIBI |
11.0 |
– |
8.4 |
– |
-1.4 |
– |
.. |
– |
-0.1 |
– |
TFCI |
10.2 |
9.3 |
0.2 |
0.8 |
4.0 |
3.9 |
1.9 |
2.3 |
0.4 |
.. |
EXIM Bank |
7.6 |
8.1 |
0.6 |
0.5 |
2.1 |
1.7 |
1.5 |
1.3 |
1.4 |
1.4 |
NABARD |
6.3 |
6.8 |
-0.1 |
-0.2 |
2.1 |
1.8 |
1.8 |
1.6 |
0.2 |
0.2 |
NHB* |
6.2 |
6.8 |
0.2 |
0.1 |
1.1 |
0.9 |
0.5 |
0.5 |
1.1 |
.. |
SIDBI |
6.2 |
7.1 |
0.2 |
0.4 |
3.4 |
3.8 |
2.0 |
2.2 |
0.3 |
0.4 |
– : Nil/Negligible. .. : Not Available. * : Position as at end-June.
Source : Balance sheets of respective FIs, unaudited off-site
returns for NHB and audited limited supervisory return for TFCI Ltd. |
5.26 Although interest income of all FIs combined together as percentage of total assets remained unchanged at 5.7 per cent during 2006-07, interest income as percentage of working funds declined for IFCI and TFCI, while it increased for other FIs (Table V.9). The non-interest income to total assets ratio increased during 2006-07 to 1.1 per cent at the aggregate level from 0.9 per cent in the previous year. At individual FI level, the non-interest income as a percentage of total working funds increased significantly for IFCI, while it remained negative for NABARD during the year. Operating profit as percentage of average working funds improved for IFCI and SIDBI during 2006-07. This ratio was the highest for IFCI, followed by TFCI and SIDBI. Return on average assets of IFCI, TFCI and SIDBI improved during the year. Net profit per employee of SIDBI increased during the year. Net profit per employee in respect of EXIM Bank during 2006-07 was more than Rs.1 crore.
Soundness Indicators
Asset Quality
5.27 In absolute terms, net NPAs of EXIM Bank and NABARD increased during 2006-07, while those of SIDBI declined sharply (Table V.10). However, in terms of net NPA to net loans ratio, the asset quality of SIDBI improved sharply, while that of EXIM Bank improved marginally.
5.28 Improvement in asset quality was also observed in terms of a substantial increase in standard assets of all the major FIs, except TFCI (Table V.11). IFCI, IIBI, TFCI and SIDBI reduced their assets in the doubtful category to less than Rs.10 crore during 2006-07, while there were no doubtful assets in the case of IFCI. None of the FIs had any assets in the ‘loss’ asset category at end-March 2007.
Capital Adequacy
5.29 The capital adequacy ratio of FIs continued to be significantly higher than the minimum stipulated norm of 9 per cent (Table V.12). The CRAR of IFCI and TFCI increased significantly
Table V.10: Net Non-Performing Assets |
(As at end-March) |
(Amount in Rs. crore) |
Institution |
Net NPAs |
Net NPAs/ Net Loans
(per cent) |
|
2006 |
2007 |
2006 |
2007 |
1 |
2 |
3 |
4 |
5 |
IFCI |
667 |
– |
9.1 |
– |
IIBI |
132 |
– |
13.1 |
– |
TFCI |
15 |
– |
3.0 |
– |
EXIM Bank |
105 |
115 |
0.6 |
0.5 |
NABARD |
– |
23 |
– |
– |
NHB* |
– |
– |
– |
– |
SIDBI |
261 |
22 |
1.9 |
0.1 |
– : Nil/Negligible.
* : Position as at end-June.
Source : Balance sheets of respective FIs, unaudited off-site
returns for NHB and audited limited supervisory return for TFCI Ltd. |
Table V.11: Asset Classification of Financial Institutions |
|
(Amount in Rs. crore) |
|
At end-March |
Institution |
Standard |
Sub-Standard |
Doubtful |
Loss |
|
2006 |
2007 |
2006 |
2007 |
2006 |
2007 |
2006 |
2007 |
1 |
2 |
3 |
4 |
5 |
6 |
7 |
8 |
9 |
IFCI |
6,635 |
6,791 |
54 |
– |
613 |
– |
– |
– |
IIBI |
874 |
– |
14 |
– |
118 |
– |
– |
– |
TFCI |
546 |
399 |
– |
– |
15 |
– |
– |
– |
EXIM Bank |
17,692 |
22,772 |
105 |
108 |
– |
7 |
– |
– |
NABARD |
58,088 |
69,485 |
– |
18 |
– |
5 |
– |
– |
NHB* |
16,241 |
18,917 |
– |
– |
– |
– |
– |
– |
SIDBI |
13,001 |
15,511 |
1 |
17 |
260 |
5 |
– |
– |
– : Nil/Negligible. * : Position as at end-June.
Source : Balance sheets of FIs. |
during the year due to improved profitability of these institutions. The CRAR of NHB improved marginally, while that of EXIM Bank, NABARD and SIDBI declined during the year.
3. Non-Banking Financial Companies
5.30 Amendment to the Reserve Bank of India Act, 1934 in 1997 gave comprehensive powers to the Reserve Bank to regulate the NBFCs. The amended Act, inter alia, provided for compulsory registration of all NBFCs. NBFCs can be classified into two broad categories, viz., (i) NBFCs accepting public deposit and (ii) NBFCs not accepting/holding public deposit.
5.31 This section focuses mainly on the regulatory and supervisory initiatives of the Reserve Bank during the year. The operations of NBFCs and RNBCs are dealt with separately in view of their diverse nature. Besides, operations of NBFCs not accepting public deposits but having asset size of Rs.100 crore and above have also been analysed separately considering the systemic implications for their operations.
Regulatory and Supervisory Initiatives
5.32 The Reserve Bank has been strengthening the regulatory and supervisory framework for NBFCs since 1997 with the objective of making the NBFC sector vibrant and healthy. These efforts were pursued further during 2006-07. During the year, a major thrust was on strengthening the regulatory framework with regard to systemically
Table V.12: Capital Adequacy Ratio of Select Financial Institutions* |
(Per cent) |
Institution |
As at end-March |
|
2001 |
2002 |
2003 |
2004 |
2005 |
2006 |
2007 |
1 |
2 |
3 |
4 |
5 |
6 |
7 |
8 |
IFCI |
6.2 |
3.1 |
1.0 |
-17.0 |
-23.4 |
-27.9 |
14.0 |
IIBI |
13.9 |
9.2 |
-11.0 |
-20.1 |
-41.1 |
-64.2 |
– |
TFCI |
18.6 |
18.5 |
19.8 |
22.8 |
27.4 |
34.9 |
40.9 |
EXIM Bank |
23.8 |
33.1 |
26.9 |
23.5 |
21.6 |
18.4 |
16.4 |
NABARD |
38.5 |
36.9 |
39.1 |
39.4 |
38.8 |
34.4 |
27.0 |
NHB@ |
16.8 |
22.1 |
27.9 |
30.5 |
22.5 |
22.3 |
24.0 |
SIDBI |
28.1 |
45.0 |
44.0 |
51.6 |
50.7 |
43.2 |
37.5 |
* : Net of provisioning and write-offs.
@ : Position as at end-June.
Source : Respective balance sheets of FIs. |
important non-banking financial companies so as to reduce the regulatory gaps. Systemically important non-deposit taking NBFCs were also defined and prudential norms were specified for these entities. Some of the major regulatory and supervisory initiatives taken during the year are set out below.
Reclassification of NBFCs
5.33 Until December 6, 2006, NBFCs were classified as equipment leasing, hire-purchase, investment companies and loan companies. Pursuant to the announcement made in the Mid-Term Review of Annual Policy Statement for the year 2006-07 to re-group the companies engaged in financing real/physical assets supporting economic activity such as automobiles, general purpose industrial machinery and the like as asset financing companies, all NBFCs were advised on December 6, 2006 that the re-classification of the categories of NBFCs would be as asset finance companies (AFC), investment companies and loan companies.
5.34 AFC is defined as any company which is a financial institution carrying on as its principal business of financing the physical assets supporting productive/economic activity such as automobiles, tractors, generator sets, earth moving and material handling equipments, moving on own power and general purpose industrial machines. Principal business for this purpose is defined as aggregate of financing real/ physical assets supporting economic activity and income arising therefrom not less than 60 per cent of the total assets and total income, respectively. Since the classification for the purpose of income recognition, asset classification and provisioning norms is based on asset specification, the extant prudential norms will continue as hitherto. The companies satisfying the above conditions have been advised to approach the Regional Office of the Reserve Bank in the jurisdiction in which their Registered Office is located, along with the original certificate of registration (CoR) issued by the Reserve Bank to recognise their classification as asset finance companies. Their request must be supported by their Statutory Auditor’s certificate indicating the asset/income pattern of the company as on March 31, 2006. The change in classification would be incorporated in the certificate of registration issued by the Reserve Bank as NBFC-Asset Finance Company (NBFC D-AFC), if accepting deposits and NBFC-ND-AFC, if not accepting deposits.
Financial Regulation of Systemically Important NBFCs and Banks’ Relationship with Them
5.35 The application of different levels of regulations to the activities of banks and NBFCs, and even among different categories of NBFCs, had given rise to some issues relating to uneven coverage of regulations. The Reserve Bank had, therefore, set up an Internal Group to examine the issues relating to level playing field, regulatory convergence and regulatory arbitrage in the financial sector. Based on the recommendations of the Internal Group and taking into consideration the feedback received thereon, a revised framework to address the issues pertaining to the overall regulation of systemically important NBFCs (NBFCs-ND-SI) and the relationship between banks and NBFCs was put in place on December 12, 2006.
5.36 All NBFCs–ND with an asset size of Rs.100 crore and more as per the last audited balance sheet are now considered as systemically important NBFCs–ND (NBFC-ND-SI). NBFCs–ND–SI are required to maintain a minimum CRAR of 10 per cent. No NBFC–ND–SI is allowed to (i) lend to any single borrower/group of borrowers exceeding 15 per cent / 25 per cent of its owned fund; (ii) invest in the shares of another company/ single group of companies exceeding 15 per cent / 25 per cent of its owned fund; and (iii) lend and invest (loans/investments taken together) exceeding 25 per cent of its owned fund to a single party and 40 per cent of its owned fund to a single group of parties.
5.37 If the additional exposure is on account of infrastructure loan and/or investment, then the NBFCs are allowed to exceed the prescribed limit of credit/investment for single party or a single group of parties, i.e., 5 per cent for any single party and 10 per cent for a single group of parties. In addition to the single party and a single group of parties exposure norms prescribed for NBFCs-D and NBFCs-ND-SI, AFCs are permitted to exceed the exposure to a single party and a single group of parties up to a further 5 percentage points of their owned fund in exceptional circumstances with the approval of their boards. NBFCs-ND-SI not accessing public funds both directly and indirectly may apply to the Reserve Bank for an appropriate dispensation, consistent with the spirit of the exposure limits. Taking into account the likelihood that some of the NBFCs may not be in compliance with some of the elements of the revised regulatory framework, it was decided to provide for a transition period up to end-March 2007. Accordingly, NBFCs were required to comply with all elements of the revised framework with effect from April 1, 2007.
5.38 The residuary non-banking companies (RNBCs) and primary dealers (PDs) are subject to a separate set of regulations. The Reserve Bank had constituted an Internal Group to review the existing guidelines applicable to these entities in the light of the revised guidelines and examine the need for prescribing supplementary guidelines which will be issued separately. Till such time, these entities will continue to be governed by the existing regulations.
5.39 Government owned NBFCs are exempted from certain provisions of Non-Banking Financial Companies Prudential Norms (Reserve Bank) Directions, 1998, at present. There is, however, a proposal to bring all deposit-taking and systemically important Government owned companies under the provisions of the Directions, 1998. However, the date from which they are to fully comply with the regulatory framework will be decided later. These companies were, therefore, required to prepare a roadmap for compliance with the various elements of the NBFC regulations, in consultation with the Government, and submit it to the Reserve Bank by March 31, 2007.
5.40 With a view to ensuring adherence to compliance with the regulatory framework for systemically important non-deposit taking/holding NBFCs (NBFC-ND-SI) as on December 12, 2006, such companies were advised on April 27, 2007 to put in place a system for submission of an annual statement of capital funds and risk asset ratio, among others, as at end of March every year. The first such return was required to be submitted for the year ended March 31, 2007. The return may be submitted within a period of three months from the close of the financial year, every year.
Exposure Norms and Risk Weights
5.41 The Reserve Bank amended the Non-Banking Financial Companies Prudential Norms (Reserve Bank) Directions, 1998. Under the amended directions, NBFCs were advised on September 20, 2006 that while calculating the aggregate of funded exposure of a borrower for the purpose of assignment of risk weight, they may ‘net-off’ against the total outstanding exposure to the borrower advances collateralised by cash margins/security deposits/caution money against which the right to set off is available.
Securitisation Companies and Reconstruction Companies
5.42 On March 29, 2004, the Reserve Bank increased, the minimum owned fund requirement for commencing the business of securitisation or asset reconstruction to an amount not less than 15 per cent of the total financial assets acquired or to be acquired by the securitisation company or reconstruction company on an aggregate basis or Rs.100 crore, whichever is lower, irrespective of whether the assets are transferred to a trust set up for the purpose of securitisation or not. The securitisation companies/reconstruction companies were directed that they may invest the amount of owned fund in the security receipts issued by the trust set up for the purpose of securitisation. It was, however, decided on September 20, 2006 that Securitisation Companies or Reconstruction Companies shall invest in Security Receipts an amount not less than 5 per cent issued under each scheme with immediate effect. In the case of Securitisation Companies or Reconstruction Companies which have already issued the Security Receipts, such companies should achieve the minimum subscription limit in Security Receipts under each scheme, within a period of six months from the date of notification.
5.43 The Reserve Bank on October 19, 2006 directed that a securitisation company or reconstruction company, which has obtained a certificate of registration (CoR) from the Reserve Bank under Section 3 of the Securitisation and Reconstruction of Financial Assets and Enforcement of Security Interest (SARFAESI) Act, 2002 should commence business within six months from the date of grant of CoR. The Reserve Bank may, on an application made by the securitisation company or reconstruction company, grant extension of time for commencement of business beyond six months, on merits, but in no case, such extension of time shall exceed 12 months from the date of grant of certificate of registration. Those securitisation companies or reconstruction companies, which had already obtained a CoR from the Reserve Bank under Section 3 of the Act and did not commence business, were required to commence business within a period of six months from the date of the notification of the Directions.
Continuation of Business of NBFI -Submission of Statutory Auditors Certificate
5.44 It was observed that there were NBFCs which were not engaged in the business of non-banking financial institution (NBFI) but still held the CoR, even though they were not required/eligible to hold the CoR granted by the Reserve Bank. In order to ensure that only NBFCs which are actually engaged in the business of NBFI hold CoR, NBFCs were advised on September 21, 2006 that they should submit a certificate from their statutory auditors every year to the effect that they continue to undertake the business of NBFI requiring the holding of CoR under Section 45-IA of the RBI Act, 1934. The certificate from the statutory auditors in this regard is required to be submitted to the Regional Office of the Reserve Bank under whose jurisdiction the NBFC is registered, latest by June 30, every year with reference to the position of the company as on March 31 of that year.
Definition of Principal Business
5.45 The term ‘principal business’ in the case of NBFIs has not been defined in law. However, the Reserve Bank decided to describe principal business for the purpose of identification of an NBFC. It was clarified on October 19, 2006 that the business of non-banking financial institution means a company engaged in the business of financial institution as contained in Section 45 I(a) of the RBI Act, 1934. For this purpose, the definition of ‘principal business’ given, vide Press Release of April 8, 1999 is to be followed, which states that a company will be treated as a non-banking financial company if its financial assets are more than 50 per cent of its total assets (netted off by intangible assets) and income from financial assets is more than 50 per cent of the gross income. Both these tests are required to be satisfied as the determinant factors for principal business of a company. In the case of an existing company, which has been granted the CoR by the Reserve Bank to carry on NBFI, it is possible that its business profile has undergone a change over a period of time. In the case of new companies, since these companies cannot commence business of NBFI without obtaining CoR, the Reserve Bank grants CoR on the basis of their intention to engage in the business of NBFI. However, such an intention may not materialise. Hence, it is possible, that there are companies holding the CoR to commence/carry on the business of NBFI without actually undertaking NBFI activity. It was for this reason that the submission of auditor’s certificate in support of commencement/continuance of the business of NBFI and fulfilling the criteria of the principal business was prescribed.
Guidelines on Fair Practices Code
5.46 NBFCs were advised on September 28, 2006 to prescribe the broad guidelines on fair practices that are to be framed and approved by the boards of directors of all non-banking financial companies (including RNBCs). The fair practices code so framed and approved by the board of directors is to be published and disseminated on the website of the company, if any, for the information of the public. The salient features of the guidelines are: (i) loan application forms should include necessary information which affects the interest of the borrower, so that a meaningful comparison with the terms and conditions offered by other NBFCs can be made and informed decision can be taken by the borrower; (ii) NBFCs should devise a system of giving acknowledgment for receipt of all loan applications and preferably the timeframe, within which loan applications will be disposed off, should also be indicated; (iii) NBFCs should convey in writing to the borrower by means of sanction letter or otherwise, the amount of loan sanctioned, along with the terms and conditions including annualised rate of interest and method of application thereof and keep the acceptance of these terms and conditions by the borrower on its record; (iv) NBFCs should give notice to the borrower of any change in the terms and conditions including disbursement schedule, interest rates, service charges and prepayment charges, among others; (v) decision to recall/ accelerate payment or performance under the agreement should be in consonance with the loan agreement; (vi) NBFCs should release all securities on repayment of all dues or on realisation of the outstanding amount of loan subject to any legitimate right or lien for any other claim NBFCs may have against borrower; (vii) NBFCs should refrain from interference in the affairs of the borrower except for the purposes provided in the terms and conditions of the loan agreement; (viii) in case of receipt of request from the borrower for transfer of borrowal account, the consent or otherwise, i.e., objection of the NBFC, if any, should be conveyed within 21 days from the date of receipt of request; (ix) in the matter of recovery of loans, NBFCs should not resort to undue harassment; and (x) the boards of directors of NBFCs should also put in place the appropriate grievance redressal mechanism within the organisation to resolve disputes in this regard.
Prior Public Notice about Change in Control/ Management
5.47 NBFCs, including RNBCs, were advised from time to time that whenever there was change of management and control of NBFCs, prior public notice should be given 30 days before effecting the sale, or transfer of the ownership by sale of shares, or transfer of control, or by way of amalgamation/merger of an NBFC with another NBFC or a non-financial company by the NBFC and also by the transferor, or the transferee. The matter was reviewed and NBFCs, including RNBCs, were advised on October 27, 2006 that such prior public notice shall be given by the NBFC and also by the transferor or the transferee or jointly by the parties concerned.
Distribution of Mutual Fund Products by NBFCs/ Issue of Co-branded Credit Cards
5.48 With a view to strengthening the NBFCs through diversification and pursuant to the announcement made in the Mid-Term Review of Annual Policy Statement for the year 2006-07 on October 31, 2006, it was decided on December 4, 2006 to allow NBFCs, selectively, to market and distribute mutual fund products as agents of mutual funds, with prior approval of the Reserve Bank, for an initial period of two years. It was also decided on December 4, 2006 to allow NBFCs, selectively, registered with the Reserve Bank to issue co-branded credit cards with scheduled commercial banks, without risk sharing, with prior approval of the Bank, for an initial period of two years. NBFCs fulfilling the following minimum requirements are eligible to apply: (i) minimum net owned fund of Rs.100 crore; (ii) the company should have made net profit as per the last two years audited balance sheets; (iii) the percentage of net NPAs to net advances of the NBFC as per the last audited balance sheet should not be more than 3 per cent; and (iv) the non-deposit-taking NBFCs (NBFCs-ND) should have CRAR of 10 per cent and deposit-taking NBFCs (NBFCs-D) should have CRAR of 12 per cent or 15 per cent, as applicable to the company. In addition, for distributing mutual fund products, the NBFC (i) should comply with the SEBI guidelines/regulations; (ii) should not adopt any restrictive practice of forcing its customers to go in for a particular mutual fund product sponsored by it; (iii) and the customers should be allowed to exercise their own choice. In the case of co-branded credit card business, the role of the NBFC under the tie-up arrangement should be limited only to marketing and distribution of the co-branded credit cards and the co-branded credit card issuing bank would be subject to all the instructions/guidelines issued by its concerned regulatory authority. The guidelines would be reviewed after two years.
Cover for Public Deposits – Creation of Floating Charge on Liquid Assets
5.49 All NBFCs accepting/holding public deposits were advised in February 2005 to create floating charge on the statutory liquid assets invested in terms of Section 45-IB of the RBI Act, 1934, in favour of their depositors. In view of the practical difficulties expressed by the NBFCs in creating charge on the statutory liquid assets in favour of a large number of depositors, it was decided in January 2007 that NBFCs accepting/ holding public deposits may create the floating charge on the statutory liquid assets, in favour of their depositors, through the mechanism of ‘Trust Deed’. The charge is required to be registered with the Registrar of Companies and the information in this regard is required to be furnished to the trustees and the Reserve Bank. A copy each of the ‘Draft Trust Deed’ containing the details and the ‘Trustee Guidelines’ was sent for the guidance of the NBFCs. They were further advised to put a system in place latest by March 31, 2007.
Submission of Returns by Mutual Benefit Financial Companies (MBFCs) and Mutual Benefit Companies (MBCs)
5.50 The Ministry of Company Affairs took over the entire regulation of Mutual Benefit Financial Companies (Notified Nidhis) and Mutual Benefit Companies (Potential Nidhis). Accordingly, the position regarding submission of annual returns by MBFCs and MBCs was reviewed by the Reserve Bank and it was decided on January 4, 2007 not to call for annual return, audited balance sheet and profit and loss account, auditor’s certificate and other particulars as contained in the Non-Banking Financial Companies Acceptance of Public Deposits (Reserve Bank) Directions, 1998 from MBFCs and MBCs. However, if the application of MBCs (Potential Nidhis) for grant of nidhi status is rejected by the Ministry of Company Affairs, the provisions of the Directions, 1998 as applicable to NBFCs would apply to such companies.
Prudential Norms
5.51 In terms of the provisions of the prescribed regulatory framework for systemically important non-deposit taking NBFCs, as on December 12, 2006, the Non-Banking Financial Companies Prudential Norms (Reserve Bank) Directions, 1998 were required to be amended. It was, however, felt that a separate set of prudential norms directions in supersession of the extant Non-Banking Financial Companies Prudential Norms (Reserve Bank) Directions, 1998 may be issued for deposit taking NBFCs (including RNBCs) and non-deposit taking NBFCs for operational convenience. Accordingly, two sets of prudential norms directions, viz., Non-Banking Financial (Deposit Accepting or Holding) Companies Prudential Norms (Reserve Bank) Directions, 2007 for deposit taking NBFCs (including RNBCs) and Non-Banking Financial (Non- Deposit Accepting or Holding) Companies Prudential Norms (Reserve Bank) Directions, 2007 for non-deposit taking NBFCs were issued in February 2007.
5.52 Further, all deposit taking NBFCs and RNBCs with total assets of Rs.100 crore and above were advised to submit the return on capital market exposure on a monthly basis within seven days of the close of the month. The first such return based on revised criteria was required to be submitted for the month ended April 30, 2007. NBFCs with deposits of Rs 50 crore and above were advised to continue to submit return on capital market exposure as hitherto being submitted by them till the month ended March 31, 2007, after which they are required to follow the revised instructions.
Misuse of Bank Finance for Hoarding
5.53 Concerns were expressed that some of the corporates/entities were hoarding foodgrains possibly using the resources borrowed from the NBFCs. Accordingly, NBFCs-ND-SI (all non-deposit taking NBFCs with asset size of Rs.100 crore and above) were advised on February 23, 2007 to undertake a scrutiny of their financial exposures to large borrowers for procurement of foodgrains and also consider quick scrutiny of the accounts on whom they have large exposure to confirm to themselves that funds were not diverted for procurement of foodgrains with a view to hoarding.
Advertisement in Electronic Media
5.54 NBFCs were advised in May 2005 to explicitly include in their advertisements soliciting deposits issued in print or electronic media (including websites) a statement to the effect that ‘the Reserve Bank does not accept any responsibility or guarantee about the present position as to the financial soundness of the company or for the correctness of any of the statements or representations made or opinions expressed by the company and for repayment of deposits/discharge of the liabilities by the company’. It is possible that the advertisement released by NBFCs accepting deposits purely for promoting its business may attract deposits. In the interest of depositors in the context of such advertisements and draw attention of the depositors to the above provision, a suitable provision was incorporated in the Non-Banking Financial Companies Acceptance of Public Deposits (Reserve Bank) Directions, 1998 on April 4, 2007 advising NBFCs that where any advertisement is displayed in electronic media such as TV, even without soliciting deposits, it should incorporate a caption/band in such advertisements indicating the following: (i) ‘As regards deposit taking activity of the company, the investors may refer to the advertisement in the newspaper/information furnished in the application form for soliciting public deposits’; (ii) ‘The company is having a valid Certificate of Registration issued by the Reserve Bank of India under section 45-IA of the Reserve Bank of India Act, 1934. However, the Reserve Bank does not accept any responsibility or guarantee about the present position as to the financial soundness of the company or for the correctness of any of the statements or representations made or opinions expressed by the company and for repayment of deposits/discharge of the liabilities by the company’.
Ceiling on Rate of Interest
5.55 In the Annual Policy Statement for the year 2007-08, released in April 2007, an announcement was made regarding increase in the ceiling on the rate of interest payable by NBFCs (other than RNBCs) on deposits by 150 basis points to 12.5 per cent per annum. Accordingly, the maximum interest rate payable on public deposits by NBFCs was revised to 12.5 per cent per annum from April 24, 2007. This is the maximum permissible rate an NBFC can pay on its public deposits; NBFCs are free to offer lower rates. The new rate of interest will be applicable to fresh public deposits and renewals of matured public deposits. The ceiling rate of interest of 12.5 per cent per annum is also applicable to the deposits accepted/renewed by Miscellaneous Non-Banking Companies (Chit Fund Companies).
Guidelines on Corporate Governance
5.56 Corporate governance is the key to protecting the interests of the stakeholders in the corporate sector. NBFCs are no exception as they too are corporate entities. In order to enable NBFCs to adopt best practices and ensure greater transparency in their operations, guidelines were proposed on May 8, 2007 for consideration of the boards of directors of all deposit taking NBFCs with deposit size of Rs.20 crore and above, and all non-deposit taking NBFCs with asset size of Rs.100 crore and above (NBFCs-ND-SI). The guidelines relate to constitution of audit, nomination and risk management committees, disclosure and transparency and connected lending relationship.
5.57 An NBFC having assets of Rs.50 crore and above as per its last audited balance sheet is already required to constitute an audit committee, consisting of not less than three members of its board of directors. An NBFC-D with deposit size of Rs.20 crore may also consider constituting an audit committee on similar lines. With respect to the constitution of nomination committee, the guidelines require that it is necessary to ensure that the general character of the management or the proposed management of the NBFC is not prejudicial to the interest of its present and future depositors. In view of the interest evinced by various entities in this segment, it is desirable that NBFC-D with deposit size of Rs.20 crore and above and NBFC-ND-SI form a nomination committee to ensure ‘fit and proper’ status of proposed/existing directors. For risk management committee, the guidelines require that in order to manage risk on an integrated basis, a risk management committee be constituted. The market risk for NBFCs with public deposit of Rs.20 crore and above or having an asset size of Rs.100 crore or above as on the date of last audited balance sheet is addressed by the Asset Liability Management Committee (ALCO) constituted to monitor the asset liability gap and strategise action to mitigate the risk associated. The guidelines also require that the following information should be put up by NBFCs to the boards of directors at regular intervals as may be prescribed by it in this regard: (i) progress made in putting in place a progressive risk management system, and risk management policy and strategy followed; and (ii) conformity with corporate governance standards, viz., in composition of various committees, their role and functions, periodicity of the meetings and compliance with coverage and review functions.
5.58 Alongwith the above, instructions on connected lending relationship were also released which relate to credit facilities to the directors, loans and advances to relatives of the NBFC’s directors or to the directors of other companies and their relatives and other entities and timeframe for recovery of such loans, among others.
Complaints About Excessive Interest Charged by NBFCs
5.59 In view of several complaints regarding levying of excessive interest and charges on certain loans and advances by NBFCs, they were advised on May 24, 2007 to lay down appropriate internal principles and procedures in determining interest rates and processing and other charges, even though interest rates are not regulated by the Reserve Bank. NBFCs were advised to keep in view the guidelines on Fair Practice Code about transparency in respect of terms and conditions of loans.
Profile of NBFCs (Including RNBCs)
5.60 Total number of NBFCs registered with the Reserve Bank, consisting of NBFCs-D (Deposit taking NBFCs), RNBCs, mutual benefit companies (MBCs), miscellaneous non-banking companies (MNBCs) and Nidhi companies, declined from 13,014 at end-June 2006 to 12,968 at end-June 2007 (Table V.13). The number of NBFCs-D
Table V.13: Number of NBFCs Registered |
|
with the Reserve Bank |
|
End-June |
NBFCs |
NBFCs-D |
1 |
2 |
3 |
2000 |
8,451 |
679 |
2001 |
13,815 |
776 |
2002 |
14,077 |
784 |
2003 |
13,849 |
710 |
2004 |
13,764 |
604 |
2005 |
13,261 |
507 |
2006 |
13,014 |
428 |
2007 |
12,968 |
401 |
declined from 428 as at end-June 2006 to 401 as at end-June 2007. The decline was mainly due to the exit of many NBFCs from deposit taking activity. The number of RNBCs remained unchanged at three as at end-March 2007.
5.61 Of the 401 deposit taking NBFCs, 362 NBFCs filed annual return for the year ended March 2007 by the cut-off date of September 30, 2007. Despite a significant decline in the number of reporting NBFCs from the previous year, assets, public deposits and net owned funds increased by Rs.11,452 crore, Rs.2,042 crore and Rs.924 crore, respectively, during 2006-07 (Table V.14). Public deposits held by RNBCs constituted 91.7 per cent of total deposits of all NBFCs at end-
Table V.14: Profile of NBFCs* |
(Amount in Rs. crore) |
Item |
As at end-March |
|
2006 |
2007 P |
|
NBFCs |
of which: RNBCs |
NBFCs |
of which: RNBCs |
1 |
2 |
3 |
4 |
5 |
Number of Reporting |
|
|
|
|
Companies |
435 |
3 |
362 @ |
3 |
Total Assets |
59,719 |
21,891 |
71,171 |
23,172 |
Public Deposits |
22,623 |
20,175 |
24,665 |
22,622 |
Net Owned Funds |
7,677 |
1,183 |
8,601 |
1,366 |
P : Provisional
* : NBFCs comprise NBFCs-D and RNBCs.
@: Out of 403, 362 NBFCs filed annual returns.
Note : Figures in brackets are percentages to respective total of NBFCs. |
March 2007, slightly higher than 89.2 per cent in the previous year. However, the share of RNBCs in total assets of NBFCs declined to 32.6 per cent at end-March 2007 from 36.7 per cent at end-March 2006.
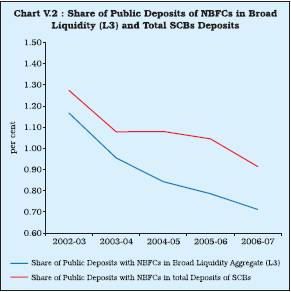
5.62 Despite the increase in public deposits held by NBFCs at end-March 2007, the ratio of deposits of reporting NBFCs to the aggregate deposits of scheduled commercial banks dropped to 0.95 per cent at end-March 2007 from 1.1 per cent at end-March 2006. The share of NBFC deposits in broad liquidity aggregate (L3) also declined during the period (Chart V.2).
Operations of NBFCs-D (excluding RNBCs)
5.63 Total assets/liabilities of NBFCs (excluding RNBCs) expanded at a much higher rate of 26.9 per cent during 2006-07 compared with 5.1 per cent during 2005-06 (Table V.15). Borrowings, which is the major source of funds for these NBFCs, increased by 30.6 per cent during the year, while public deposits declined by 16.5 per cent indicating a shift in the pattern of resources raised. On the assets side, hire purchase assets increased sharply, while loans and advances, equipment leasing assets and bills purchased/discounted declined during 2006-07. Total investments of NBFCs increased sharply entirely on account of non-approved investments, while approved investments declined during the year.
Table V.15: Consolidated Balance Sheet of NBFCs-D |
(Amount in Rs. crore) |
Item |
As at End-March |
Variation |
|
|
|
2005-06 |
|
2006-07 |
|
|
2006 |
2007 P |
Absolute |
Per cent |
Absolute |
Per cent |
1 |
2 |
3 |
4 |
5 |
6 |
7 |
Liabilities |
|
|
|
|
|
|
1. |
Paid-up Capital |
1,827 |
2,289 |
-379 |
-17.2 |
462 |
25.3 |
|
|
(4.8) |
(4.8) |
|
|
|
|
2. |
Reserves and Surplus |
5,625 |
5,969 |
1,081 |
23.8 |
344 |
6.1 |
|
|
(14.9) |
(12.4) |
|
|
|
|
3. |
Public Deposits |
2,447 |
2,042 |
-1,478 |
37.7 |
-405 |
-16.5 |
|
|
(6.5) |
(4.3) |
|
|
|
|
4. |
Borrowings |
24,942 |
32,563 |
1,897 |
8.2 |
7,621 |
30.6 |
|
|
(65.9) |
(67.8) |
|
|
|
|
5. |
Other Liabilities |
2,987 |
5,136 |
704 |
30.8 |
2,149 |
72.0 |
|
|
(7.9) |
(10.7) |
|
|
|
|
Total Liabilities / Assets |
37,828 |
47,999 |
1,824 |
5.1 |
10,171 |
26.9 |
1. |
Investments |
4,326 |
7,508 |
369 |
9.3 |
3,182 |
73.5 |
|
|
(11.4) |
(15.6) |
|
|
|
|
|
i) |
Approved Securities @ |
292 |
241 |
-1,945 |
-87.0 |
-51 |
-17.3 |
|
ii) |
Other Investments |
4,034 |
7,267 |
2,314 |
134.6 |
3,232 |
80.1 |
2. |
Loans and Advances |
10,686 |
10,602 |
-2,063 |
-16.2 |
-84 |
-0.8 |
|
|
(28.2) |
(22.1) |
|
|
|
|
3. |
Hire Purchase Assets |
20,008 |
26,048 |
5,608 |
38.9 |
6,040 |
30.2 |
|
|
(52.9) |
(54.3) |
|
|
|
|
4. |
Equipment Leasing Assets |
1,502 |
1,334 |
-523 |
-25.8 |
-168 |
-11.2 |
|
|
(4.0) |
(2.8) |
|
|
|
|
5. |
Bill Business |
44 |
6 |
-427 |
-90.6 |
-38 |
-85.7 |
|
|
(0.1) |
(0.0) |
|
|
|
|
6. |
Other Assets |
1,261 |
2,500 |
-1,140 |
-47.5 |
1,239 |
98.3 |
|
|
(3.3) |
(5.2) |
|
|
|
|
P : Provisional.
@ : SLR assets comprise ‘approved securities’ and ‘unencumbered
term deposits’ in scheduled commercial banks.
Note : Figures in brackets are percentages to total liabilities/assets.
Source : Annual Returns. |
5.64 Among NBFC groups, asset finance companies (AFCs) held the largest share in total assets/liabilities (51.5 per cent), followed by hire purchase finance companies (35.7 per cent), loan companies (8.7 per cent) and investment companies (3.4 per cent) (Table V.16). The share of equipment leasing companies declined to below 1 per cent subsequent upon the reclassification of NBFCs. The relative significance of various NBFC groups reflected largely the pattern of their borrowings as deposits constituted a small share (4.3 per cent) of their total liabilities. Of the total deposits held by all NBFCs, hire purchase finance companies held the largest share in total deposits of NBFCs (81.0 per cent), followed distantly by AFCs with a 9.1 per cent share.
Deposits
Profile of Public Deposits of Different Categories of NBFCs-D
5.65 Continuing the trend of the previous year, public deposits held by all groups of NBFCs declined during 2006-07 (Table V.17). Deposits of equipment leasing companies and investment companies declined by 73.5 per cent and 44.1 per cent, respectively. The decline was, however, of a relatively low order in the case of deposits of hire purchase companies (18.7 per cent).
Size-wise Classification of NBFCs Deposits
5.66 Deposits held by NBFCs range from less than Rs.0.5 crore to above Rs.50 crore
Table V.16: Major Components of Liabilities of NBFCs-D–Group Wise |
(Amount in Rs. crore) |
NBFC Group |
Liabilities |
Deposits |
|
Borrowings |
|
2005-06 |
2006-07 P |
2005-06 2006-07 P |
2005-06 |
2006-07 P |
1 |
2 |
3 |
4 |
5 |
6 |
7 |
Asset Finance @ |
– |
24,718 |
– |
186 |
– |
19,091 |
|
|
(51.5) |
|
(9.1) |
|
(58.6) |
Equipment Leasing |
3,497 |
325 |
164 |
43 |
2,309 |
128 |
|
(9.2) |
(0.7) |
(6.7) |
(2.1) |
(9.3) |
(0.4) |
Hire Purchase |
28,845 |
17,156 |
2,035 |
1,654 |
19,493 |
10,478 |
|
(76.3) |
(35.7) |
(83.2) |
(81.0) |
(78.2) |
(32.2) |
Investment |
1,610 |
1,633 |
81 |
45 |
697 |
133 |
|
(4.3) |
(3.4) |
(3.3) |
(2.2) |
(2.8) |
(0.4) |
Loan |
3,876 |
4,167 |
167 |
114 |
2,442 |
2,733 |
|
(10.2) |
(8.7) |
(6.8) |
(5.6) |
(9.8) |
(8.4) |
Total |
37,828 |
47,999 |
2,447 |
2,042 |
24,942 |
32,563 |
P : Provisional
– : Not applicable.
@ : New classification of NBFCs, viz. asset finance company
(AFC) became effective since December 2006.
Companies financing real/physical assets for productive/economic
activities are re-classified as AFCs.
Note : Figures in brackets are percentages to respective totals.
Source : Annual Returns. |
(Table V.18). The number of NBFCs and deposits held by NBFCs in all deposit sizes declined during 2006-07, except for the deposit-class ‘more than Rs.20 crore and up to Rs.50 crore’. Though the number of NBFCs with deposits size of ‘Rs.20 crore and above’ declined to 11 in 2006-07 from
13 in 2005-06, their share in total deposits held by all NBFCs increased to 82.5 per cent from 78.3 per cent. The remaining 348 companies with deposit size of less than Rs.20 crore held about 18 per cent of total public deposits of the NBFC sector.
Table V.17: Public Deposits held by NBFCs-D – Group-wise |
(Amount in Rs. crore) |
NBFC Group |
As at end-March |
Percentage
Variation |
|
Number of NBFCs |
Public Deposits |
|
|
2006 |
2007 |
2006 |
2007 P |
2006-07 |
1 |
2 |
3 |
4 |
5 |
6 |
Asset Finance @ |
– |
72 |
– |
186 |
– |
|
|
|
|
(9.1) |
|
Equipment Leasing |
37 |
28 |
164 |
43 |
-73.5 |
|
|
|
(6.7) |
(2.1) |
|
Hire Purchase |
339 |
231 |
2,035 |
1,654 |
-18.7 |
|
|
|
(83.2) |
(81.0) |
|
Investment |
5 |
3 |
81 |
45 |
-44.1 |
|
|
|
(3.3) |
(2.2) |
|
Loan |
51 |
25 |
167 |
114 |
-32.0 |
|
|
|
(6.8) |
(5.6) |
|
Total |
432 |
359 |
2,447 |
2,042 |
-16.5 |
P : Provisional.
– : Not applicable.
@ : New classification of NBFCs viz. asset finance company
(AFC) became effective since December 2006.
Companies financing real/physical assets for productive/economic
activities are re-classified as AFCs.
Note : Figures in brackets are percentages in respective totals.
Source : Annual Returns. |
Table V.18: Range of Deposits held by NBFCs-D |
(Amount in Rs. crore) |
Deposit Range |
As at end-March |
|
No. of NBFCs |
|
Amount of Deposit |
|
2006 |
2007 |
2006 |
2007 P |
1 |
2 |
3 |
4 |
5 |
1. |
Less than Rs. 0.5 crore |
255 |
218 |
39 |
30 |
|
|
|
|
(1.6) |
(1.5) |
2. |
More than Rs. 0.5 crore and up to Rs. 2 crore |
107 |
89 |
100 |
83 |
|
|
|
|
(4.1) |
(4.1) |
3. |
More than Rs.2 crore and up to Rs.10 crore |
42 |
34 |
182 |
152 |
|
|
|
|
(7.4) |
(7.4) |
4. |
More than Rs.10 crore and up to Rs.20 crore |
15 |
7 |
211 |
93 |
|
|
|
|
(8.6) |
(4.6) |
5. |
More than Rs.20 crore and up to Rs.50 crore |
3 |
4 |
102 |
151 |
|
|
|
|
(4.2) |
(7.4) |
6. |
Rs.50 crore and above |
10 |
7 |
1,813 |
1,533 |
|
|
|
|
(74.1) |
(75.1) |
Total (1 to 6) |
432 |
359 |
2,447 |
2,042 |
P : Provisional.
Note : Figures in brackets represent percentages in the respective totals.
Source : Annual Returns. |
Region-Wise Composition of Deposits Held by NBFCs
5.67 Following the trend of the previous year, deposits held by NBFCs across all the regions declined during 2006-07 (Table V.19). As in the previous year, the Southern region accounted for the largest share of deposits (79.3 per cent), followed by the Northern region and the Western region. The presence of NBFCs in the NorthEastern region reduced to nil during the year. Among the metropolitan cities, Chennai emerged at the top in terms of amount of deposits held, while Delhi ranked first in terms of number of NBFCs.
Interest Rate on Public Deposits with NBFCs
5.68 The share of deposits contracted by NBFCs in the interest rates up to 10 per cent increased (89.5 per cent from 83.6 per cent), while those contracted in other interest rate ranges declined during the year (Table V.20).
Maturity Pattern of Public Deposits
5.69 Deposits with the maturity period of up to 2 years and between 3-5 years declined during the year. Deposits in the maturity bucket of ‘more than 2 and up to 3 years’ increased marginally, while deposits in the maturity bucket of ‘5 years and above’ increased significantly at end-March
Table V.19: Public Deposits held by |
NBFCs-D – Region-wise |
(Amount in Rs. crore) |
|
As at end-March |
Region |
2006 |
2007 P |
|
Number |
Amount |
Number |
Amount |
1 |
2 |
3 |
4 |
5 |
1. |
Central |
63 |
34 |
59 |
27 |
|
|
|
(1.4) |
|
(1.3) |
2. |
Eastern |
12 |
59 |
8 |
21 |
|
|
|
(2.4) |
|
(1.0) |
3. |
North-Eastern |
1 |
0 |
0 |
0 |
|
|
|
(0.0) |
|
(0.0) |
4. |
Northern |
215 |
333 |
191 |
288 |
|
|
|
(13.6) |
|
(14.1) |
5. |
Southern |
114 |
1,917 |
78 |
1,620 |
|
|
|
(78.3) |
|
(79.3) |
6. |
Western |
27 |
104 |
23 |
86 |
|
|
|
(4.2) |
|
(4.2) |
Total (1 to 6) |
432 |
2,447 |
359 |
2,042 |
Memo: |
Metropolitan cities: |
1. |
Mumbai |
13 |
94 |
10 |
78 |
2. |
Chennai |
69 |
1,740 |
41 |
1,516 |
3. |
Kolkata |
9 |
46 |
6 |
21 |
4. |
New Delhi |
73 |
240 |
69 |
219 |
Total (1 to 4) |
164 |
2,120 |
126 |
1,834 |
P : Provisional.
Note : Figures in brackets are percentages in the respective totals.
Source: Annual Returns. |
Table V.20: Distribution of Public Deposits of |
NBFCs-D According to Rate of Interest |
(Amount in Rs. crore) |
Interest Range |
As at end-March |
|
2006 |
2007 P |
1 |
2 |
3 |
Up to 10 per cent |
2,047 |
1,828 |
|
(83.6) |
(89.5) |
More than 10 per cent and up to 12 per cent |
318 |
195 |
|
(13.0) |
(9.6) |
12 per cent and above |
82 |
19 |
|
(3.4) |
(0.9) |
Total |
2,447 |
2,042 |
P : Provisional.
Note : Figures in brackets are percentages to the respective totals.
Source: Annual Returns. |
2007. As a result, their share in total deposits increased (Table V.21).
5.70 The spread between the maximum interest rate on public sector bank deposits of ‘one to three year’ maturity and the interest rate offered by NBFCs on deposits with the same maturity narrowed to 1.50 percentage points at end-March 2007 from 4.25 percentage points at end-March 2006 (Table V.22). Subsequently, however, the ceiling interest rate for NBFCs was revised upwards to 12.50 per cent with effect from April 24, 2007 as a result of which the spread has widened to 3.00 percentage points.
Table V.21: Maturity Pattern of Public Deposits |
held by NBFCs-D |
(Amount in Rs. crore) |
Maturity Period@ |
As at end-March |
|
2006 |
2007 P |
1 |
2 |
3 |
1. |
Less than 1 year |
878 |
695 |
|
|
(35.9) |
(34.1) |
2. |
More than 1 and up to 2 years |
648 |
473 |
|
|
(26.5) |
(23.2) |
3. More than 2 and up to 3 years |
559 |
560 |
|
|
(22.8) |
(27.4) |
4. More than 3 and up to 5 years |
360 |
234 |
|
|
(14.7) |
(11.4) |
5. 5 years and above |
3 |
80 |
|
|
(0.1) |
(3.9) |
Total |
|
2,447 |
2,042 |
@ : Based on the of residual maturity of outstanding deposits.
P : Provisional.
Note : Figures in brackets are percentages to the respective totals.
Source: Annual Returns. |
Table V.22: Spread in Deposit Interest Rates of |
Banks and NBFCs |
(Per cent) |
Interest Rate |
As at end-March |
|
2002 |
2003 |
2004 |
2005 |
2006 |
2007 |
1 |
2 |
3 |
4 |
5 |
6 |
7 |
1. |
Maximum interest |
|
|
|
|
|
|
|
rate on public sector |
|
|
|
|
|
|
|
bank deposits of |
|
|
|
|
|
|
|
1-3 year maturity |
8.50 |
6.75 |
6.75 |
6.50 |
6.75 |
9.50 |
2. |
Ceiling interest rate |
|
|
|
|
|
|
|
for NBFCs |
12.50 |
11.00 |
11.00 |
11.00 |
11.00 |
11.00 |
3. |
Spread (2-1) |
4.00 |
4.25 |
4.25 |
4.50 |
4.25 |
1.50 |
Borrowings by NBFCs-D
5.71 The outstanding borrowings by NBFCs increased by 30.6 per cent during 2006-07 (Table V.23). Borrowings by equipment leasing and hire purchase companies and investment companies declined, partly reflecting the reclassification of NBFCs, while those by loan companies increased during the year. AFCs held the largest share of borrowings of all NBFCs, followed by hire purchase companies.
5.72 Borrowings by NBFCs from external sources, and from banks and financial institutions increased sharply by 95.9 per cent and 52.6 per cent, respectively, during 2006-07 (Table V.24). Borrowings from other sources grew
Table V.23: Borrowings by NBFCs-D – Group-wise |
(Amount in Rs. crore) |
NBFC Group |
As at end-March |
Percentage
Variation |
|
No. of NBFCs |
Total Borrowings |
|
|
2006 |
2007 P |
2006 |
2007 P |
2006-07 |
1 |
2 |
3 |
4 |
5 |
6 |
Asset Finance @ |
– |
72 |
– |
19,091 |
– |
|
|
|
|
(58.6) |
|
Equipment Leasing |
37 |
28 |
2,309 |
128 |
-94.4 |
|
|
|
(9.3) |
(0.4) |
|
Hire Purchase |
339 |
231 |
19,493 |
10,478 |
-46.2 |
|
|
|
(78.2) |
(32.2) |
|
Investment Companies |
5 |
3 |
697 |
133 |
-80.9 |
|
|
|
(2.8) |
(0.4) |
|
Loan Companies |
51 |
25 |
2,442 |
2,732 |
11.9 |
|
|
|
(9.8) |
(8.4) |
|
Total |
432 |
359 |
24,942 |
32,563 |
30.6 |
P : Provisional. – : Not applicable.
@ : New classification of NBFCs, viz ., asset finance company
(AFC) became effective since December 2006. Companies financing
real/physical assets for productive/economic activities are re- classified as AFCs.
Note : Figures in brackets are percentages to total borrowings.
Source : Annual Returns. |
Table V.24: Sources of Borrowings by NBFCs-D – Group-wise |
(Amount in Rs. crore) |
NBFC Group |
As at end-March |
|
Government |
External
Sources @ |
Banks and Financial Institutions |
Debentures |
Others |
Total |
|
2006 |
2007 P |
2006 |
2007 P |
2006 |
2007 P |
2006 |
2007 P |
2006 |
2007 P |
2006 |
2007 P |
1 |
2 |
3 |
4 |
5 |
6 |
7 |
8 |
9 |
10 |
11 |
12 |
13 |
Asset Finance # |
.. |
.. |
.. |
975 |
.. |
9,148 |
.. |
5,808 |
.. |
3,159 |
.. |
19,091 |
Equipment Leasing |
– |
– |
284 |
– |
1,404 |
39 |
338 |
– |
283 |
89 |
2,309 |
128 |
|
|
|
|
|
|
(-97.2) |
|
|
|
(-68.6) |
|
(-94.4) |
Hire Purchase |
– |
– |
329 |
225 |
7,113 |
4,203 |
7,165 |
1,847 |
4,886 |
4,203 |
19,493 |
10,478 |
|
|
|
|
(-31.4) |
|
(-40.9) |
|
(-74.2) |
|
(-14.0) |
|
(-46.2) |
Investment |
533 |
– |
– |
– |
– |
– |
9 |
7 |
155 |
126 |
697 |
133 |
|
|
|
|
|
|
(84.0) |
|
(-22.1) |
|
(-18.7) |
|
(-80.2) |
Loan |
110 |
25 |
– |
– |
1,263 |
1,531 |
930 |
1,115 |
141 |
61 |
2,442 |
2,732 |
|
|
(-77.0) |
|
– |
|
(21.3) |
|
(20.0) |
|
(-56.9) |
|
(-11.9) |
Total |
643 |
25 |
613 |
1,201 |
9,779 |
14,923 |
8,442 |
8,777 |
5,465 |
7,637 |
24,942 |
32,563 |
|
|
(-96.1) |
|
(95.9) |
|
(52.6) |
|
(4.0) |
|
(39.8) |
|
(30.6) |
P : Provisional. .. : Not applicable. – : Nil/negligible.
@ : Comprises of (i) Foreign Government, (ii) Foreign Authority,
and (iii) Foreign Citizen or Person.
# : New classification of NBFCs, viz., asset finance company
(AFC) became effective since December 2006. Companies
financing real/physical assets for productive/economic
activities are reclassified as AFCs.
Note : Figures in brackets are percentage variations over the previous year.
Source : Annual Returns. |
by 39.8 per cent during the year. However, borrowings from the Government declined sharply during 2006-07. Borrowings from the Government relate to one State-owned NBFC operating in the southern region.
Assets of NBFCs-D
5.73 The decline in the assets of equipment leasing and hire purchase companies reflects the reclassification of the NBFCs. Loans and advances as well as investments increased during the year. The sharp decline in total advances and investments of equipment leasing companies and hire purchase companies reflected the reclassification of NBFCs (Table V.25). At end-March 2007, 55 per cent of total loans and advances and 32.1 per cent of investments by all NBFCs were held by asset finance companies.
Table V.25: Major Components of Assets of NBFCs-D – Group-wise |
(Amount in Rs. crore) |
NBFC Group |
As at end-March |
|
Assets |
Advances |
Investment |
|
2006 |
2007 P |
2006 |
2007 P |
2006 |
2007 P |
1 |
2 |
3 |
4 |
5 |
6 |
7 |
Asset Finance @ |
– |
24,718 |
– |
20,882 |
– |
2,413 |
|
|
(51.5) |
|
(55.0) |
|
(32.1) |
Equipment Leasing |
3,497 |
325 |
3,150 |
252 |
366 |
56 |
|
(9.2) |
(0.7) |
(9.8) |
(0.7) |
(8.5) |
(0.7) |
Hire Purchase |
28,845 |
17,156 |
25,479 |
14,572 |
2,068 |
1,722 |
|
(76.3) |
(35.7) |
(79.0) |
(38.4) |
(47.8) |
(22.9) |
Investment |
1,610 |
1,633 |
620 |
498 |
968 |
1,110 |
|
(4.3) |
(3.4) |
(1.9) |
(1.3) |
(22.4) |
(14.8) |
Loan |
3,876 |
4,167 |
2,992 |
1,787 |
924 |
2,207 |
|
(10.2) |
(8.7) |
(9.3) |
(4.7) |
(21.4) |
(29.4) |
Total |
37,828 |
47,999 |
32,241 |
37,991 |
4,326 |
7,508 |
P : Provisional. – : Not applicable.
@ : New classification of NBFCs, viz., asset finance
company (AFC) became effective since December 2006.
Companies financing real/physical assets for
productive/economic activities are re-classified as AFCs.
Note : Figures in brackets are percentages to respective totals.
Source : Annual Returns. |
Table V.26: NBFCs-D According to Asset Size |
(Amount in Rs. crore) |
Asset size |
As at end-March |
|
No. of reporting companies |
Assets |
|
|
2006 |
2007 P |
2006 |
2007 P |
1 |
2 |
3 |
4 |
5 |
1. |
Less than Rs. 0.25 crore |
10 |
8 |
1 |
1 |
2. |
More than Rs. 0.25 crore
and up to Rs. 0.50 crore |
35 |
28 |
1 3 |
11 |
|
|
|
(0.0) |
(0.0) |
|
3. |
More than Rs. 0.50 crore
and up to Rs. 2 crore |
187 |
155 |
215 |
176 |
|
|
|
|
(0.6) |
(0.4) |
4. |
More than Rs. 2 crore
and up to Rs. 10 crore |
119 |
97 |
551 |
418 |
|
|
|
|
(1.5) |
(0.9) |
5. |
More than Rs. 10 crore
and up to Rs. 50 crore |
48 |
43 |
1,127 |
1,024 |
|
|
|
|
(3.0) |
(2.1) |
6. |
More than Rs. 50 crore
and up to Rs. 100 crore |
7 |
5 |
473 |
339 |
|
|
|
|
(1.3) |
(0.7) |
7. |
More than Rs. 100 crore
and up to Rs. 500 crore |
12 |
8 |
2,362 |
1,598 |
|
|
|
|
(6.2) |
(3.3) |
8. |
Above Rs. 500 crore |
14 |
15 |
33,085 |
44,433 |
|
|
|
|
(87.5) |
(92.6) |
|
Total (1 to 8) |
432 |
359 |
37,828 |
47,999 |
P: Provisional.
Note : Figures in brackets are percentages in respective totals.
Source : Annual Returns. |
Distribution of NBFCs-D According to Asset Size
5.74 The asset size of NBFCs varies significantly from less than Rs.25 lakh to more than Rs.500 crore. The decline in the number of reporting companies (from 432 at end-March 2006 to 359 at end-March 2007) was on account of a decline in the number of companies in all asset ranges, except the marginal rise in the ‘above Rs.500 crore’ category. The asset holding pattern remained skewed. Fifteen NBFCs with asset size of ‘above Rs.500 crore’ held 92.6 per cent of total assets of all NBFCs, while the remaining 344 NBFCs held 7.4 per cent of total assets at end-March 2007 (Table V.26).
Distribution of Assets of NBFCs – D Type of Activity
5.75 While assets held in the form of investments and equipment leasing and other assets witnessed a sharp turnaround during 2006-07, assets in the form of hire purchase witnessed a slower growth. Assets in the form of loans and bills continued to decline during the year. Assets held in the hire-purchase activity accounted for the largest share (54.3 per cent), followed by loans and inter-corporate deposits (22.1 per cent), investments
(15.6 per cent) and equipment leasing (1.5 per cent) (Table V.27).
Table V.27: Distribution of Assets of |
NBFCs-D- Activity-wise |
(Amount in Rs. crore) |
Activity |
As at |
Percentage |
|
|
end-March |
Variation |
|
|
2006 |
2007 P |
2005-06 |
2006-07 P |
1 |
|
2 |
3 |
4 |
5 |
1. |
Loans and Inter- |
10,686 |
10,602 |
-27.8 |
-0.8 |
|
corporate deposits |
(28.2) |
(22.1) |
|
|
2. |
Investments |
4,326 |
7,508 |
-9.3 |
73.5 |
|
|
(11.4) |
(15.6) |
|
|
3. |
Hire Purchase |
20,008 |
26,048 |
38.1 |
30.2 |
|
|
(52.9) |
(54.3) |
|
|
4. |
Equipment and |
617 |
726 |
-21.3 |
17.7 |
|
Leasing |
(1.6) |
(1.5) |
|
|
5. |
Bills |
44 |
6 |
-90.5 |
-85.7 |
|
|
(0.1) |
(0.0) |
|
|
6. |
Other assets |
2,146 |
3,108 |
-39.1 |
44.8 |
|
|
(5.7) |
(6.5) |
|
|
|
Total (1 to 6) |
37,828 |
47,999 |
-1.2 |
26.9 |
P : Provisional.
Note : Figures in brackets are percentages in respective totals.
Source : Annual Returns. |
Financial Performance of NBFCs-D
5.76 Financial performance of NBFCs turned around during 2006-07. This was entirely on account of sharp rise in fund based income (26.6 per cent), which offset the sharp increase in operating expenditure (33.1 per cent) and financial expenditure (30.0 per cent). As a result, the operating profits increased by 12.7 per cent and the net profits by 1.8 per cent. The cost to income ratio increased moderately (to 83.5 per cent in 2006-07 from 81.6 per cent in 2005-06) (Table V.28).
5.77 While income as percentage of assets declined marginally, expenditure (including provisions) as percentage of assets increased marginally, resulting in a decline in the net profits to asset ratio (Chart V.3).
Table V.28: Financial Performance of NBFCs-D |
(Amount in Rs. crore) |
Indicator |
As at end-March |
Percentage Variation |
|
2006 |
2007 P |
2005-06 |
2006-07 |
1 |
2 |
3 |
4 |
5 |
A. |
Income (i+ii) |
4,599 |
5,770 |
-0.1 |
25.4 |
|
(i) |
Fund Based |
4,453 |
5,635 |
5.3 |
26.6 |
|
|
|
(96.8) |
(97.7) |
|
|
|
(ii) |
Fee-Based |
147 |
134 |
-61.2 |
-8.3 |
|
|
|
(3.2) |
(2.3) |
|
|
B. |
Expenditure (i+ii+iii) |
3,753 |
4,816 |
13.0 |
28.3 |
|
(i) |
Financial |
2,144 |
2,787 |
0.3 |
30.0 |
|
|
|
(57.1) |
(57.9) |
|
|
|
|
of which: |
|
|
|
|
|
|
Interest Payment |
541 |
540 |
– |
-0.2 |
|
(ii) |
Operating |
945 |
1,257 |
31.6 |
33.1 |
|
|
|
(25.2) |
(26.1) |
|
|
|
(iii) Others |
664 |
772 |
|
16.2 |
|
|
|
(17.7) |
(16.0) |
|
|
C. |
Tax Provisions |
291 |
388 |
-17.6 |
33.3 |
D. |
Operating Profit (PBT) |
847 |
954 |
-52.1 |
12.7 |
E. |
Net Profit (PAT) |
556 |
566 |
-73.4 |
1.8 |
F. |
Total Assets |
37,828 |
47,999 |
-1.2 |
26.9 |
G. |
Financial Ratios * |
|
|
|
|
|
i) |
Income |
12.2 |
12.0 |
|
|
|
ii) |
Fund Income |
11.8 |
11.7 |
|
|
|
iii) |
Fee Income |
0.4 |
0.3 |
|
|
|
iv) |
Expenditure |
9.9 |
10.0 |
|
|
|
v) |
Financial Expenditure |
5.7 |
5.8 |
|
|
|
vi) |
Operating Expenditure |
2.5 |
2.6 |
|
|
|
vii) |
Tax Provision |
0.8 |
0.8 |
|
|
|
viii) Net Profit |
1.5 |
1.2 |
|
|
H. Cost to Income Ratio |
81.6 |
83.5 |
|
|
* : As percentage to total assets.
P : Provisional.
Note : Figures in brackets are percentages in respective totals.
Source : Annual Returns. |
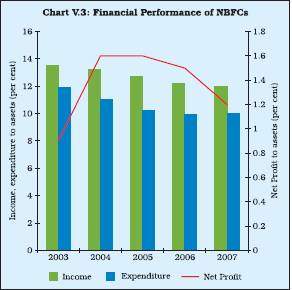
Soundness Indicators
Asset Quality of NBFCs-D
5.78 In continuation of the trend witnessed during the last few years, gross NPAs (as percentage of gross advances) as well as net NPAs (as percentage of net advances) of reporting NBFCs declined further during the year ended March 2007 (Table V.29).
5.79 Gross NPAs (as percentage of gross advances) of equipment leasing and investment companies increased during 2006-07, while those of loan companies and hire purchase companies declined. Net NPAs (as percentage of net advances) also showed a decline in the case of equipment leasing and loan companies (Table V.30).
Table V.29: Non-performing Assets of NBFCs-D |
|
|
(Per cent) |
|
|
|
End-March |
Gross NPAs to |
Net NPAs to |
|
Gross Advances |
Net Advances |
|
|
|
1 |
2 |
3 |
|
|
|
2001 |
11.5 |
5.6 |
2002 |
10.6 |
3.9 |
2003 |
8.8 |
2.7 |
2004 |
8.2 |
2.4 |
2005 |
5.7 |
2.5 |
2006 |
3.6 |
0.5 |
2007 P |
1.9 |
0.4 |
P : Provisional. |
|
|
Source : Half - Yearly |
Returns. |
|
Table V.30: NPAs of NBFCs-D – Group-wise |
(Amount in Rs. crore) |
NBFC
Group
End-March |
Gross Advances |
Gross NPAs |
Net Advances |
Net NPAs |
|
|
Amount |
Per cent to
Gross
Advances |
Per cent to Assets |
|
Amount |
Per cent
to Net
Advances |
Per cent
to Assets |
1 |
2 |
3 |
4 |
5 |
6 |
7 |
8 |
9 |
Asset
Finance @ |
|
|
|
|
|
|
|
|
2007 P |
11,799 |
258 |
2.2 |
2.1 |
11,525 |
-15 |
-0.1 |
-0.1 |
Equipment Leasing |
|
|
|
|
|
|
|
|
2005 |
4,187 |
514 |
12.3 |
11.0 |
4,018 |
345 |
8.6 |
7.4 |
2006 |
2,878 |
69 |
2.4 |
2.2 |
2,786 |
-23 |
-0.8 |
-0.7 |
2007 P |
1,035 |
41 |
4.0 |
3.7 |
973 |
-21 |
-2.1 |
-1.9 |
Hire Purchase |
|
|
|
|
|
|
|
|
2005 |
15,900 |
610 |
3.8 |
3.6 |
15,544 |
253 |
1.6 |
1.5 |
2006 |
17,607 |
444 |
2.5 |
2.4 |
17,238 |
74 |
0.4 |
0.4 |
2007 P |
18,079 |
321 |
1.8 |
1.6 |
17,842 |
83 |
0.5 |
0.4 |
Investment |
|
|
|
|
|
|
|
|
2005 |
58 |
10 |
18.0 |
1.8 |
58 |
10 |
18.0 |
1.8 |
2006 |
59 |
0 |
0.4 |
0.0 |
59 |
0 |
0.4 |
0.0 |
2007 P |
31 |
1 |
2.8 |
0.1 |
31 |
1 |
2.8 |
0.1 |
Loan |
|
|
|
|
|
|
|
|
2005 |
1,955 |
117 |
6.0 |
5.1 |
1,772 |
-65 |
-3.7 |
-2.8 |
2006 |
690 |
252 |
36.5 |
19.3 |
483 |
45 |
9.3 |
3.4 |
2007 P |
7,551 |
94 |
1.2 |
4.6 |
7,548 |
91 |
1.2 |
4.4 |
P : Provisional
@ : New classification of NBFCs, viz., asset finance company
(AFC) became effective since December 2006.
Companies financing real/ physical assets for
productive/economic activities are re-classified as AFCs.
Source : Half-yearly returns of reporting NBFCs. |
5.80 Asset quality of various types of NBFCs as reflected in the various categories of NPAs (substandard, doubtful and loss) remained broadly at the previous year’s level, barring NPAs of loan companies which declined significantly in all categories (Table V.31).
Capital Adequacy Ratio
5.81 The capital to risk-weighted assets ratio (CRAR) norms were made applicable to NBFCs in 1998, in terms of which every deposit-taking NBFC is required to maintain a minimum capital, consisting of Tier-I and Tier-II capital, of not less than 12 per cent (15 per cent in the case of unrated deposit-taking loan/investment companies) of its aggregate risk-weighted assets and of risk-adjusted value of off-balance sheet items. Total of Tier-II capital, at any point of time, cannot exceed 100 per cent of Tier-I capital. The number of NBFCs with less than the minimum regulatory CRAR of 12 per cent declined to 13 at end-March 2007 from 37 at end-March 2006 (Table V.32). At end-March 2007, 319 out of 332 NBFCs had CRAR of 12 per cent or more as against 364 out of 401 NBFCs at end-March 2006. Number of NBFCs with CRAR more than 30 also declined to 275 at end-March 2007 from 304 at end-March 2006.
5.82 Net owned fund (NOF) of NBFCs is the aggregate of paid-up capital and free reserves, netted by (i) the amount of accumulated losses; and (ii) deferred revenue expenditure; and (iii) other intangible assets, if any, and adjusted by investments in shares, and loans and advances to (a) subsidiaries, (b) companies in the same group, and (c) other NBFCs (in excess of 10 per cent of owned fund). Information about NOF can complement the information on CRAR. The ratio of public deposits to NOF in the case of equipment leasing companies declined substantially during the year ended March 2007, while that of other category companies remained more or less at the
Table V.31: Classification of Assets of NBFCs-D – Group-wise |
(Amount in Rs. crore) |
NBFC Group/ |
Standard |
Sub-Standard |
Doubtful |
Loss |
Gross |
Gross |
End-March |
Assets |
Assets |
Assets |
Assets |
NPAs |
Advances |
|
Amount |
per cent to gross advances |
Amount |
per cent
to gross advances |
Amount |
per cent to gross advances |
Amount |
per cent to gross advances |
Amount |
per cent to gross advances |
|
1 |
2 |
3 |
4 |
5 |
6 |
7 |
8 |
9 |
10 |
11 |
12 |
Asset Finance @ |
|
|
|
|
|
|
|
|
|
|
|
2007 P |
11,540 |
97.8 |
241 |
2.0 |
15 |
0.1 |
2 |
0.0 |
258 |
2.2 |
11,799 |
Equipment Leasing |
|
|
|
|
|
|
|
|
|
|
|
2005 |
3,673 |
87.7 |
383 |
9.1 |
91 |
2.2 |
39 |
0.9 |
514 |
12.3 |
4,187 |
2006 |
2,809 |
97.6 |
12 |
0.4 |
21 |
0.7 |
36 |
1.2 |
69 |
2.4 |
2.878 |
2007 P |
994 |
96.0 |
4 |
0.4 |
2 |
0.2 |
35 |
3.4 |
41 |
4.0 |
1.035 |
Hire Purchase |
|
|
|
|
|
|
|
|
|
|
|
2005 |
15,290 |
96.2 |
386 |
2.4 |
130 |
0.8 |
94 |
0.6 |
610 |
3.8 |
15,900 |
2006 |
28,170 |
97.5 |
184 |
0.6 |
47 |
0.3 |
212 |
0.8 |
444 |
1.6 |
17.607 |
2007 P |
17,759 |
98.4 |
185 |
1.0 |
51 |
0.3 |
85 |
0.5 |
321 |
1.8 |
18.079 |
Investment |
|
|
|
|
|
|
|
|
|
|
|
2005 |
48 |
82.8 |
1 |
1.7 |
10 |
17.2 |
0 |
0.0 |
10 |
17.2 |
58 |
2006 |
59 |
99.6 |
0 |
0.0 |
0 |
0.2 |
0 |
0.2 |
0 |
0.4 |
59 |
2007 P |
31 |
97.2 |
1 |
2.8 |
0 |
0.0 |
0 |
0.0 |
1 |
2.8 |
31 |
Loan |
|
|
|
|
|
|
|
|
|
|
|
2005 |
1,837 |
94.0 |
14 |
0.7 |
42 |
2.1 |
61 |
3.1 |
117 |
6.0 |
1,955 |
2006 |
438 |
63.5 |
19 |
2.7 |
99 |
14.3 |
134 |
19.4 |
252 |
36.5 |
690 |
2007 P |
6,913 |
98.7 |
9 |
0.1 |
78 |
1.1 |
8 |
0.1 |
94 |
1.3 |
7.551 |
P : Provisional
@ : New classification of NBFCs, viz., asset finance company (AFC)
became effective in December 2006.
Companies financing real/physical assets for
productive/economic activities are re-classified as AFCs.
Source : Half-yearly returns of reporting NBFCs. |
previous year’s level. The ratio turned negative in respect of equipment leasing companies because of negative net owned funds. The ratio of public deposit to NOF for all NBFCs was 0.3 per cent at end-March 2007 as compared with 0.4 per cent at end-March 2006 (Table V.33).
Table V.32: Capital Adequacy Ratio of NBFCs-D |
(Per cent) |
CRAR Range |
As at end-March |
|
2006 |
2007 P |
|
EL |
HP |
LC/IC |
Total |
AFC |
EL |
HP |
LC/IC |
Total |
1 |
2 |
3 |
4 |
5 |
6 |
7 |
8 |
9 |
10 |
1) |
Less than 12 per cent (a+b) |
8 |
23 |
6 |
37 |
0 |
3 |
10 |
0 |
13 |
|
a) |
Less than 9 per cent |
8 |
23 |
6 |
37 |
0 |
3 |
10 |
0 |
13 |
|
b) |
More than 9 and up to 12 per cent |
0 |
0 |
0 |
0 |
0 |
0 |
0 |
0 |
0 |
2) |
More than 12 and up to 15 per cent |
0 |
3 |
0 |
3 |
2 |
0 |
2 |
0 |
4 |
3) |
More than 15 and up to 20 per cent |
0 |
11 |
0 |
11 |
2 |
1 |
7 |
1 |
11 |
4) |
More than 20 and up to 30 per cent |
5 |
36 |
5 |
46 |
1 |
2 |
21 |
5 |
29 |
5) |
Above 30 per cent |
24 |
257 |
23 |
304 |
36 |
19 |
200 |
20 |
275 |
Total |
37 |
330 |
34 |
401 |
41 |
25 |
240 |
26 |
332 |
P : Provisional.
Note : AFC: Asset Finance Company;
EL - Equipment Leasing; HP: Hire Purchase; LC/IC – Loan
Companies/Investment Companies.
Source : Half-Yearly Returns. |
Table V.33: Net Owned Fund vis-à-vis
Public Deposits of NBFCs-D – Group-wise |
(Amount in Rs. crore) |
NBFC Group |
Net Owned Funds |
Public Deposits |
Ratio of Public Deposits to
Net Owned Funds |
|
2005-06 |
2006-07 P |
2005-06 |
2006-07 P |
2005-06 |
2006-07 P |
1 |
2 |
3 |
4 |
5 |
6 |
7 |
1. |
Asset Finance @ |
– |
2,673 |
– |
186 |
– |
0.1 |
2. |
Equipment Leasing |
542 |
-15 |
164 |
43 |
0.3 |
-2.9 |
3. |
Hire Purchase |
4,106 |
3,159 |
2,035 |
1,654 |
0.5 |
0.5 |
4. |
Investment |
766 |
822 |
81 |
45 |
0.1 |
0.1 |
5. |
Loan |
1,080 |
596 |
167 |
114 |
0.2 |
0.2 |
Total (1 to 5) |
6,494 |
7,235 |
2,447 |
2,042 |
0.4 |
0.3 |
P : Provisional – : Not applicable.
@ : New classification of NBFCs, viz., asset finance c
ompany (AFC) became effective in December 2006.
Companies financing real/physical assetsfor productive/economic
activities are re-classified as AFCs. Source : Annual Returns. |
5.83 Net owned funds of NBFCs range from less than Rs.25 lakh to above Rs.500 crore. Public deposits, as multiple of NOF, held by NBFCs in the category of NOF of ‘more than Rs.50 crore and up to Rs.100 crore’ increased, while those by NBFCs in all other ranges of NOF generally declined (Table V.34).
Residuary Non-Banking Companies (RNBCs)
5.84 Assets of three RNBCs increased by 5.9 per cent during the year ended March 2007. Their assets in the form of unencumbered approved securities as well as bonds/debentures increased sharply, while those in investments in fixed deposits/certificate of
Table V.34: Range of Net Owned Fund
vis-à-vis Public Deposits of NBFCs-D |
(Amount in Rs. crore) |
Ranges of Net Owned Fund |
As at end-March |
|
2006 |
2007 P |
|
No. of |
Net Owned |
Public |
No. of |
Net Owned |
Public |
|
Companies |
Funds |
Deposits |
Companies |
Funds |
Deposits |
1 |
2 |
3 |
4 |
5 |
6 |
7 |
1. |
Up to Rs. 0.25 crore |
26 |
-387 |
113 |
17 |
-279 |
146 |
|
|
|
|
-(0.3) |
|
|
-(0.5) |
2. |
More than Rs. 0.25 crore and up to Rs. 2 crore |
295 |
208 |
140 |
243 |
171 |
96 |
|
|
|
|
(0.7) |
|
|
(0.6) |
3. |
More than Rs. 2 crore and up to Rs. 10 crore |
73 |
316 |
180 |
62 |
284 |
129 |
|
|
|
|
(0.6) |
|
|
(0.5) |
4. |
More than Rs. 10 crore and up to Rs. 50 crore |
21 |
486 |
417 |
21 |
473 |
268 |
|
|
|
|
(0.9) |
|
|
(0.6) |
5. |
More than Rs. 50 crore and up to Rs. 100 crore |
3 |
224 |
5 |
2 |
125 |
45 |
|
|
|
|
(0.0) |
|
|
(0.4) |
6. |
More than Rs. 100 crore and up to Rs. 500 crore |
9 |
2,095 |
877 |
8 |
1,729 |
686 |
|
|
|
|
(0.4) |
|
|
(0.4) |
7. |
Above Rs. 500 crore |
5 |
3,552 |
716 |
6 |
4,733 |
671 |
|
|
|
|
(0.2) |
|
|
(0.1) |
Total |
432 |
6,494 |
2447 |
359 |
7,235 |
2,042 |
|
|
|
(0.4) |
|
|
(0.3) |
P : Provisional
Note : Figures in brackets are public deposit as
multiple of respective net owned fund.
Source : Annual Returns. |
Table V.35: Profile of Residuary Non-Banking Companies |
(Amount in Rs. crore) |
Item |
As at end-March |
Per cent Variation |
|
2006 |
2007 P |
2005-06 |
2006-07 |
1 |
2 |
3 |
4 |
5 |
A. Assets (i to v) |
21,891 |
23,172 |
14.9 |
5.9 |
(i) |
Investment in Unencumbered Approved Securities |
2,346 |
3,317 |
15.2 |
41.4 |
(ii) |
Investment in Fixed deposits/Certificate of Deposits of |
|
|
|
|
|
Scheduled Commercial Banks/Public Financial Institutions |
6,090 |
5,604 |
24.9 |
-8.0 |
(iii) |
Debentures/Bonds/Commercial Papers of Govt. Companies/ |
|
|
|
|
|
Public Sector Banks/Public Financial Institution/Corporations |
9,577 |
11,700 |
3.8 |
22.2 |
(iv) |
Other investments |
1,658 |
1,156 |
1.2 |
-30.3 |
(v) |
Other Assets |
2,220 |
1,395 |
72.7 |
-37.2 |
B. Net Owned Funds |
1,183 |
1,366 |
11.1 |
15.5 |
C. Total Income (i+ii) |
1,620 |
1,893 |
5.7 |
16.9 |
(i) |
Fund Income |
1,616 |
1,886 |
5.6 |
16.7 |
(ii) |
Fee Income |
3 |
8 |
50.0 |
166.7 |
D. Total Expenses (i+ii+iii) |
1,439 |
1,648 |
3.1 |
14.5 |
(i) |
Financial Cost |
1,165 |
1,230 |
-0.9 |
5.5 |
(ii) |
Operating Cost |
159 |
284 |
8.9 |
78.6 |
(iii) |
Other cost |
114 |
134 |
55.4 |
17.5 |
E. Provision for Taxation |
22 |
44 |
-54.2 |
100.0 |
F. Operating Profit (PBT) |
180 |
246 |
32.4 |
36.7 |
G. Net profit (PAT) |
158 |
201 |
79.5 |
27.1 |
P : Provisional.
Note : PBT - Profit Before Tax; PAT - Profit After Tax.
Source : Annual Returns. |
deposits of SCBs and other instruments registered a decline. Net owned funds of RNBCs increased by 15.5 per cent during 2006-07 (Table V.35).
5.85 The increase in income of RNBCs during 2006-07 was more than the increase in expenditure, as a result of which the operating profit of RNBCs increased. The provision for taxation also registered a sharp rise. As a result, net profit of RNBCs increased by only 27.1 per cent during 2006-07 as compared with 79.5 per cent during 2005-06.
Regional Pattern of Deposits of RNBCs
5.86 Of the three RNBCs, two are based in the Eastern region (Kolkata) and one in the Central region. While public deposits held by RNBCs in the Eastern region registered a marginal decline, those held in the Central region increased moderately. Of the four metropolitan cities, RNBCs held public deposits only in one metropolitan city, i.e., Kolkata (Table V.36).
Investment Pattern of RNBCs
5.87 The investment pattern of RNBCs as prescribed in the Residuary Non-Banking (Reserve Bank) Directions, 1987 was reviewed and modified on March 31, 2006. The aggregate liability to depositor (ALD) was bifurcated under two heads, viz., aggregate liability to depositor (ALD) as on December 31, 2005 and incremental ALDs. Incremental ALDs are the liabilities to the depositors exceeding the aggregate amount of the liabilities to the depositors as on December 31, 2005. RNBCs were advised to invest, with effect from April 1, 2006, not less than 95 per cent of the ALD as on December 31, 2005 and the entire incremental ALD in the prescribed manner. RNBCs were also advised that on and from April
1, 2007, the entire amount of ALD would be invested in directed investments only and no discretionary investment would be allowed to be made by them.
5.88 ALDs increased by 12.1 per cent during 2006-07. The pattern of deployment of ALDs remained broadly unchanged during the year (Table V.37).
Table V.36: Public Deposits held by RNBCs |
Region-wise |
(Amount in Rs. crore) |
Region |
As at end-March |
|
2006 |
2007 P |
|
No. of RNBCs |
Amount |
No. of RNBCs |
Amount |
1 |
2 |
3 |
4 |
5 |
1. |
Northern |
– |
– |
– |
– |
2. |
North-Eastern |
– |
– |
– |
– |
3. |
Eastern |
2 |
4,614 |
2 |
4,514 |
|
|
|
(23) |
|
(20) |
4. |
Central |
1 |
15,561 |
1 |
18,108 |
|
|
|
(77) |
|
(80) |
5. |
Western |
– |
– |
– |
– |
6. |
Southern |
– |
– |
– |
– |
|
|
|
|
|
|
Total (1 to 6) |
3 |
20,175 |
3 |
22,622 |
Memo: |
|
|
|
|
Metropolitan Cities: |
|
|
|
|
1. |
Mumbai |
– |
– |
– |
– |
2. |
Chennai |
– |
– |
– |
– |
3. |
Kolkata |
2 |
4,614 |
2 |
4,514 |
4. |
New Delhi |
– |
– |
– |
– |
|
|
|
|
|
|
Total (1 to 4) |
2 |
4,614 |
2 |
4,514 |
– : Nil/Negligible.
P: Provisional.
Note : Figures in brackets are percentages to respective totals.
Source : Annual Returns. |
Non-Deposit Taking Systemically Important Non-Banking Finance Companies (NBFC- ND -SI)
5.89 Information based on the returns received from 173 non-deposit taking systemically important NBFCs (with asset size of Rs.100 crore and above) for the year ended March 2007 showed an increase of 26.8 per cent in their liabilities/ assets over the year ended March 2006. Unsecured loans constituted the single largest source of funds for large sized NBFCs, followed by secured loans and reserves and surplus. This trend continued during the quarter ended June 2007 (Table V.38).
Borrowings
5.90 Total borrowings (secured and unsecured) by NBFCs-ND-SI increased by 21.4 per cent to Rs.2,11,986 crore during the year ended March 2007, constituting 66.7 per cent of their total liabilities. During the quarter ended June 2007, the liabilities increased further by 6.4 per cent (Table V.39).
Application of Funds
5.91 The pattern of application of funds by NBFCs-ND-SI during the year ended March 2007 showed significant variations over the previous year. While unsecured loans had constituted the single largest item on the asset side during 2005-06 (38.4 per cent), secured loans constituted the largest item on the asset side (41.5 per cent), followed by unsecured loans and long-term investments during 2006-07. This trend continued during the quarter ended June 2007 (Table V.40).
Financial Performance
5.92 NBFCs-ND-SI earned a profit of Rs.7,460 crore during the year ended March 2007, which was
Table V.37: Investment Pattern of Residuary Non-Banking Companies |
(Amount in Rs. crore) |
Item |
End-March |
Per cent to ALDs |
|
2006 |
2007 P |
2006 |
2007 P |
1 |
2 |
3 |
4 |
5 |
A. |
Aggregated Liabilities to the Depositors (ALD) |
20,175 |
22,622 |
100.0 |
100.0 |
B. |
Investments (i to iv) |
19,671 |
21,777 |
97.5 |
96.3 |
|
(i) |
Unencumbered approved securities |
2,346 |
3,317 |
11.6 |
14.7 |
|
(ii) |
Fixed Deposits with banks |
6,090 |
5,604 |
30.2 |
24.8 |
|
(iii) |
Bonds or debentures or commercial paper of a Govt. company/ |
|
|
|
|
|
|
public sector bank/public financial institution/corporation |
9,577 |
11,700 |
47.5 |
51.7 |
|
(iv) |
Other investments |
1,658 |
1,156 |
8.2 |
5.1 |
P: Provisional
Source : Annual Returns. |
Table V.38: Liabilities of NBFCs-ND-SI |
(Amount in Rs. crore) |
Item |
As at end |
|
March 2006 |
March 2007 |
June 2007 |
|
Amount |
Per cent to |
Amount |
Per cent to |
Amount |
Per cent to |
|
|
Total Assets |
|
Total Assets |
|
Total Assets |
1 |
2 |
3 |
4 |
5 |
6 |
7 |
Total Liabilities |
2,50,765 |
100.0 |
3,17,898 |
100.0 |
3,38,133 |
100.0 |
of which: |
|
|
|
|
|
|
a) Paid up Capital |
17,548 |
7.0 |
18,904 |
5.9 |
20,659 |
6.1 |
b) Preference Shares |
1,633 |
0.7 |
2,192 |
0.7 |
2,269 |
0.7 |
c) Reserve and Surplus |
39,100 |
15.6 |
52,090 |
16.4 |
57,246 |
16.9 |
d) Secured Loans |
71,509 |
28.5 |
93,765 |
29.5 |
94,853 |
28.1 |
e) Unsecured Loans |
1,03,086 |
41.1 |
1,18,221 |
37.2 |
1,26,018 |
37.3 |
Source : Monthly Returns by NBFCs-ND-SI. |
higher by 73.4 per cent as compared with the profit earned during the year ended March 2006 (Rs.4,301 crore), partly reflecting the increase in number of companies in this category (Table V.41).
5.93 While the gross NPAs to total assets ratio of NBFCs-ND-SI at 2.3 per cent declined during the year ended March 2007, the net NPAs to total assets ratio at 1.5 remained constant. Both the ratios, however, declined further during the quarter ended June 2007 (Table V.42).
Table V.39: Borrowings by NBFCs-ND-SI |
(Amount in Rs. crore) |
Item |
As at end |
|
March 2006 |
March 2007 |
June 2007 |
|
Amount |
Per cent to |
Amount |
Per cent to |
Amount |
Per cent to |
|
|
Total |
|
Total |
|
Total |
|
|
Borrowings |
|
Borrowings |
|
Borrowings |
1 |
2 |
3 |
4 |
5 |
6 |
7 |
A. |
Secured Borrowings (i to vi) |
71,509 |
41.0 |
93,765 |
44.2 |
94,853 |
42.9 |
|
i. |
Debentures |
39,179 |
22.4 |
32,564 |
15.4 |
36,566 |
16.6 |
|
ii. |
Deffered Credit |
– |
– |
– |
– |
– |
– |
|
iii. |
Term Loan from Banks |
16,116 |
9.2 |
19,503 |
9.2 |
18,972 |
9.0 |
|
iv. |
Term Loan from FIs |
6,997 |
4.0 |
5,030 |
2.4 |
5,413 |
2.5 |
|
v. |
Others |
8,612 |
4.9 |
35,745 |
16.9 |
33,049 |
15.0 |
|
vi. |
Interest Accrued |
604 |
0.3 |
923 |
0.4 |
852 |
0.4 |
B. |
Unsecured Borrowings( i to viii) |
1,03,086 |
59.0 |
1,18,221 |
55.8 |
1,26,018 |
57.1 |
|
i. |
Loans from
Relatives |
1,639 |
0.9 |
1,621 |
0.8 |
1,396 |
0.6 |
|
ii. |
ICDs |
19,459 |
11.1 |
20,018 |
9.4 |
20,913 |
9.5 |
|
iii. |
Loans from Banks |
28,276 |
16.2 |
33,191 |
15.7 |
32,098 |
14.5 |
|
iv. |
Loans from FIs |
3,703 |
2.1 |
4,218 |
2.0 |
4,142 |
1.9 |
|
v. |
Commercial Papers |
13,123 |
7.5 |
14,031 |
6.6 |
16,743 |
7.6 |
|
vi. |
Debentures |
20,788 |
11.9 |
30,549 |
14.4 |
35,865 |
16.2 |
|
vii. |
Others |
15,402 |
8.8 |
13,786 |
6.5 |
13,902 |
6.3 |
|
viii.Loans Interest Accrued |
697 |
0.4 |
807 |
0.4 |
959 |
0.4 |
|
Total Borrowings (A+B) |
1,74,595 |
100.0 |
2,11,986 |
100.0 |
2,20,870 |
100.0 |
|
Memo: |
|
|
|
|
|
|
|
Total Liabilities |
2,50,765 |
69.6 @ |
3,17,898 |
66.7 @ |
3,38,133 |
65.3 @ |
– : Nil/Negligible.
@ : Total borrowings as a percentage to total liabilities.
Source : Monthly Returns by NBFCs-ND-SI. |
Table V.40: Select Indicators on Application of Funds by NBFCs-ND-SI |
(Amount in Rs. crore) |
|
As at end |
Item |
March 2006 |
March 2007 |
June 2007 |
|
Amount |
Per cent to Total |
Amount |
Per cent to Total |
Amount |
Per cent to Total |
|
|
Application of |
|
Application of |
|
Application of |
|
|
Funds |
|
Funds |
|
Funds |
1 |
2 |
3 |
4 |
5 |
6 |
7 |
Secured Loan |
63,120 |
29.2 |
1,14,898 |
41.5 |
1,25,417 |
42.5 |
Unsecured Loan |
82,996 |
38.4 |
69,609 |
25.2 |
74,050 |
25.1 |
Hire Purchase Assets |
22,613 |
10.5 |
28,160 |
10.2 |
28,221 |
9.6 |
Long-term Investment |
30,817 |
14.3 |
43,309 |
15.7 |
47,350 |
16.0 |
Current Investment |
16,665 |
7.7 |
20,671 |
7.5 |
20,236 |
6.9 |
Total |
2,16,211 |
100.0 |
2,76,647 |
100.0 |
2,95,274 |
100.0 |
Memo: |
|
|
|
|
|
|
Capital Market Exposure |
59,583 |
27.6 |
81,435 |
29.4 |
84,947 |
28.8 |
of which: |
|
|
|
|
|
|
Equity Market |
27,467 |
12.7 |
34,196 |
12.4 |
31,658 |
10.7 |
Source : Monthly Returns by NBFCs-ND-SI. |
Table V.41: Financial Performance of |
NBFCs-ND-SI |
(Amount in Rs. crore) |
Item |
Year Ended |
Quarter Ended |
|
Mar-06 |
Mar-07 |
Jun-07 |
|
Amount |
Per cent |
Amount |
Per cent |
Amount |
Per cent |
|
|
to total Assets |
|
to total Assets |
|
|
1 |
2 |
3 |
4 |
5 |
6 |
7 |
Total Assets |
2,50,765 |
100 |
3,17,898 |
100 |
3,38,133 |
100 |
Total Income@ |
18,342 |
7.3 |
31,281 |
9.8 |
8,772 |
2.6 |
Total Expenses@ |
11,874 |
4.7 |
20,552 |
6.5 |
6,329 |
1.9 |
Net Profit@ |
4,301 |
1.7 |
7,460 |
2.3 |
1,963 |
0.6 |
@ : Cumulative.
Source : Monthly Returns by NBFCs-ND-SI. |
Table V.42: Gross and Net NPAs of |
NBFCs-ND-SI |
(Per cent) |
Item |
As at end |
|
|
March |
March |
June |
|
2006 |
2007 |
2007 |
1 |
2 |
3 |
4 |
1. |
Gross NPAs to Total Assets |
4.3 |
2.3 |
2.0 |
2. |
Net NPAs to Total Assets |
1.5 |
1.5 |
1.0 |
3. |
Gross NPAs to Total Credit Exposure |
7.0 |
4.9 |
4.8 |
4. |
Net NPAs to Total Credit Exposure |
3.2 |
1.9 |
1.9 |
Source : Monthly Returns by NBFCs-ND-SI. |
4. Primary Dealers
5.94 The primary dealer (PD) system underwent significant changes during 2006-07. PDs, as underwriters to the Government’s market borrowing and market makers in Government securities, are exposed to significant market risk. In order to diversify the risks inherent in the PD business, PDs were permitted to diversify into other business lines while retaining the requirement of maintaining predominance in Government securities business. PDs were allowed to diversify their investments into corporate debt, equity and securitisation instruments, subject to certain prudential limits so as to enable them to diversify their balance sheet risks. They were also allowed to offer certain fee based services.
5.95 Concomitantly, it was decided that PDs would not be permitted to set up step-down subsidiaries. Those PDs that already had step-down subsidiaries (in India and abroad) were advised to restructure the ownership pattern of those subsidiaries. This was done to ensure that the balance sheet of the PD does not get affected by the spillover of risks from other businesses/ subsidiaries and that the business of the PDs is focused on their primary dealership activities. Consequently, five out of eight stand-alone PDs, which either had step-down subsidiaries or undertook businesses other than those specifically permitted, were required to restructure their operations.
5.96 In compliance with these guidelines, five PDs, namely DSP Merrill Lynch Ltd. (DSPML), ICICI Securities Ltd. (ISEC), IDBI Capital Market Services Ltd. (ICMS), Securities and Trading Corporation of India Ltd. (STCI) and Kotak Mahindra Capital Company Ltd. (KMCC) restructured their operations as they either had step-down subsidiaries or they were undertaking equity broking business, which were not permitted under the guidelines. However, the approach to the restructuring process followed by these PDs was different. KMCC transferred the PD business to the parent bank (Kotak Mahindra Bank). ISEC restructured its subsidiaries so as to make them direct subsidiaries of ICICI Bank, while retaining the PD business with itself. It subsequently renamed itself as ICICI Securities Primary Dealership Ltd. (SEC-PD). STCI was restructured by setting up another subsidiary, viz., STCI Primary Dealer Ltd. (STCI-PD) to undertake PD business. In the case of ICMS, IDBI Gilts Ltd, a direct subsidiary of IDBI Bank Ltd. was set up to take over the PD business from ICMS. DSPML was restructured by setting up another subsidiary in the name of DSPML Securities Trading Ltd. (DSPMLST) for conducting the PD business.
5.97 During the year, the permitted structure of PD business was expanded to include banks, which fulfill certain minimum criteria subject to safeguards. Nine banks, viz., Citibank N.A., Standard Chartered Bank, HSBC Bank, Bank of America, J.P. Morgan Chase Bank, Bank of Baroda, Canara Bank, Kotak Mahindra Bank and Corporation Bank were authorised to undertake PD business departmentally while discontinuing the same from their respective subsidiaries/group companies. One new bank, viz., HDFC Bank Ltd., was authorised to undertake PD business from April 2, 2007.
5.98 Keeping in view the increased responsibility of PDs in the wake of the FRBM Act, 2003, changes were made in the system of underwriting the issues of dated Government securities by PDs. The revised system envisages underwriting the entire issue in an auction. The twin policy measures of expanding the permitted structure of the PD system to include banks and revising the scheme of underwriting have contributed to successful debt management in the post-FRBM scenario. Stand-alone PDs continued to remain adequately capitalised. Although the CRAR of PDs at 33 per cent as on March 31, 2007
Table V.43: Select Indicators of Primary Dealers |
(At end-March) |
(Amount in Rs. crore) |
Item |
2005 |
2006 $ |
2007 |
1 |
2 |
3 |
4 |
Total Assets* |
13,953 |
10,749 |
13,557 |
Of which: |
8,495 |
6,646 |
7,412 |
Government Securities |
|
|
|
Government securities |
61 |
62 |
55 |
as percentage of total assets |
|
|
|
Total Capital Funds |
5,992 |
4,229 |
4,026 |
CRAR (in per cent) |
57 |
53 |
33 |
Liquidity Support Limit |
3,000 |
3,000 |
3,000 |
No. of PDs |
17 |
8 |
8 |
* : Net of current assets and liabilities
$ : In view of the sharp reduction in the number of PDs operating during 2006-07, the figures for 2005-06 and 2006-07 are not strictly comparable. Comparable data for 2005-06 are presented in column 3 for the eight PDs operational during 2006-07. |
declined from the previous year’s level, it was much in excess of the stipulated minimum of 15 per cent of aggregate risk-weighted assets (Table V.43 and Appendix Table V.5).
Operations and Performance of PDs
5.99 During 2006-07, cumulative bidding commitments in Treasury Bills auctions were fixed at 111 per cent of the issue amount under the normal borrowing programme. The aggregate bids at Rs.2,07,711 crore were 3.2 times the Treasury Bills issuances of Rs.65,500 crore (under the normal/regular borrowing programme) and 1.1 times of the Treasury Bills issuances of Rs.1,85,000 crore [(under the normal/regular borrowing programme and market stabilisation scheme (MSS)]. Of the total bids of Rs.2, 07,111 crore, bids amounting to Rs.70,951 crore were accepted. PDs are required to achieve a success ratio of 40 per cent of bidding commitment in respect of Treasury Bills auctions on a half-yearly basis. The share of PDs in primary market purchases in Treasury Bills auctions (including MSS) was marginally higher during 2006-07 at 38 per cent as against 34 per cent during 2005-06.
5.100 In terms of the Fiscal Responsibility and Budget Management Act, 2003, the Reserve Bank was precluded from participating in the primary auctions of Central Government securities. The PDs were, therefore, enjoined to underwrite the entire notified amount in the auctions of dated Central Government securities. During 2006-07, dated securities worth Rs.1,46,000 crore were issued under normal borrowing programme. In the underwriting auctions, PDs submitted bids worth Rs.1,93,869 crore of which bids worth Rs.1,46,000 crore were accepted. This represented a bid-cover ratio of 1.32 in underwriting auctions. A sum of Rs.5,604 crore devolved on the PDs during 2006-07.
5.101 In the main auctions for dated Government of India securities, PDs submitted bids for Rs.2,02,225 crore against their underwriting commitment of Rs.1,46,000 crore (representing a bid-cover ratio of 1.39), of which bids worth Rs.64,727 crore were accepted. The share of primary dealers in the auctioned dated securities marginally declined to 44 per cent during the period 2006-07 from 48 per cent during the period 2005-06.
5.102 The secondary market turnover of Treasury Bills and Government dated securities (both outright and repo) traded by only stand- alone PDs amounted to Rs.3,24,571 crore and Rs.22,34,630 crore, respectively, constituting 18.3 per cent and 21.8 per cent, respectively, of the market turnover.
Sources and Application of Funds
5.103 The balance sheet size of the eight stand-alone PDs increased significantly during the year ended March 2007 (26.1 per cent) in line with the increase observed in the previous year (24.2 per cent) (Table V.44). Capital funds of stand-alone PDs increased by 46.3 per cent as on March 31, 2007 compared to the position as on March 31, 2006, which was mainly on account of shoring up of capital by one of the PDs through issuance of preference shares for Rs.675 crore. On the deployment side, investments in Government securities and commercial paper registered an increase. Loans and advances declined sharply. The share of Government securities and Treasury Bills in total assets of PDs declined to 55 per cent at end-March 2007 from 62 per cent at end-March 2006.
Table V.44: Sources and Applications of Funds of Primary Dealers |
(Amount in Rs. crore) |
|
As at end-March |
Percentage Variation |
Item |
2006 |
2006 $ |
2007 |
2005-06 |
2006-07 |
1 |
2 |
3 |
4 |
5 |
6 |
Sources of Funds |
13,953 |
10,749 |
13,557 |
24.2 |
26.1 |
1. |
Capital |
2,263 |
1,427 |
2,088 |
-4.6 |
46.3 |
2. |
Reserves and surplus |
3,843 |
2,856 |
3,102 |
12.8 |
8.6 |
3. |
Loans (a+b) |
7,847 |
6,466 |
8,367 |
39.9 |
29.4 |
|
a) Secured |
3,480 |
2,760 |
3,910 |
30.8 |
41.7 |
|
b) Unsecured |
4,367 |
3,706 |
4,457 |
47.6 |
20.3 |
Application of Funds |
13,953 |
10,749 |
13,557 |
24.2 |
26.1 |
1. |
Fixed assets |
71 |
64 |
72 |
-6.1 |
12.2 |
2. |
Investments (a to d) |
10,425 |
7,954 |
9,248 |
11.3 |
16.3 |
|
a) Government securities |
8,495 |
6,646 |
7,412 |
3.8 |
11.5 |
|
b) Commercial papers |
846 |
626 |
1,241 |
223.9 |
98.2 |
|
c) Corporate bonds |
1,084 |
682 |
595 |
23.3 |
-12.7 |
3. |
Loans and advances |
2,398 |
1,883 |
1,135 |
-6.5 |
-39.7 |
4. |
Non-current assets |
– |
– |
– |
-100.0 |
– |
Equity, Mutual Funds
etc. |
– |
– |
928 |
– |
– |
Others* |
1,059 |
848 |
2,174 |
-228.2 |
156.4 |
No. of PDs |
17 |
8 |
8 |
8 |
8 |
* : Others include cash + bank balances +
accrued interest + DTA-current liabilities and provisions.
$ : In view of the sharp reduction in the number of
PDs operating during 2006-07, the figures for
2005-06 and 2006-07 are not strictly comparable.
Comparable data for 2005-06 are presented in column 3 for
the eight PDs operational during 2006-07. |
Table V.45: Financial Performance of Primary Dealers |
(Amount in Rs. crore) |
Percentage Variation |
Item |
2005-06 |
2005-06 $ |
2006-07 |
2005-06 |
2006-07 |
1 |
2 |
3 |
4 |
5 |
6 |
A. |
Income (i to iii) |
2,153 |
1,661 |
1,950 |
204 |
17 |
|
i) |
Interest and discount |
1,151 |
814 |
986 |
8 |
21 |
|
ii) |
Trading Profit |
-47 |
46 |
-17 |
-108 |
-137 |
|
iii) |
Other income |
1,049 |
802 |
979 |
118 |
22 |
B. |
Expenses (i+ii) |
1,150 |
884 |
1,314 |
42 |
49 |
|
i) |
Interest |
670 |
485 |
668 |
34 |
38 |
|
ii) |
Administrative Costs |
481 |
398 |
645 |
53 |
62 |
Profit Before Tax |
1,003 |
778 |
636 |
-1142 |
-18 |
Profit After Tax |
749 |
557 |
444 |
-512 |
-20 |
No. of PDs |
17 |
8 |
8 |
|
|
$ : In view of the sharp reduction in the number of PDs
operating during 2006-07, the figures for 2005 06 and 2006-07
are not strictly comparable.
Comparable data for 2005-06 are presented in column 3 for
the eight PDs operational during 2006-07. |
Financial Performance of PDs
5.104 Income earned by stand-alone PDs increased by 17 per cent during 2006-07, on account of significant increase in interest and other income. This rise in income was, however, much lower than that witnessed during the previous year (204 per cent) in the previous year. However, PDs suffered marginal trading losses. The expenditure of the PDs recorded higher growth at 49 per cent due to increase in both interest expenses and other expenses. As a result of sharp increase in expenditure, net profits of the PDs declined by 20 per cent during 2006-07 (Table V.45).
5.105 The number of PDs posting net profit declined to six during 2006-07 from eight in the previous year. The decline in financial performance of PDs was reflected in return on average assets (ROA), which declined from 4.3 per cent during 2005-06 to 3.0 per cent during 2006-07, and return on net worth (RoNW), which declined from 13.6 per cent during 2005-06 to 9.5 per cent during 2006-07 (Table V.46 and Appendix Table V.6).
Table V.46: Financial Indicators of |
Primary Dealers |
(Amount in Rs. crore) |
Indicator |
2005-06 |
2005-06 $ |
2006-07 |
1 |
|
2 |
3 |
4 |
i) |
Net profit |
749 |
557 |
444 |
ii) |
Average Assets |
18,394 |
13,104 |
14,984 |
iii) |
Return on average assets |
4.1 |
4.3 |
3.0 |
|
(in per cent) |
|
|
|
Capital Funds |
5,992 |
4,229 |
4,026 |
No. of PDs |
17 |
8 |
8 |
$ : In view of the sharp reduction in the number of PDs operating
during 2006-07, the figures for 2005-06 and 2006-07
are not strictly comparable.
Comparable data for 2005-06 are presented in column 3 for the
eight PDs operational during 2006-07. |
|
 IST,
IST,


