RbiSearchHeader

Press escape key to go back

Past Searches

Theme
Theme
Text Size
Text Size
S3

RbiAnnouncementWeb

RBI Announcements
RBI Announcements

Asset Publisher

83725636

OBICUS Survey on the Manufacturing sector for Q3:2020-21

Today, the Reserve Bank released the results of the 52nd round of the Order Books, Inventories and Capacity Utilisation Survey (OBICUS) for the October-December 2020 quarter covering 644 manufacturing companies. The survey provides a snapshot of demand conditions in India’s manufacturing sector1.

Highlights:
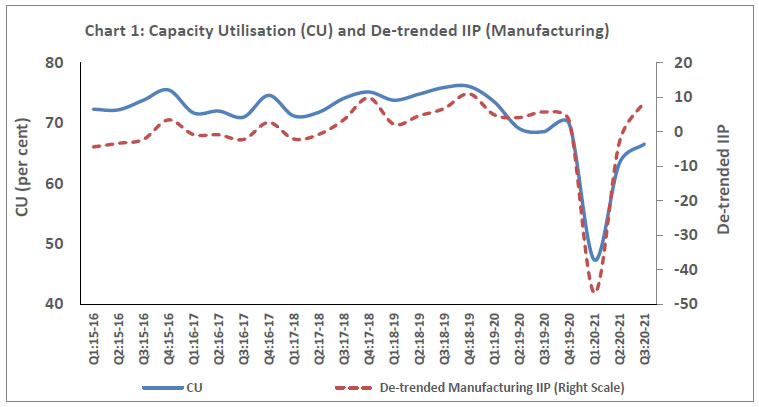
  • The aggregate level capacity utilisation (CU) improved further to 66.6 per cent in Q3:2020-21 from the level of 63.3 per cent recorded in Q2:2020-21, on the back of strengthening of production activities and easing of the restrictions related to the COVID-19 pandemic (Chart 1).
Chart 1
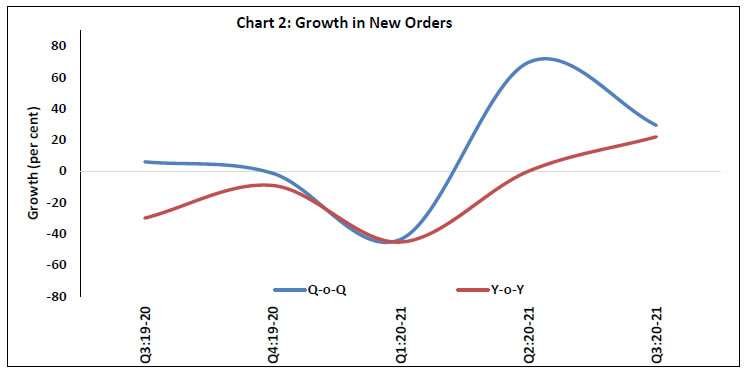
  • Manufacturing companies received more new orders during Q3:2020-21 as compared to that in the previous quarter as well as a year ago. Sequential growth (q-on-q) in new orders, however, moderated in Q3:2020-21 as it was on top of a period characterised by surge in orders due to easing of lockdown related restrictions (Chart 2).
Chart 2
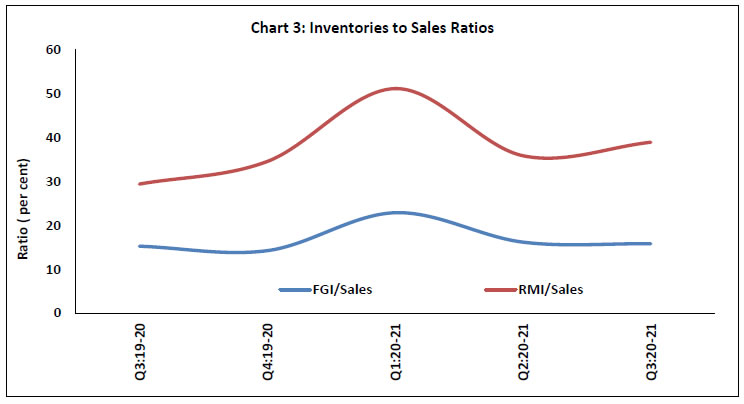
  • The ratio of raw material inventory (RMI) to sales increased marginally during the quarter, while finished goods inventory (FGI) to sales ratio remained stable (Chart 3).
Chart 3

Note - Please see the excel file for time series data.


ANNEX 1: Data Tables

Table 1.1: IIP*-Manufacturing and Capacity Utilisation (CU)
Quarter Number of responding companies Capacity Utilisation IIP-Manufacturing
(Quarterly Average)
De-trended Quarterly IIP-Manufacturing
Q3:2019-20 700 68.6 130.8 5.7
Q4:2019-20 349 69.9 127.9 3.1
Q1:2020-21 406 47.3 77.9 -46.7
Q2:2020-21 563 63.3 121.2 -3.1
Q3:2020-21 610 66.6 132.8 8.7
*: Index of Industrial Production (Base: 2011-12)

Table 1.2: Order Books (Q3:2019-20 to Q3:2020-21)
(Based on common set of 51 companies in 9 quarters)**
Quarter Amount (₹ Crores) Q-o-Q Growth (%)*** Y-o-Y Growth (%)
Average Backlog Orders Average New Order Book Average Pending Orders Average Backlog Orders Average New Order Book Average Pending Orders Average Backlog Orders Average New Order Book Average Pending Orders
Q3:2019-20 217.0 141.1 225.3 4.4 6.0 3.8 8.0 -30.0 11.8
Q4:2019-20 225.6 139.2 232.5 4.0 -1.3 3.2 12.2 -9.1 15.3
Q1:2020-21 232.4 78.5 235.2 3.0 -43.6 1.2 15.5 -45.4 13.3
Q2:2020-21 235.4 133.1 219.5 1.3 69.6 -6.7 13.2 0.0 1.1
Q3:2020-21 218.9 172.2 237.6 -7.0 29.4 8.3 0.9 22.0 5.5
**: As required for calculating growth rates in recent 5 quarters.
***: Not seasonally adjusted

Table 1.3: Average Sales and Inventories (Q3:2019-20 to Q3:2020-21)
(Based on common set of 156 companies in 5 quarters)
Quarter Amount (₹ Crores) Ratio (per cent)
Average Sales Average Total Inv Average FG Inv Average WiP Inv Average RM Inv Total Inv/Sales FG Inv/Sales RM Inv/Sales
Q3:2019-20 1037.8 536.5 158.3 72.9 305.3 51.7 15.3 29.4
Q4:2019-20 972.4 521.3 138.5 46.9 336.2 53.6 14.2 34.6
Q1:2020-21 548.3 485.7 125.5 79.6 280.6 88.6 22.9 51.2
Q2:2020-21 756.5 479.6 122.4 85.7 271.4 63.4 16.2 35.9
Q3:2020-21 830.8 532.5 131.4 77.5 323.6 64.1 15.8 38.9
RM - Raw Material; WiP - Work in progress; FG - Finished Goods; Inv – Inventory.

1The survey responses are voluntary. Results of the previous survey round were released on the Bank’s website on February 05, 2021.

RbiTtsCommonUtility

प्ले हो रहा है
ଶୁଣନ୍ତୁ

Related Assets

RBI-Install-RBI-Content-Global

RbiSocialMediaUtility

ରିଜର୍ଭ ବ୍ୟାଙ୍କ ଅଫ୍ ଇଣ୍ଡିଆ ମୋବାଇଲ୍ ଆପ୍ଲିକେସନ୍ ଇନଷ୍ଟଲ୍ କରନ୍ତୁ ଏବଂ ଲାଟେଷ୍ଟ ନିଉଜ୍ କୁ ଶୀଘ୍ର ଆକ୍ସେସ୍ ପାଆନ୍ତୁ!

Scan Your QR code to Install our app

RbiWasItHelpfulUtility

ଏହି ପେଜ୍ ସହାୟକ ଥିଲା କି?