 IST,
IST,


Quarterly Order Books, Inventories and Capacity Utilisation Survey (OBICUS) January-March 2014 (25th Round)
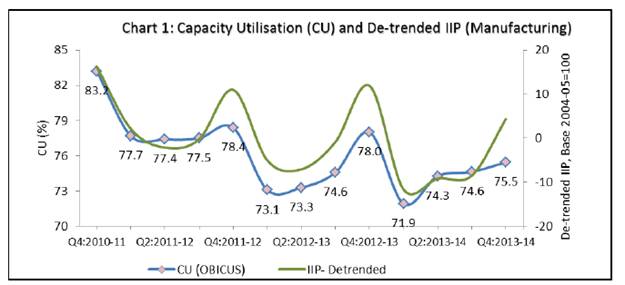
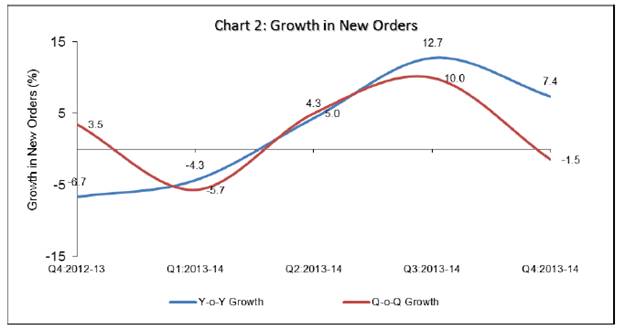
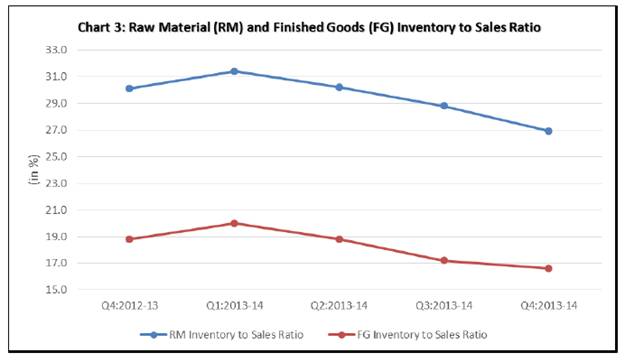
The Order Books, Inventories and Capacity Utilisation Survey (OBICUS) captures actual data from the companies in the manufacturing sector. This round of OBICUS, which is 25th round in the series, captures data for Q4:2013-14. In all, 1,049 common (for last five quarters) manufacturing companies (Government: 38, Public: 736 and Private: 275) responded in this round of survey. The analysis is based on the data on order books, inventory levels for raw materials & finished goods, and capacity utilisation, received from these common set of companies. Highlights: Capacity Utilisation (CU): CU, at the aggregate recorded seasonal increase and stood at 75.5 per cent in Q4:2013-14 as against 74.6 per cent in the previous quarter. However, it was lower when compared with the corresponding quarter of the previous year (78.0 per cent). The CU and de-trended IIP-Manufacturing is given in Chart 1. Order Books: The new orders declined in Q4:2013-14 over the previous quarter by 1.5 per cent. On a y-o-y basis, it grew at a slower rate (7.4 per cent) as compared to previous quarter (12.7 per cent) (Chart 2). Inventory to Sales Ratio: Finished goods inventory to sales ratio as well as raw material inventory to sales ratio continued to decline in Q4:2013-14 (Chart 3). ANNEX
1 The 24rd round (Q3:2013-14) survey results were released on April 1, 2014 with the publication “Macroeconomic and Monetary Developments 2014-15 (An Update)” on the RBI Website. The survey results are those of the respondents and are not necessarily shared by the Reserve Bank of India. |
|||||||||||||||||||||||||||||||||||||||||||||||||||||||||||||||||||||||||||||||||||||||||||||||||||||||||||||||||||||||||||||||||||||||||||||||||||||||||||||||||||||||||||||||||||||||||||||||||||||||||||||||||

ଏହି ପେଜ୍ ଶେୟାର୍ କରନ୍ତୁ:


ରିଜର୍ଭ ବ୍ୟାଙ୍କ ଅଫ୍ ଇଣ୍ଡିଆ ମୋବାଇଲ୍ ଆପ୍ଲିକେସନ୍ ଇନଷ୍ଟଲ୍ କରନ୍ତୁ ଏବଂ ଲାଟେଷ୍ଟ ନିଉଜ୍ କୁ ଶୀଘ୍ର ଆକ୍ସେସ୍ ପାଆନ୍ତୁ!
ଆମର ଆପ୍ ଇନଷ୍ଟଲ୍ କରିବାକୁ QR କୋଡ୍ ସ୍କାନ୍ କରନ୍ତୁ


ପେଜ୍ ଅନ୍ତିମ ଅପଡେଟ୍ ହୋଇଛି:


