 IST,
IST,


Agriculture’s Dependency on Monsoon Rainfall in India
by Kashyap Gupta, Sunil Kumar, and Sarthak Gulati^ South-west monsoon (SWM) remains important for foodgrains production. Given the El Nino concerns, this study empirically investigates the significance of SWM for kharif crops production amidst an improvement in irrigation infrastructure. The results indicate that while the impact of SWM rainfall is statistically significant, it has come down in the recent period. Furthermore, the impact is found relatively less pronounced in periods with more irrigation vis-à-vis less irrigation, indicating irrigation mitigates the adverse consequences of monsoon deficiency on agricultural production. The agriculture sector in India remains dependent on monsoon rainfall, especially on south-west monsoons (SWM). The average annual precipitation in India is estimated to be 4,000 billion cubic meter (BCM), with the average precipitation during SWM (June-September) at 3,000 BCM contributing about 80 per cent of the annual precipitation (State of Indian Agriculture, Government of India, 2017). There has been some shift in spatial distribution of SWM reflecting climate change. In this regard, Bhatla et al. (2022) report the western shift of Indian summer monsoon rainfall (ISMR) in changing climate with an enhancement of ISMR over Western India whereas a substantial decline over the Northeast Indian region. The precipitation during SWM remains critical for agriculture production during kharif season; however, with increasing irrigation facilities both in terms of quantity and reach, and adoption of water-efficient irrigation techniques, the dependency of Indian agriculture on monsoon rainfalls is reducing. For instance, SWM was 0.7 per cent below the long-period average (LPA) at all India level in 2021 and kharif foodgrains production increased by 3.2 per cent during the year. The SWM is impacted by a number of factors, notably the El Nino which results due to the buildup of warm water along the equator in the eastern Pacific. The warm ocean surface warms the atmosphere, which allows moisture-rich air to rise and develop into rainstorms. Although 2023 is an El Nino year, the Indian Meteorological Department (IMD) has forecast a normal SWM during 2023 as positive “Indian Ocean Dipole (IOD)” conditions (another weather effect) are likely to develop during SWM period and contain the impact of El Nino. SWM remains important not only for kharif foodgrains production but also for rabi foodgrains as they help the latter by improving moisture levels and augmenting reservoir levels. A recent study by Ghosh et al. (2023) also finds a positive and statistically significant relationship between annual rainfall growth and growth in agriculture GVA for the entire country. Against this backdrop and given El Nino concerns, this study focuses on examining the sensitivity of crops production to rainfall using state-wise1 annual data of SWM rainfall, irrigation and kharif crops production from 1988-89 to 2021-22 in a panel cointegration framework. The empirical analysis indicates that the elasticity of agricultural production to SWM has come down in the recent period, suggesting an increase in agriculture’s resilience to monsoon shocks. Furthermore, the impact of SWM is found relatively less pronounced with rising irrigation. The structure of the remaining study is as follows: Section II delves into the trends in SWM and foodgrains production; empirical findings are elaborated in Section III, and Section IV contains main conclusions. II: Trends in SWM and Kharif Crop Production SWM remains a function of several atmospheric and oceanic phenomenon which can lead to its volatility. This volatility has inched up with increased climatic variations and rising extreme weather events, which in turns affects the availability of water for Indian agriculture. In this context, Table 1 highlights the SWM rainfall deviation over the last 30 years and corresponding year-on-year (yoy) growth in production of major kharif crops. 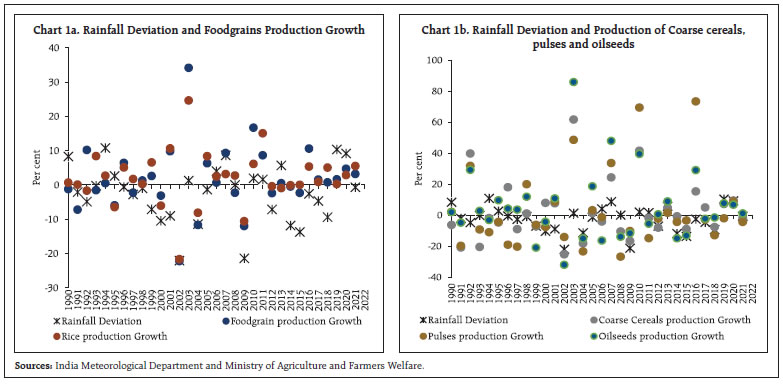 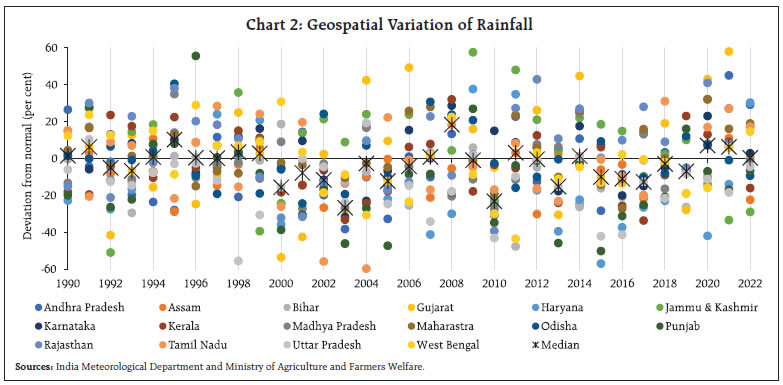 Since 2016, overall foodgrains and rice production have continued to expand every year despite lower than normal rainfall in 4 out of last 6 years (Chart 1a). However, coarse grains, pulses and oilseeds production remained volatile during this period (Chart 1b). Further, spatial distribution of monsoon remains uneven which contributes to the volatility in crops production also. Chart 2 shows the state-wise deviation of rainfall from normal over the last three decades. While the states remain vulnerable to rainfall volatility, they have built up irrigation facilities to reduce their dependence on SWM. As per the study on State of Indian Agriculture (2017), the total annual utilizable water resource through rivers and groundwater in the country is estimated to be 1,121 BCM. Almost all states have seen an increase in their net sown area irrigated over the last three decades. Among 17 major states, 9 states have over 50 per cent of their net sown area irrigated as compared to only 3 states during 1990 (Chart 3). 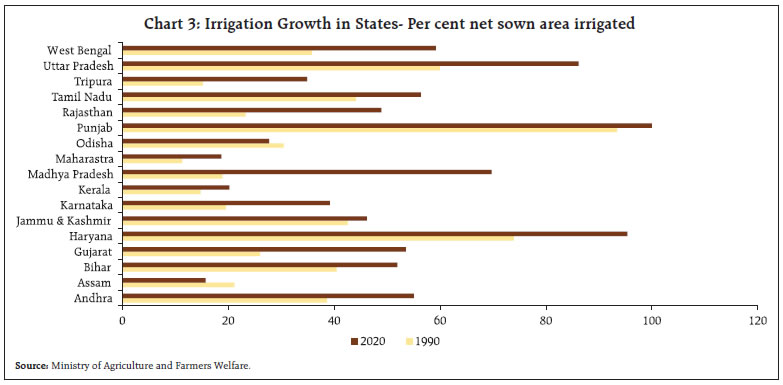 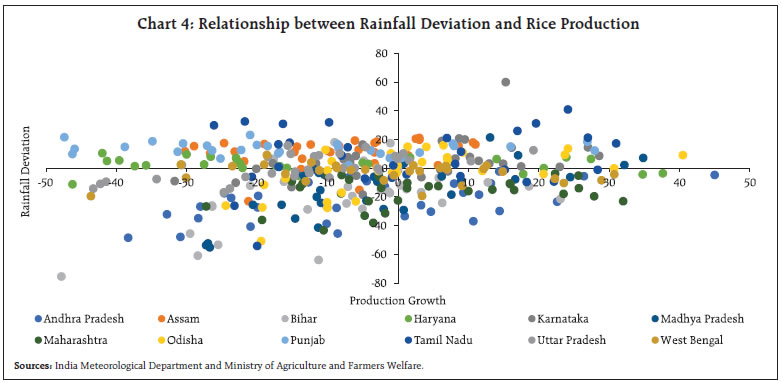 With improvement in irrigation facilities/infrastructure, the relationship between rainfall deviation and production of major crops does not appear to be direct. Chart 4 depicts the trends in deviation of rainfall from normal and growth in rice production across states during the last three decades. It could be seen that several states recorded expansion in rice production even during the years of deficient rainfalls and similarly, there have been several instances when rainfall is surplus but rice production declined. 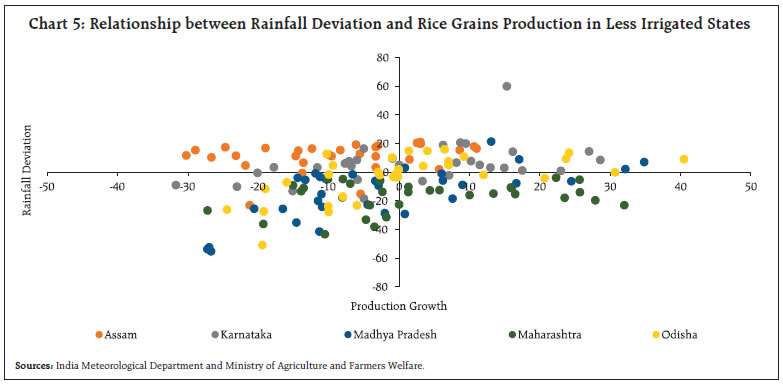 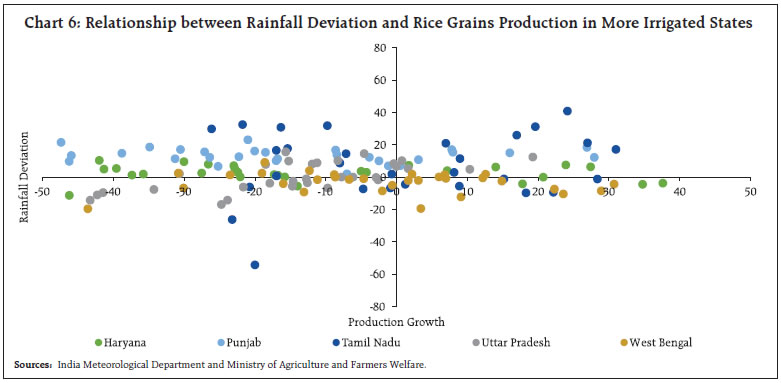 Chart 5 and Chart 6 highlight the relationship among two categories of states based on proportion of their net sown area being irrigated. In less irrigated states (defined as net irrigated area as per cent of net sown area less than 40 per cent), rice production declined during majority times when rainfall was deficient. On the other hand, rice production recorded expansion during large number of rainfall deficient times in many states with high coverage of irrigation (defined as net irrigated area as per cent of net sown area more than 40 per cent). This trend suggests that higher irrigation coverage can contain the impact of rainfall deficiency to some extent. 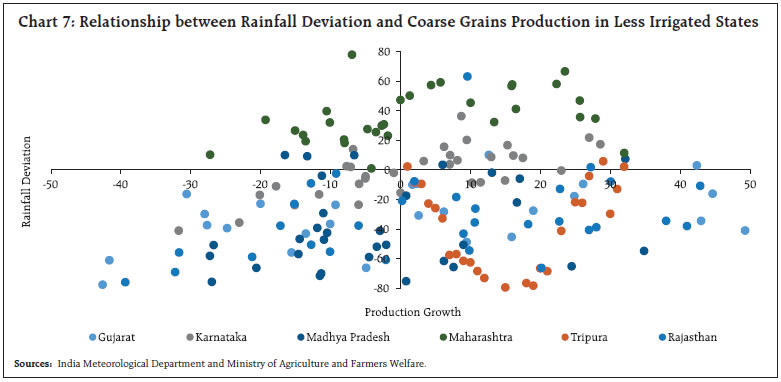 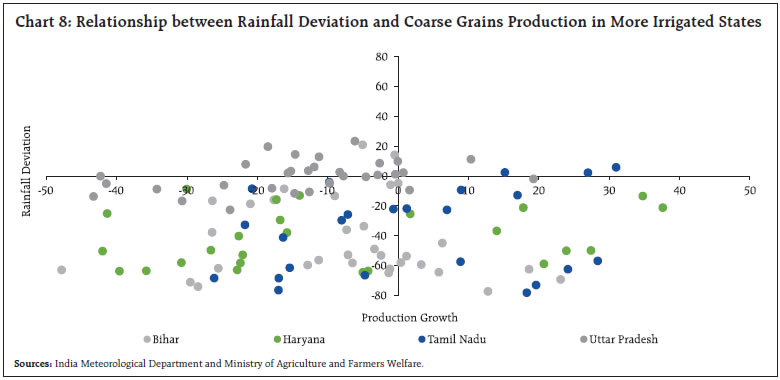 Similar relationship between rainfall deviation and coarse grains production is examined over the last three decades in Charts 7 and 8. In case of coarse grains production also, several states with lower irrigation coverage posted decline during large number of times when rainfall was deficient. However, for the more irrigated states, coarse grains production has continued to decline over the years, notwithstanding deficient and surplus rainfalls possibly owing to substitution of crops. Data & Model Specifications To empirically investigate the impact of SWM on agriculture production, this study considers state-wise annual data for the period 1988-89 to 2021-22 on crop production and gross sown area of four primary group of crops in the kharif season (namely rice, coarse cereals, pulses and major oilseeds); SWM rainfall published by the Indian Meteorological Department (IMD)2; and net irrigated area3 for eighteen major kharif crop producing states. Overall, the analysis is done using data for eighteen states and four crops, covering 1988-89 to 2021-22 (providing 1,768 observations). The full sample period (1988-89 to 2021-22) is also divided into three sub-periods: sub-period I (1988-89 to 1999-2000), sub-period II (2000-01 to 2010-11), and sub-period III (2011-12 to 2021-22) to analyse the changing impact of SWM rainfall on agriculture production. For the empirical analysis, a state grouped by crop - level cointegration panel analysis is performed incorporating long run dependence of production on area sown. Panel unit root results (Im, Pesaran and Shin and Levin, Lin and Chu) suggest the presence of unit root in both production and sowing rendering them non-stationary (Annex Table 1). Further, Pedroni’s panel cointegration test indicates strong presence of cointegration between the two variables. Kao’s cointegration test based on Augmented Dickey Fuller (ADF) test statistic also points towards a long run cointegrating relationship (Annex Table 2). Accordingly, panel cointegration approach is used for the estimation and the long and short-run dynamics are examined on the basis of the Pooled Mean Group (PMG) estimator (Pesaran et al., 1999). In the short-run dynamics, the main explanatory variable SWM rainfall (SWMR) is considered in the regressions in different forms: log of actual SWM rainfall, rainfall deviation (in per cent) from the long period average (LPA) and absolute value of the rainfall deviation to determine the non-linear impact. The absolute deviation in rainfall (i.e., ignore the sign of deviation) is used to assess the hypothesis that deviations on either side will have a negative impact on crop production. Since deficient rainfall is expected to have a more adverse impact on agricultural production, the panel cointegration model is estimated with a dummy variable corresponding to rainfall deviation of less than -19 per cent (as per deficient rainfall classification used by IMD). This dummy variable is also interacted with absolute value of rainfall deviation to capture the additional adverse impact of rainfall deviation in large deficient periods. To control for irrigation, net irrigated area as per cent of net sown area is used throughout the specifications. For robustness, the empirical analysis is also performed separately for the crops considered in the study. Finally, the analysis is done for the three sub-periods mentioned earlier to gauge the relative importance of the rainfall activity over time. Empirical results The panel cointegration results of all crops are furnished in Table 2. The long run coefficients of sowing are found to be high ranging from 0.76 to 0.86 indicating high proportional increase in production in response to area sown. In case of short-run dynamics, the error correction terms (ECT) are significant and high indicating production quickly adjusts to the long run levels in case of any shocks. The coefficients of sowing and irrigation are both positive and significant as per expectations. Turning to the impact of SWMR, all the measures are found to be statistically significant with expected signs. Rainfall level and deviation positively impacts production, on the other hand, absolute deviation, deficient dummy and the interaction of deficient dummy and absolute deviation adversely impacts agricultural production. Similar direction and sign are found for crop-wise regression results furnished in Annex Tables 3 to 6. The estimations also suggest that rice production is relatively less dependent on rainfall in comparison with the other three crops. This may be due to the fact that rice is primarily sown on irrigated areas. Pulses and oilseeds production are found to be heavily dependent on rainfall. In case of regression across subperiods, the estimated results show that the elasticity of rainfall has come down in the 2011-12 to 2021-22 period compared with 2000-01 to 2010-11 both for actual rainfall and deviation. The coefficient of the rainfall deficient dummy is negative as expected, and the negative impact of the deficient dummy is also coming down. In case of absolute deviation, the impact is more or less similar in sub-period III compared with sub-period II; however, when a deficient dummy is included in the regressions along with its interaction with absolute deviation, the impact of absolute deviation when rainfall is deficient is found to be less negative. Results for the different crops are found in similar lines (Table 3). Since PMG estimation results for sub-periods may suffer from loss of degrees of freedom due to availability of a smaller number of time periods, the sub-period results using a fixed effects panel specification is also produced in Annex (Annexure Table 7). The fixed effects panel estimation results also confirm less impact of rainfall in the recent sub-period variables except for oilseeds. Taking the empirical investigation further, in order to determine the role played by irrigation in resilience of crop production to monsoon, a fixed effects panel specification is estimated. In this specification, separate fixed effects of states and crops have been included to control for heterogeneity pertaining to states and crops, and accordingly, the following fixed effects model has been estimated:  where Pijt and Sijt are production and sowing respectively corresponding to state i of crop j in year t. Xit are absolute value of rainfall deviation and net irrigated area as per cent of net sown for state i in year t. Fixed effects θi, γj, and δt are used to control for unobserved heterogeneity in production across states, crops and time. Classification of less irrigated and more irrigated of each state in every year is made based on net irrigated area as per cent of net sown area (NIA), specifically, NIA observations below year-wise 25th quantile, median and 75th quantile of NIA are used as proxy for low irrigation, and thereafter, estimate different regressions on data partitioned based on low and high irrigation proxies to investigate whether rainfall has less impact when irrigation is high vis-a-vis low. The coefficients of absolute rainfall deviation while interacting with time dummies over the sample period clearly indicate that the negative impact of absolute deviation on agricultural production is waning over the years, suggesting increasing agriculture’s resilience to monsoon shocks. Furthermore, the impact of monsoon is found relatively less pronounced in periods with more irrigation vis-à-vis less irrigation, indicating that higher irrigation imparts resilience to agriculture production against the monsoon shortfalls (Chart 9, 10 and 11). 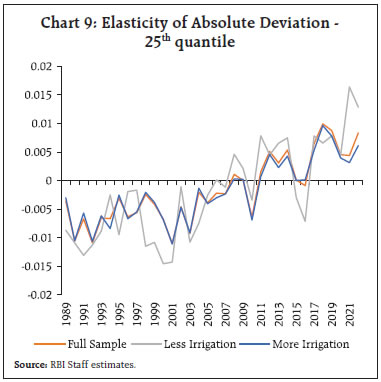 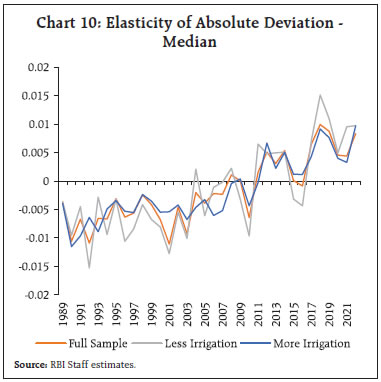 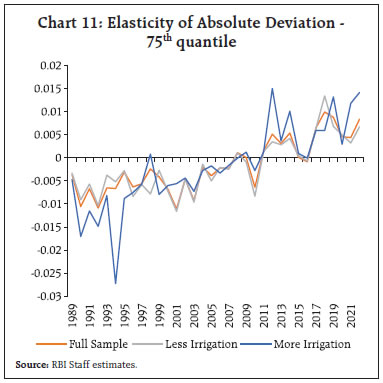 SWM remains important for kharif as well as rabi foodgrains. Given the El Nino concerns, this study empirically investigates the significance of SWM for kharif crop production amidst an improvement in irrigation infrastructure. The results indicate that while the impact of SWM rainfall is statistically significant, it has come down in the recent period. Furthermore, the impact is found relatively less pronounced in periods with more irrigation vis-à-vis less irrigation, indicating irrigation mitigates the adverse consequences of monsoon deficiency on agricultural production. With improving irrigation infrastructure, crops production is able to weather much better the negative shock to SWM rainfalls. Enhanced public spending on irrigation, therefore, can provide more strength to domestic agricultural production against the monsoon vagaries. References: Bhatla, R., Maurya, A., Sinha, P., Verma, S. and Pant, M. (2022), “Assessment of climate change of different meteorological state variables during Indian summer monsoon season”, Journal of Earth System Science volume 131, Article number: 136 (2022). Ghosh, S. and Kaustubh (2023), “Weather Events and their Impact on Growth and Inflation in India”, RBI Bulletin, June 2023. Pesaran, M. Hashem, Yongcheol Shin, and Ron Smith (1999), “Pooled Mean Group Estimation of Dynamic Heterogeneous Panels”, Journal of the American Statistical Association, 94.446, pp. 621-634. State of Indian Agriculture, 2017, Ministry of Agriculture and Farmers Welfare, Government of India. ^ The authors are from the Monetary Policy Department. The views are personal and do not represent the views of the Reserve Bank of India. The authors are thankful to Shri. Muneesh Kapur for his valuable guidance and suggestions. Authors acknowledge the valuable contribution of Pranjali Anandrao Duratkar for data assistance. 1 To maintain a consistent time series starting from 1988-89, rainfall deviation, crop production and irrigation data has been aggregated for the following states: Andhra Pradesh and Telengana ; Bihar and Jharkhand; Madhya Pradesh and Chattisgarh; and Uttar Pradesh and Uttarakhand. To aggregate rainfall, weighted average rainfall data has been used with weights as area of the states. 2 Rainfall data for the SWM season is not available for the states corresponding to the year 2011, accordingly weekly rainfall data for the months June to September 2011 has been aggregated for the financial year 2011-12. 3 To maintain a consistent time series starting from 1988-89, crop production and irrigation data has been aggregated for the following states: Andhra Pradesh and Telengana; Bihar and Jharkhand; Madhya Pradesh and Chattisgarh; and Uttar Pradesh and Uttarakhand. To aggregate rainfall, weighted average rainfall data has been used with weights as area of the states. |

ଏହି ପେଜ୍ ଶେୟାର୍ କରନ୍ତୁ:


ରିଜର୍ଭ ବ୍ୟାଙ୍କ ଅଫ୍ ଇଣ୍ଡିଆ ମୋବାଇଲ୍ ଆପ୍ଲିକେସନ୍ ଇନଷ୍ଟଲ୍ କରନ୍ତୁ ଏବଂ ଲାଟେଷ୍ଟ ନିଉଜ୍ କୁ ଶୀଘ୍ର ଆକ୍ସେସ୍ ପାଆନ୍ତୁ!
ଆମର ଆପ୍ ଇନଷ୍ଟଲ୍ କରିବାକୁ QR କୋଡ୍ ସ୍କାନ୍ କରନ୍ତୁ


ପେଜ୍ ଅନ୍ତିମ ଅପଡେଟ୍ ହୋଇଛି:


