Finances of Foreign Direct Investment Companies, 2013-14 - ଆରବିଆଇ - Reserve Bank of India


Finances of Foreign Direct Investment Companies, 2013-14
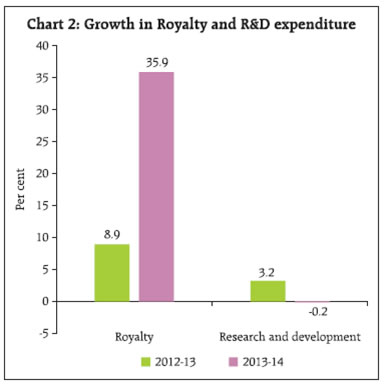
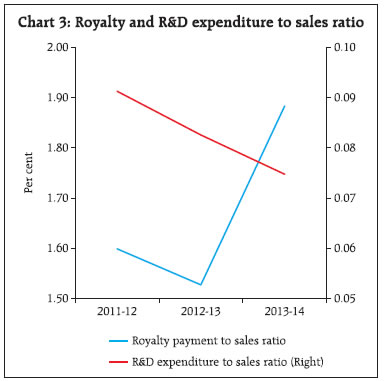
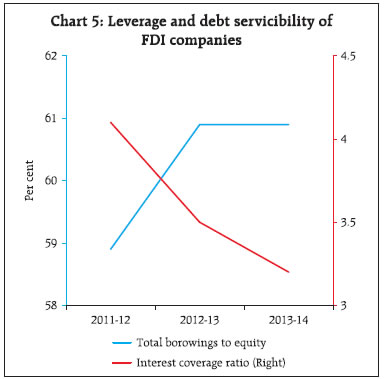
An analysis of financial performance of select 957 nongovernment non-financial foreign direct investment companies for the year 2013-14, based on their audited annual accounts showed that the sales growth and operating expenses decelerated during 2013-14 vis-à-vis the previous year. However, the growth in Earnings Before Interest, Tax, Depreciation and Amortization (EBITDA) and net profits (PAT) increased during 2013-14 mainly due to decline in the growth of manufacturing and interest expenses aided by the decline in imports growth and increase in exports growth. The performance of both manufacturing and services sectors had slowed down in terms of sales growth in 2013-14 vis-à-vis the previous year. The growth in total net assets increased marginally during the year. The leverage ratio remained unchanged in 2013-14 as compared to the previous year. EBITDA margin increased, whereas, return on equity (RoE) declined marginally in 2013-14. The select FDI companies relied mainly on external sources of funds for expanding their business and these funds were predominantly used for assets formation mainly in capital work-in-progress as well as in intangible assets and long-term investments in equity shares. This article presents an analysis of the financial performance of non-government non-financial (NGNF) foreign direct investment (FDI)1 companies for the financial year 2013-14 based on the audited annual accounts of select 957 FDI companies which closed their accounts during the period April 2013 to March 20142. These companies consist of 547 public limited companies and 410 private limited companies. These companies are classified into 11 major countries and 9 major industry groups. A company is classified into a country depending upon the country of origin with the largest FDI shareholder in the company. The industry group of the company is determined on the basis of the industry from which the company has reported more than 50 per cent of its total income. The article also assesses the performance of these companies during the period 2011-12 and 2012-13 based on the same set of companies’ data compiled for relevant financial years. Further, the performance of these select 957 FDI companies were also compared with those of 4,578 select non-FDI companies. Reference may be made to the detailed data of FDI companies for the year 2013-14 released on the website of the Reserve Bank of India along with explanatory notes in December 2015. Industrial composition of these FDI companies, showed that ‘Computer and related activities’ (84),‘Motor Vehicles and other Transport’ (68), ‘Machinery and machine tools’ (66),‘Chemicals and chemical products’ (63), and ‘Transport, storage and communication’ (45) were the predominant industries for foreign direct investment. While, among the countries of origin of foreign direct investment, Mauritius has the highest number of companies of FDI origin (215), followed by USA (148), Singapore (84), UK (74) and Germany (59)3. 1. Growth: Sales growth moderated but operating profits increased 1.1 The sales of FDI companies grew at a slower rate of 10.2 per cent in 2013-14 as against 14.0 per cent recorded in 2012-13. As a result, the growth in inventories of FDI companies increased marginally to 9.8 per cent in 2013-14 as compared to 8.3 per cent in 2012-13. The growth in the value of production as well as operating expenses decreased to 0.1 per cent and 9.8 per cent in 2013-14 respectively, from 13.3 per cent and 13.8 per cent witnessed in 2012-13 (Chart 1). 1.2 The growth in operating profits (EBITDA) of FDI companies increased to 12.1 per cent in 2013-14 as compared to10.4 per cent in 2012-13 mainly due to the moderation in manufacturing expenses during the year (Chart 1 and Statement 1). 1.3 As a result of increased operating profits and significant lower growth in interest expenses during the year, the net profits increased to 9.2 per cent in 2013-14 as compared to 6.3 per cent in 2012-13 (Chart 1). 1.4 The sales growth of both manufacturing as well as services sector of FDI companies declined in 2013-14 as compared to the previous year. In the manufacturing sector, the sales growth of all the industry groups declined in 2013-14 except for ‘Rubber and plastic products’, whereas in the services sector, the sales growth declined for ‘Transports, storage and communication’ (Statement 1). 1.5 Eventhough growth rate in operating profit increased at aggregate level, both manufacturing and service sector companies witnessed a decline in 2013-14. In the manufacturing sector, all the industry groups registered decrease in the growth rate of operating profits except in ‘Chemicals and chemical products’, ‘Motor vehicles and other transport equipments’ and ‘Rubber and plastic products’. In the services sector, all the industries groups witnessed decline in the growth rate of operating profit except for ‘Computer and related activities’ in 2013-14 as compared to the previous year (Statement 1). 1.6 The pattern of sales growth for non-FDI companies was similar to the sales growth of FDI companies, which recorded a decline from 8.7 per cent in 2012-13 to 6.2 per cent in 2013-14. The non-FDI companies witnessed moderate growth in operating expenses in 2013-14 visà- vis the previous year. The growth rate in operating profits of manufacturing and services sector in non-FDI companies decreased in 2013-14 as compared to the previous year (Statement 1). 2. Growth in earnings in foreign currencies improved whereas expenditure declined 2.1 The growth in total earnings in foreign currencies of select FDI companies increased to 17.6 per cent in 2013-14 as against 16.3 per cent in 2012-13. However, total expenditure in foreign currencies decreased significantly to13.4 per cent in 2013-14 from 18.2 per cent recorded in 2012-13 (Chart 1). 2.2 Growth in merchandise exports increased significantly to 22.0 per cent in 2013-14 as against 15.3 per cent in 2012-13. Also the exports intensity of sales (measured as exports to sales ratio) of FDI companies improved to 13.6 per cent in 2013-14 from 12.3 per cent witnessed in the previous year. Among the FDI share classes, sharp increase in exports growth was observed for the companies categorized in FDI share class of ‘50 per cent and above’. The manufacturing sector witnessed decline in the exports growth, whereas services sector registered significant growth in exports during 2013-14, mainly driven by exports in ‘Wholesale and retail trade’ and ‘Transports, storage and communication’ (Statement 1 and Statement 2). 2.3 In contrast, the imports growth had declined to 10.2 per cent in 2013-144 from 16.2 per cent in 2012-13. For manufacturing sector, imports growth dropped significantly to 1.0 per cent in 2013-14 from 15.7 per cent recorded in 2012-13. The decrease in imports growth was observed among all the manufacturing industry groups except for ‘Rubber and plastic products’. In Manufacturing Sector, import growth contracted for ‘Food products and beverages’, ‘Motor vehicles and other transport equipments’ and Electrical machinery and apparatus in 2013-14 as compared to the previous year. Services sector also witnessed sharp decline in imports growth during 2013-14, largely driven by ‘Wholesale and retail trade’ industry group, which declined to 3.4 per cent in 2013-14 from 42.9 per cent in the previous year (Statement 1). 2.4 For non-FDI companies, both exports and imports growth declined in 2013-14 as compared to the previous year. The exports growth declined to 11.2 per cent in 2013-14 from 12.9 per cent in 2012-13, whereas, growth in imports contracted by 1.0 per cent in 2013-14 from a growth rate of 7.9 per cent reported in 2012-13. The exports intensity of non-FDI companies increased marginally to 20.2 per cent in 2013-14 from 19.3 per cent in 2012-13. The significant decline in imports was observed in both the manufacturing sector and services sector of non-FDI companies (Statement 1 and Statement 2). 2.5 The share of earnings in foreign currencies in the total income of both FDI and non-FDI companies increased in 2013-14, but this was higher for non-FDI companies as compared to the FDI companies. As regards the merchandise exports of goods, the share in total income for FDI and non-FDI companies increased gradually over the three years period (Table 1). 2.6 The share of expenditure in foreign currencies in the total expenditure of FDI companies increased in 2013-14. However, for non-FDI companies, share of total expenditure in foreign currencies in total expenditure declined in 2013-14 as compared to the previous years. As regards the value of imports, the share in total expenditure for FDI and non-FDI companies declined marginally in the 2013-14 as compared to the previous years (Table 1). 3. Growth in Research and Development expenditure contracted 3.1 The Research and Development (R&D) expenditure of FDI companies contracted by 0.2 per cent in 2013-14 from a growth rate of 3.2 per cent registered in 2012-13. The royalty payment grew significantly by 35.9 per cent in 2013-14 as compared to 8.9 per cent in 2012-13 (Chart 2). 3.2 R&D expenditure to sales ratio exhibited declining trend during 2011-12 to 2013-14. Royalty payments to sales ratio, however, increased in 2013-14 as compared to the previous year (Chart 3). 3.3 Among the FDI share classes, R&D expenditure contracted by 12.6 per cent for companies categorized in FDI share class of ‘50 per cent and above’ in 2013-14 as compared to the previous year. The manufacturing sector witnessed marginal increase in R&D expenditure during 2013-14 as compared to the previous year. While for services sector, the growth in R&D expenditure contracted by 44.2 per in 2013-14 as compared to 51.7 per cent growth registered in 2012-13 (Statement 1). 3.4 The growth in royalty payment for manufacturing sector decreased significantly to 11.3 per cent in 2013- 14 from 22.0 per cent in the previous year. Services sector, however, witnessed significant increase in royalty payment by 55.3 per cent in 2013-14 as compared to a growth rate of 4.7 per cent in 2012-13 (Statement 1). 3.5 For non-FDI companies, growth in R&D expenditure increased in 2013-14, whereas, growth in royalty payment decreased in 2013-14 as compared to the previous year (Statement 1). 4. Growth in total net assets increased marginally 4.1 The growth in total net assets of FDI companies increased to 13.8 per cent in 2013-14 from 11.3 per cent in the previous year. However, companies categorized in the FDI share class of ‘25 to 50 per cent’ witnessed a marginal decline in growth rate in total net assets (Statement 1). 4.2 All industry groups in the manufacturing sector registered a growth in total net assets during 2013-14. In the services sector, the growth in total net assets increased to 12.0 per cent in 2013-14 from 8.7 per cent in 2012-13, which was mainly contributed by higher growth in ‘Computer and related activities’ and ‘Transport, storage and communication’ industry groups (Statement 1). 4.3 In contrast with FDI companies, the growth in total net assets for non-FDI companies declined to 8.9 per cent in 2013-14 as against 10.6 per cent in 2012-13. The moderation in growth of total net assets was observed for the manufacturing sector, whereas, for service sector the growth in total net assets increased in 2013-14, largely driven by ‘Computer and related activities’ and ‘Transport, storage and communication’ industries (Statement 1). 5. Profitability ratios declined marginally 5.1 The profitability of FDI companies as measured by return on equity (measured as a ratio of PAT to net worth) witnessed a marginal decline in 2013-14 vis-à-vis the previous year, whereas EBITDA margin increased marginally in 2013-14 (Chart 4). 5.2 Marginal increase in EBITDA margin with decline in RoE was observed in all the FDI-share classes. Marginal increase in EBITDA margin with decrease in RoE was observed for manufacturing sector in 2013-14. However, in contrast with the manufacturing sector, EBITDA margin of services sector declined marginally with increase in RoE during 2013-14 as compared to the previous year (Statement 2). 6. Interest coverage ratio declined 6.1 The leverage ratio (measured as a ratio of total borrowings to equity) of FDI companies remained unchanged at 60.9 per cent in 2013-14 as compared to the previous year. On the other hand, the interest coverage ratio (measured as a ratio of earnings before interest and tax to interest expenses) declined gradually from 4.1 per cent in 2011-12 to 3.2 per cent in 2013-14 (Chart 5). 6.2 Decrease in leverage ratio was observed among all FDI share classes except for the companies categorized in ‘50 per cent and above’. The leverage ratio for manufacturing sector increased marginally in 2013-14, whereas, it witnessed a decline for services sector. In manufacturing sector, increase in leverage ratio was observed for ’Chemicals and chemical products’ and ‘Motor vehicles and other transport equipments’ industries. In the services sector, leverage ratio declined for ‘Wholesale and retail trade’ industry (Statement 2). 6.3 For the non-FDI companies, the leverage ratio had increased marginally to 69.9 per cent in 2013-14 from 69.1 per cent in the previous year. The leverage ratio of manufacturing sector increased in 2013-14, whereas it decreased for services sector (Statement 2). 7. Liabilities Structure: Share of long-term borrowings in total liabilities increased marginally 7.1 The share of long-term borrowings in total liabilities of FDI companies increased marginally to 17.7 per cent in 2013-14 from 17.6 per cent in 2012-13. In contrast, the share of term loans decreased in 2013- 14 as compared to the previous year, mainly contributed by lower share of borrowings from banks. However, the share of shareholders’ funds remained unchanged at 43.7 per cent in the year 2013-14 as compared to the previous year (Table 2). 7.2 In line with FDI companies, the share of long-term borrowings in total liabilities for non-FDI companies increased marginally in 2013-14 and that of shareholders’ funds remained unchanged in 2013-14 vis-à-vis the previous year. However, in contrast to FDI companies, the share of term loans in total liabilities for non-FDI companies increased marginally in 2013-14 mainly due to marginal increase in the share of borrowings from banks (Table 2). 7.3 The share of current liabilities (includes short-term borrowings, trade payables, etc.) in total liabilities for FDI companies increased marginally in 2013-14 vis-à-vis the previous year, whereas, the share of current liabilities for non-FDI companies decreased marginally. 8. Asset Structure: Share of gross fixed assets in total assets decreased marginally 8.1 The share of gross fixed assets, which is a major component of the total assets of FDI companies, decreased marginally to 59.7 per cent in 2013-14 from 59.9 per cent in 2012-13. However, the share of longterm investments in total assets witnessed a marginal increase in 2013-14 as compared to the previous year (Table 3). 8.2 The share of inventories and trade receivables in total assets declined marginally in 2013-14. The share of trade receivables in total assets declined to 10.4 per cent in 2013-14 from 11.1 per cent in 2012-13 (Table 3). 8.3 Similar to FDI companies, the share of long-term investments in total assets for non-FDI companies had increased to 15.9 per cent in 2013-14 from 14.7 per cent in 2012-13. However, the share of gross fixed assets in total assets increased marginally in 2013-14 vis-à-vis the previous year (Table 3). 9. Sources of Funds: External sources continued to dominate in business expansion and its share in total sources of funds increased 9.1 The external sources of funds (i.e., other than internally generated funds) continued to play a major role in expanding business of FDI companies during 2013-14. Their share in total sources of funds increased to 66.8 per cent in 2013-14 from 54.3 per cent in 2012-13, mainly contributed by significant increase in the funds raised through ‘share capital and premium’ and the longterm borrowings. The share of long-term borrowings in total sources of funds increased to 15.8 per cent in 2013-14 from 13.0 per cent in 2012-13 (Table 4). 9.2 The share of internal sources of funds in total sources of funds declined significantly to 33.2 per cent in 2013-14 from 45.7 per cent in 2012-13 (Table 4). 9.3 For non-FDI companies also, the external sources of funds continued to dominate for business expansion in 2013-14. However, the share of external sources of funds in total sources of funds for non-FDI companies declined to 52.8 per cent in 2013-14 from 58.0 per cent in 2012-13, largely due to significant decline in the funds raised through short-term borrowings. The share of internal sources of funds in total sources of funds increased significantly from 42.0 per cent in 2012-13 to 47.2 per cent in 2013-14 (Table 4). 10. Uses of Funds: Share of gross fixed assets formation and long-term investments in total uses of funds declined 10.1 The overall share of gross fixed assets formation and long-term investment in total uses of funds for FDI companies declined to 49.7 per cent and 12.2 per cent in 2013-14, respectively, vis-à-vis 52.4 per cent and 14.3 per cent in 2012-13. A larger share of capital formation was reported as work-in-progress and also as intangible assets. Similarly, the share of equity instruments in non-current investments increased significantly in 2013-14. Further, the share of long-term loans and advances in total uses of funds also went up in 2013-14 (Table 4). 10.2 The share of ‘Inventories’ in the total uses of funds was lower in 2013-14 as compared to the previous year. Also, the share of funds in the form of ‘Trade receivables’ in total uses of funds declined significantly to 4.7 per cent in 2013-14 from 11.1 per cent registered in 2012-13 (Table 4). 10.3 Similar to FDI companies, the share of gross fixed assets formation in total uses of funds for non-FDI companies also declined in 2013-14 as compared to the previous year. However, the share of long-term investments in total uses of funds had increased significantly to 24.4 per cent in 2013-14 from 6.1 per cent in 2013-14 (Table 4). 11. Conclusion 11.1 The sales of FDI companies grew at a slower rate in 2013-14 as compared to the previous year. However, the growth in operating profits and net profit increased as compared to the previous year mainly due to decline in the manufacturing and interest expenses aided by the decline in imports growth and increase in exports growth. Royalty payments, especially for the companies in services sector, however, witnessed significant increase. 11.2 EBITDA margin of FDI companies increased, whereas, return on equity declined in 2013-14. 11.3 The performance of both manufacturing and services sectors for FDI companies slowed down in terms of sales growth in 2013-14 vis-à-vis the previous year. 11.4 The growth in total net assets of FDI companies increased during the year. The leverage ratio remained unchanged in 2013-14 as compared to the previous year. 11.5 The select FDI companies relied mainly on external sources of funds for expanding their business and these funds were predominantly used for assets formation - capital work-in-progress as well as intangible assets and also for long-term investments in equity shares.
* Prepared in the Company Finances Division of the Department of Statistics and Information Management, Reserve Bank of India. Reference may be made to the January 2015 issue of the RBI Bulletin for the previous year’s study. 1 As per the Balance of Payments and International Investment Position Manual, Sixth Edition (BPM6) of the International Monetary Fund (IMF), Foreign Direct Investment (FDI) is a ‘category of cross-border investment associated with a resident in one economy having control or a significant degree of influence on the management of an enterprise that is resident in another economy.’ The BPM6 suggests that ‘immediate direct investment relationships arise when a direct investor directly owns equity that entitles it to 10 per cent or more of the voting power in the direct investment enterprise.’ 2 The paid-up capital (PUC) of select 957 NGNF FDI companies in the year 2013-14 accounted for 18.5 per cent of total PUC of Non-Financial FDI companies reported in the Reserve Bank’s Census on Foreign Liability and Assets of Indian Companies 2013-14. 3 Figures in braces indicates the number of companies. 4 The growth in imports of FDI companies during 2013-14 was mainly on account of sudden increase in imports in ‘Mining and Quarrying’ in 2013-14 as compared to the previous year. Imports for ‘Mining and Quarrying’ increased to ₹191.4 million in 2013-14 from ₹5.7 million in 2012-13. | |||||||||||||||||||||||||||||||||||||||||||||||||||||||||||||||||||||||||||||||||||||||||||||||||||||||||||||||||||||||||||||||||||||||||||||||||||||||||||||||||||||||||||||||||||||||||||||||||||||||||||||||||||||||||||||||||||||||||||||||||||||||||||||||||||||||||||||||||||||||||||||||||||||||||||||||||||||||||||||||||||||||||||||||||||||||||||||||||||||||||||||||||||||||||||||||||||||||||||||||||||||||||||||||||||||||||||||||||||||||||||||||||||||||||||||||||||||||||||||||||||||||||||||||||||||||||||||||||||||||||||||||||||||||||||||||||||||||||||||||||||||||||||||||||||||||||||||||||||||||||||||||||||||||||||||||||||||||||||||||||||||||||||||||||||||||||||||||||||||||||||||||||||||||||||||||||||||||||||||||||||||||||||||||||||||||||||||||||||||||||||||||||||||||||||||||||||||||||||||||||||||||||||||||||||||||||||||||||||||||||||||||||||||||||||||||||||||||||||||||||||||||||||||||||||||||||||||||||||||||||||||||||||||||||||||||||||||||||||||||||||||||||||||||||||||||||||||||||||||||


ଏହି ପେଜ୍ ଶେୟାର୍ କରନ୍ତୁ:


ରିଜର୍ଭ ବ୍ୟାଙ୍କ ଅଫ୍ ଇଣ୍ଡିଆ ମୋବାଇଲ୍ ଆପ୍ଲିକେସନ୍ ଇନଷ୍ଟଲ୍ କରନ୍ତୁ ଏବଂ ଲାଟେଷ୍ଟ ନିଉଜ୍ କୁ ଶୀଘ୍ର ଆକ୍ସେସ୍ ପାଆନ୍ତୁ!


