IV. Monetary Conditions - ଆରବିଆଇ - Reserve Bank of India
IV. Monetary Conditions
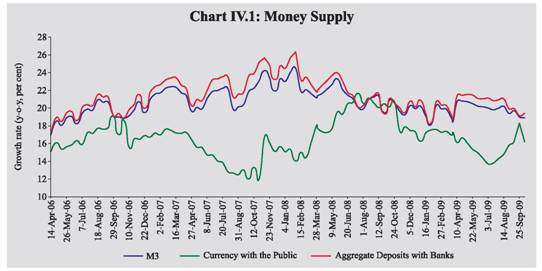
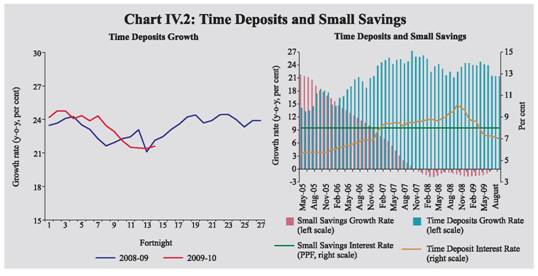
| The accommodative monetary policy stance of the Reserve Bank has continued during 2009-10 so far to support the emerging recovery. While broad money growth witnessed some moderation in recent period, availability of surplus liquidity in the system was evident in the large daily absorption through reverse repo by the Reserve Bank. With the persistence of deceleration in bank credit to the commercial sector, high deposit growth and the Reserve Bank’s liquidity augmenting measures created space for market absorption of the large government borrowing programme. Flow of resources from non-bank sources to the commercial sector during 2009-10 so far has been marginally higher than the corresponding period of the previous year. IV.1 Monetary and liquidity conditions during 2009-10 so far have been conditioned by the continuation of accommodative monetary policy stance of the Reserve Bank to support a faster economic recovery. Broad money growth (year-on-year) witnessed some moderation during the second quarter of 2009-10 but still remained above the Reserve Bank’s projected trajectory of 18.0 per cent for 2009-10. On the sources side of monetary expansion, banking system’s credit to the Government continued to be the major driver as bank credit to the commercial sector continued to exhibit deceleration. On the component side of monetary expansion, the key driver was the high growth in aggregate deposits. The movements in reserve money reflected the changes in net Reserve Bank credit to the Centre and net foreign assets with the Reserve Bank. Expansion of net Reserve Bank credit to the Centre through purchases under open market operations and unwinding of MSS was moderated significantly due to large daily absorption of liquidity through reverse repo window under LAF. Net foreign assets (net of valuations) with the Reserve Bank recorded an increase in the second quarter of 2009-10, after witnessing decline in the previous quarter. IV.2 The thrust of the various policy initiatives taken by the Reserve Bank since mid-September 2008 has been on providing ample rupee for the smooth functioning of the financial market, ensuring comfortable dollar liquidity and maintaining a market environment conducive for the continued flow of credit to productive sectors to revive the economic growth in the midst of severe global recession. The important measures which reflect the accommodative monetary policy stance include reduction of the repo and reverse repo rates, reduction of the CRR and the SLR, and institution of several sector-specific liquidity facilities. Since October 11, 2008, the Reserve Bank reduced CRR by a cumulative 400 basis points to 5.0 per cent of net demand and time liabilities (NDTL), repo rate by 425 basis points to 4.75 per cent and the reverse repo rate by 275 basis points to 3.25 per cent. The nature of injection of liquidity through unwinding of MSS and reduction of CRR ensured the attainment of the Reserve Bank’s objective of maintaining ample liquidity in the system without expanding the balance sheet of the Reserve Bank or compromising on the quality of the assets in the balance sheet. Monetary Survey IV.3 On a year-on-year (y-o-y) basis, M 3 growth was 18.9 per cent as on October 9, 2009 as compared with 20.9 per cent a year ago. The growth in M3 mainly reflected the sustained expansion in aggregate deposits during this period. Within aggregate deposits, time deposits registered a growth (y-o-y) of 20.9 per cent as on October 9, 2009 as compared with 21.6 per cent a year ago (Table 4.1 and Chart IV.1). Banks mobilised large time deposits during the third quarter of 2008-09, as investors reallocated their portfolios in favour of bank deposits with the intensification of financial crisis and increase in risk perception in the face of snowballing uncertainty. This period also witnessed a shift from demand deposits to time deposits. Demand deposits that posted a sharp decline in the last two quarters of 2008-09 and registered a growth of only 0.5 per cent at end-March 2009 witnessed a turnaround. Demand deposits expanded by 10.3 per cent (y-o-y) as on October 9, 2009 as compared with 17.7 per cent a year ago. The net outflows from small savings schemes that started in December 2007 continued up to July 2009 (the latest period for which the data are available) (Chart IV.2). Growth in currency with the public moderated to 16.2 per cent (y-o-y) as on October 9, 2009 as compared with 20.1 per cent a year ago, mainly reflecting the impact of moderation in economic activity on currency demand.
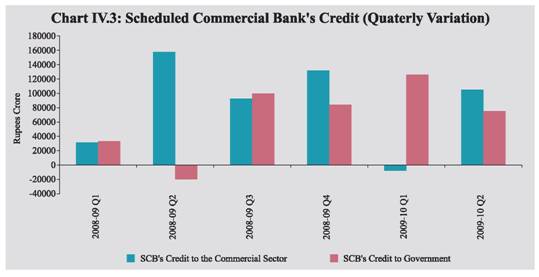
IV.4 On a financial year basis, growth in M3 during 2009-10 (up to October 9, 2009) was 8.0 per cent as compared with 7.7 per cent during the corresponding period of the previous year (Table 4.2). IV.5 A quarter-wise analysis of growth in bank credit shows that expansion in bank credit recovered in the second quarter of 2009-10 from an absolute decline posted in the first quarter, although the expansion of credit remained much lower than the corresponding quarter of the previous year (Chart IV.3).
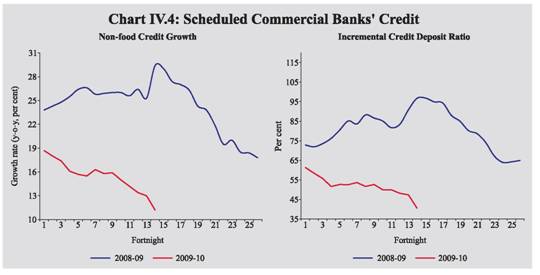
IV.6 Much of the financial year expansion in broad money (M3) during 2009-10 (up to October 9, 2009) resulted from the increase in commercial banks’ credit to the Government. On the other hand, net Reserve Bank credit to the Centre during 2009-10 (up to October 9, 2009) decreased, reflecting large absorption under the LAF, despite the sizeable decline in outstanding balances under MSS with the Reserve Bank and increase in purchases under OMOs. IV.7 Non-food credit growth (y-o-y) of scheduled commercial banks (SCBs) that reached its peak in October 2008, witnessed sustained deceleration thereafter, reflecting moderation in economic activity. Non-food credit by SCBs expanded by 11.2 per cent, y-o-y, as on October 9, 2009, lower than 29.4 per cent a year ago and the Reserve Bank’s indicative projected trajectory of 20.0 per cent as set out in the First Quarter Review for 2009-10. The lower expansion in credit relative to the significant expansion in deposits during 2009-10 has resulted in a decline in the incremental credit-deposit ratio (Chart IV.4).
IV.8 Though the moderation in credit growth was witnessed across the banking sector, credit growth decelerated sharply for private banks while foreign banks registered a decline (Table 4.3). Theexpansion of credit from the public sector banks has also moderated to some extent. IV.9 Scheduled commercial banks’ investment in SLR securities expanded by 40.9 per cent (y-o-y) as on October 9, 2009, as compared with 3.2 per cent a year ago, driven by the higher market borrowing by the Government (Table 4.4). This was facilitated by low credit growth and ample liquidity in the system. Commercial banks’ holdings of such securities as on October 9, 2009 at 30.4 per cent of their net demand and time liabilities (NDTL) were higher than 28.1 per cent at end-March 2009 and 25.7 per cent a year ago. Excess SLR investments of SCBs increased to Rs.2,91,279 crore as on October 9, 2009 from Rs.1,69,846 crore at end-March 2009 and Rs.26,933 crore a year ago. SCB’s also increased their investment in non-SLR securities substantially. Simultaneously, SCBs reduced their overseas foreign currency borrowings and increased their holding of foreign currency assets.
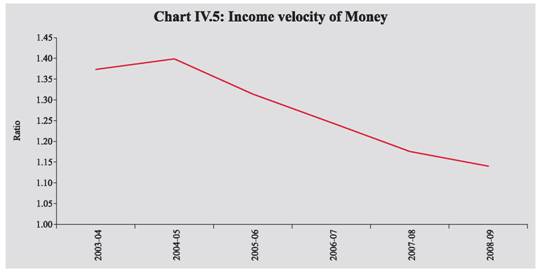
IV.10 Growth and inflation conditions changed significantly during the course of 2008-09. In 2009-10 so far, while growth impulses remained subdued, the divergence between WPI and CPI inflation reached a high level. Given such high variability in growth and inflation, money growth may have to be seen in relation to the recent trend in income velocity of money (Chart IV.5). IV.11 Disaggregated data on sectoral deployment of gross bank credit available up to August 28, 2009 show that 53.8 per cent of incremental non-food credit (y-o-y) was absorbed by industry as compared with 47.5 per cent in the corresponding period of the previous year. The agricultural sector absorbed 21.8 per cent of the incremental non-food bank credit as compared with 8.5 per cent in the corresponding period of the previous year. Personal loans that accounted for 4.1 per cent of the incremental non-food credit witnessed moderation; within personal loans, housing loans decelerated to a large extent. Growth in loans to commercial real estate, however, remained high. Credit card and consumer durables segments exhibited negative growth in credit, which corroborates the sharp decline in private consumption demand as per GDP data for the first quarter of 2009-10. Growth in incremental credit for services activities also exhibited significant deceleration (Table 4.5).
IV.12 Apart from banks, the commercial sector mobilised resources from a variety of other sources such as capital markets, issuance of commercial papers (CPs), non-banking financial companies (NBFCs), financial institutions, external commercial borrowings (ECBs), American Depository Receipts (ADRs)/Global Depository Receipts (GDRs) and foreign direct investment. During the first half of 2009-10, flow of resources from external sources was lower as compared with the corresponding period of the previous year, although they were significantly higher as compared to the second half of 2008-09. On the other hand, resources mobilised through domestic non-bank sources recorded an increase during this period with significant increase in issuance of CPs and private placements. Thus, total flow of resources from non-bank sources has recorded an increase during 2009-10 so far as compared with the corresponding period of the previous year (Table 4.6). The total flow of financial resources to the commercial sector, however, remained lower, reflecting moderation in expansion in bank credit to the commercial sector.
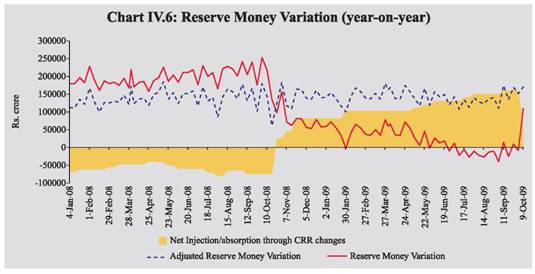
Reserve Money Survey IV.13 Growth in reserve money that remained low/negative during the 2009-10 up to the second week of October 2009 registered a growth of 12.2 per cent, y-o-y, as on October 16, 2009 as compared with a growth of 17.6 per cent a year ago. The significant acceleration in growth in reserve money in the week ended October 16, 2009 reflects the reduction in CRR by 250 basis points by the Reserve Bank effective from the fortnight beginning October 11, 2008 and consequent decline in bankers' deposits with the Reserve Bank. The reserve money growth as on October 16, 2009, therefore, is over a lower base that resulted from the reduction in CRR a year ago. Reserve Bank has reduced CRR by 400 basis points since October 2008 to augment domestic liquidity in view of the intensification of global financial crisis and its related impact on domestic markets. The movement in reserve money in the second quarter of 2009-10 was mainly driven by liquidity management operations of the Reserve Bank and variation in bankers' deposits with the Reserve Bank. The growth in reserve money has to be seen along with policy driven changes to the CRR, since the combined impact gets reflected in the growth of broad money. A reduction in CRR may lead to a corresponding fall in reserve money in the first round; the higher money multiplier resulting from lower CRR, however, will lead to higher growth in broad money, though with a lag. When the variation in reserve money reflects the result of a policy driven change in CRR, for the purpose of analytical comparison reserve money adjusted for CRR changes becomes more relevant. Adjusted for the first round effect of the changes in CRR, reserve money growth (y-o-y) as on October 16, 2009 was 19.5 per cent as compared with 22.8 per cent a year ago. The CRR impact explains the difference between 'reserve money' and 'adjusted reserve money' (Chart IV.6).
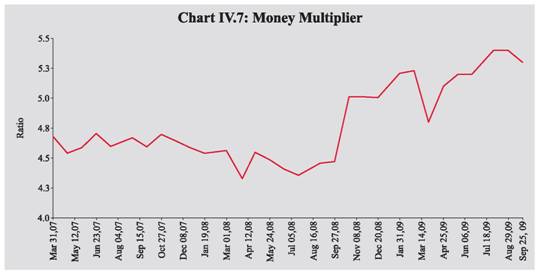
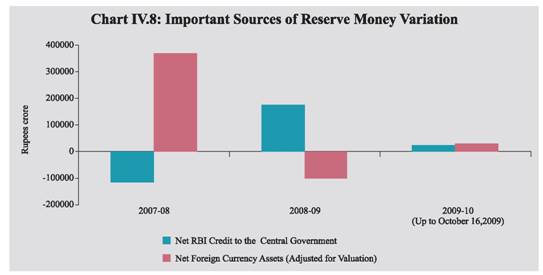
IV.14 The money multiplier, which had declined from 4.7 at end-March 2007 to 4.3 at end-March 2008 in the wake of CRR hikes, increased to 4.8 as on March 31, 2009 and 5.4 by end-July 2009, reflecting subsequent lowering of CRR by 400 basis points. The money multiplier at end-September 2009 was 5.3 (Chart IV.7). IV.15 Reserve money during the financial year 2009-10 (up to October 16, 2009) recorded a growth of 2.3 per cent as against a decline of 2.9 per cent in the corresponding period of the previous year (Table 4.7). On the sources side, both net Reserve Bank credit to the Centre and net foreign assets (adjusted for valuation) increased. Net Reserve Bank's credit to the Centre increased by Rs. 24,123 crore (up to October 16, 2009) as compared with an increase of Rs.15,534 crore during the corresponding period of the previous year. The Reserve Bank's foreign currency assets (adjusted for valuation) increased by Rs.31,150 crore as against a decrease of Rs.34,556 crore during the corresponding period of the previous year (Chart IV.8). Adjusted for the first round impact of the changes in CRR (up to October 16, 2009), reserve money expanded by 2.2 per cent as compared with an increase of 1.8 per cent during the corresponding period of the previous year. IV.16 Movements in the Reserve Bank's net credit to the Central Government during 2009-10 (up to October 16, 2009) largely reflected the liquidity management operations of the Reserve Bank and changes in Central Government deposits with the Reserve Bank. Liquidity condition eased from mid-November 2008, in response to the liquidity augmenting measures of the Reserve Bank and on an average, Reserve Bank started absorbing large amount of liquidity through reverse repo under the LAF. Accordingly, Reserve Bank's holding of government securities (up to October 16, 2009) declined on account of an increase in absorption under the LAF (Rs.74,775 crore). The Centre's surplus cash balances with the Reserve Bank also increased (Rs.45,124 crore). On the other hand, unwinding of MSS securities (Rs.69,304 crore) led to a decline in Central Government deposits with the Reserve Bank. Furthermore, net open market purchases under OMO/ special market operations (SMO) led to higher holding of Central Government securities/bonds (Rs.74,068 crore) by the Reserve Bank. Reflecting combined effect of these developments, the Reserve Bank's net credit to the Centre increased during 2009-10 (up to October 16, 2009).
IV.17 To sum up, the growth-supportive accommodative monetary policy stance was evident from sustained high growth in broad money notwithstanding the recent moderation, and also the daily absorption of excess liquidity in excess of Rs.1,00,000 crore on average throughout the second quarter of 2009-10. High growth in deposits on the component side and high growth in investment of the banking system in government securities in the wake of large market borrowing programme of the Government on the sources side have been the major drivers of growth in monetary aggregates. Moderation in non-food credit growth continued. Momentum in capital inflows and revival in demand for credit from the private sector could, however, alter the monetary conditions over time. |
|||||||||||||||||||||||||||||||||||||||||||||||||||||||||||||||||||||||||||||||||||||||||||||||||||||||||||||||||||||||||||||||||||||||||||||||||||||||||||||||||||||||||||||||||||||||||||||||||||||||||||||||||||||||||||||||||||||||||||||||||||||||||||||||||||||||||||||||||||||||||||||||||||||||||||||||||||||||||||||||||||||||||||||||||||||||||||||||||||||||||||||||||||||||||||||||||||||||||||||||||||||||||||||||||||||||||||||||||||||||||||||||||||||||||||||||||||||||||||||||||||||||||||||||||||||||||||||||||||||||||||||||||||||||||||||||||||||||||||||||||||||||||||||||||||||||||||||||||||||||||||||||||||||||||||||||||||||||||||||||||||||||||||||||||||||||||||||||||||||||||||||||||||||||||||||||||||||||||||||||||||||||||||||||||||||||||||||||||||||||||||||||||||||||||||||||||||||||||||||||||||||||||||||||||||||||||||||||||||||||||||||||||||||||||||||||||||||||||||||||||||||||||||||||||||||||||||||||||||||||||||||||||||||||||||||||||||||||||||||||||||||||||||||||||||||||||||||||||||||||


