 IST,
IST,


State of the Economy (Revised)
|
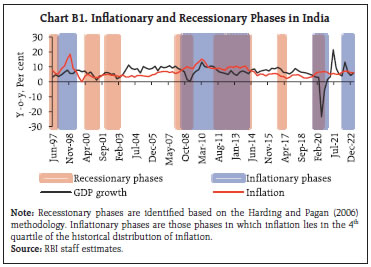
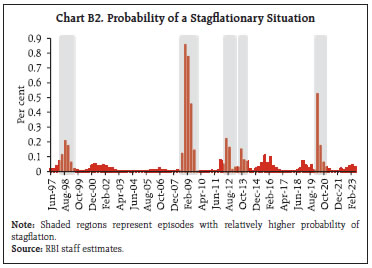
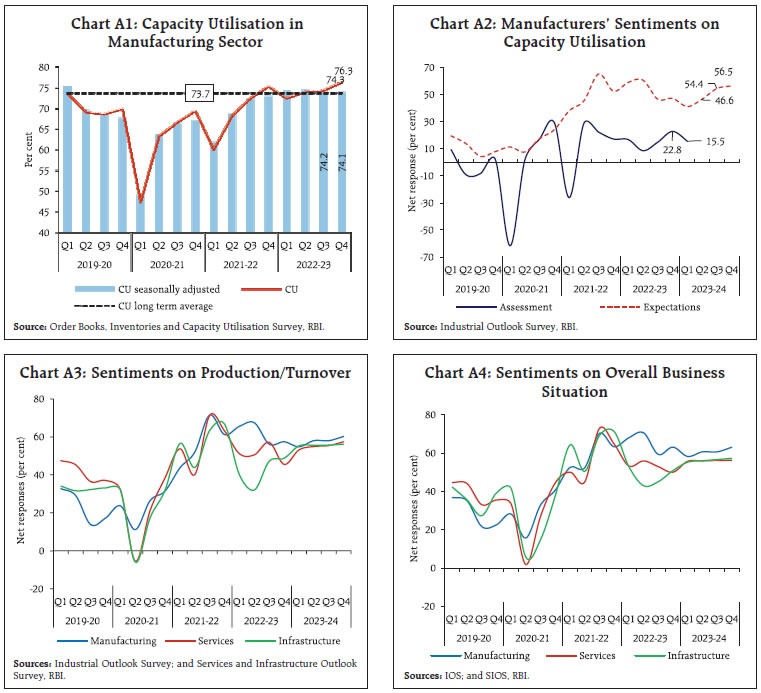
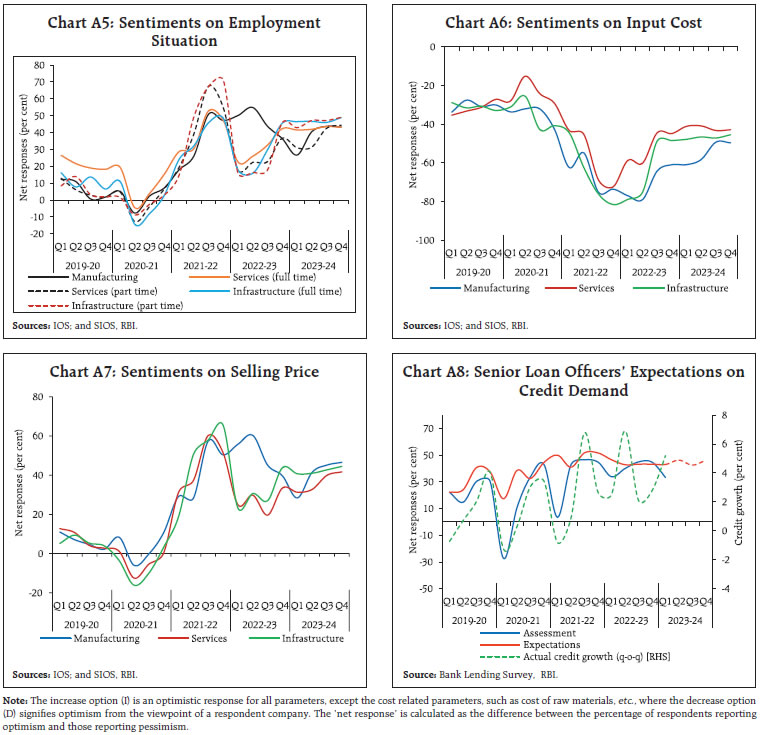
With industrial production and trade weakening, the global recovery is slowing after a robust first quarter performance. In this stressed global environment, the Indian economy is gathering momentum in the second quarter of 2023-24. Domestic drivers such as private consumption and fixed investment are offsetting the drag from the contraction in exports. The uptick in inflation in its June reading mutated in July, with the unprecedented shock to tomato prices spilling over to prices of other vegetables. While core inflation witnessed a moderation, headline inflation is expected to average well above 6 per cent in the second quarter. Introduction Global financial markets, which were settling after being stirred up and turning volatile in the wake of the failure of some banks and the debt ceiling imbroglio in the US, were seared by the US sovereign credit rating downgrade in early August. A pall of risk aversion hangs over investor sentiment. This unexpected development overwhelmed recent data arrivals that seemed to suggest that the global economy could avoid a hard landing, including an upward revision in global growth for 2023 in the International Monetary Fund’s (IMF’s) update of the world economic outlook (WEO) released at the end of July. The US treasuries and the US dollar emerged as safe havens in the tumult of capital fleeing risky assets. Stocks slumped into the red across the Asia-Pacific, including in India, and fear gauges such as the volatility index (VIX) spiked. In one view, “we’re experiencing a slow-motion fiscal train wreck, not a soft landing, and it’s draining global capital and endangering the dollar.”1 The opposing view is that the decision to downgrade the US is “bizarre and inept”2, and “puzzling in light of the economic strength of the US”.3 Bond yields were also lifted by the easing of the Bank of Japan’s yield curve control policy in response to inflation at a four-decade high. Investors tested its tolerance for higher yields and markets braced up for the possible return of Japanese investors who own over US$ 1 trillion in US treasuries and want to avoid hedging costs. Overall, the sense is that the global growth is slowing after a robust first quarter performance. Industrial production and trade are both showing weaknesses, reflecting the slowdown in global demand as well as a shift towards domestic services as trade barriers spring up and bite. Geopolitical risks and difficult financial conditions are deterring investment. The demand swing towards services is starting to taper, limiting the boost to growth it had given in preceding quarters. Manufacturing is slowing or contracting across major advanced economies (AEs) and is being pulled down in emerging market economies (EMEs) as well. Accordingly, the IMF in its July 2023 WEO update indicates that “high-frequency indicators for the second quarter point to a broader slowdown in activity”. Underlying this shift in gears in the trajectory of the global economy, divergences among countries and regions are becoming starker as growth impulses got stronger on both sides of the Atlantic and China slipped into deflation. Strengthening domestic investment is expected to push up growth in India. In the EME world, the recent global shocks and spillovers have produced varied outcomes. Some of the constituents have forcefully tightened monetary policy to press down inflation; others have been less aggressive while building up foreign exchange reserves.4 Some have turned to domestic markets to raise resources for longer maturities. They exorcise the original sin5 of borrowing in foreign currency and hence currency risk, but expose themselves to duration risk that tends to amplify market disruptions by increasing the sensitivity of the domestic yield curve to global financial conditions.6 Among those that continue to borrow in foreign currency, bonds issued by countries with credit ratings of triple C and below have delivered an average total return of 27 per cent since the start of 2023. Meanwhile, countries deadlocked in debt distress are making progress in negotiating financial support with the IMF and are pulling back from the brink of default. The upheavals in commodity markets have also separated the fortunes of exporters and importers, and terms of trade have swung both ways. Taken together, however, there is a rising narrative about EMEs’ economic resilience. Although financial markets continue to play on the AE-EME dichotomy while chasing returns or bolting from risk, there is a view gathering currency that the EME label should be retired.7 Inflation data for July 2023 that have been released in the first half of August indicate that the genie of inflation is still out of the bottle – upticks have flattered to deceive the good feeling of moderation that had just started to set in during May and June. This reversal has endorsed hawkish stances of central banks and strengthened their disinflationary resolve. Core inflation is moderating after a prolonged persistence. The easing of supply chain pressures and slower than anticipated growth in wages are creating conditions for core inflation to soften further, although here too, countries are at different points of the curve. As geopolitical strife intensifies, however, prices of agricultural commodities, metals and energy have picked up steam, bringing back the spectre of food and energy insecurity and potential spillovers to core inflation. The IMF estimates that global headline inflation may yield by close to 2 percentage points in 2023 from a year ago, but this is predicated on declining international commodity prices which is now imperilled. Core inflation is expected to ease by 0.5 percentage points, but about half of the economies are expected to see no decline in core inflation in 2023. Overall, inflation is projected to remain above target in 2023 in 96 per cent of economies with inflation targets. The international inflation environment is rendered fragile again. The question is: will central banks plod on with tightening monetary policy even as the global economy loses momentum? So far, most AEs have raised their policy rates by 25 basis points in their latest meeting while most EMEs kept their policy rates on hold. July 2023 turned out to be the earth’s hottest month on record, with the global average temperature at 16.95 degrees Celsius, a third higher than the previous record set in 2019. Dire consequences have followed, with deadly heat waves in North America, Europe and Asia. El Nino conditions are expected to fully emerge in the second half of the year; such events are typically associated with release of energy from the oceans to the atmosphere and an increase in the overall global surface temperature. So, even warmer months are expected to follow right into early 2024. In our part of the world, the connection between rising global temperature and heavier and uneven monsoons is becoming stronger and extreme rain events are likely to increase. It is in this context that it has been said: “the era of global warming has ended; the era of global boiling has arrived.”8 Where heat waves lead, food inflation will follow as harvests will likely become smaller, and crop yields, dairy production and soil moisture content lower. As we said in the Report on Currency and Finance for the year 2022-23, the climate is striking back. In this stressed global environment, the Indian economy appears poised to regain momentum (on a quarter-on-quarter basis) in the second quarter of 2023-24 after a dip that typically characterises the first quarter. High frequency indicators for July discussed in later sections provide the foundations for our view that this pick-up in momentum should counterbalance unfavourable base effects. The indicators are mostly in the green (Table 1), i.e., in acceleration, that is being driven by domestic drivers such as private consumption and fixed investment, offsetting the drag from the contraction in exports. In a reflection of consumer demand conditions, sales of daily essentials and groceries recorded a sequential recovery in July, with an uptick in rural areas. Home care and packaged food have also gained upside. In urban areas, the revenue growth of fast moving consumer goods (FMCG) has been boosted by digital demand and sales through e commerce. In terms of the supply response, there is a catch-up underway in farm activity as the monsoon spreads out across the country and especially into the hitherto deficient east and north-east. Survey-based indicators point to industry reviving, led by manufacturing. The RBI’s industrial outlook survey polled improved investment sentiment, with demand conditions assessed to improve across sectors and likely to be sustained over the next three quarters. Respondents expressed optimism about the easing of input cost pressures across sectors, although wages are expected to increase in the second quarter. Selling prices are expected to rise and push up profit margins. There is an underlying confidence that employment conditions and the overall business situation will remain upbeat till the end of the year (Annex 1). An important development that is likely to have a bearing on the national accounts for the first quarter of 2023-24 that will be released at the end of August is the strong but skewed – i.e., tilted towards large companies in a few sectors - improvement in corporate profitability, despite flattening of revenues, except for the consumer goods sector. The key to rising bottom lines is the decline in input costs across several sectors. Downstream oil and gas companies recorded a surge in profits, with the decline in crude oil prices resulting in higher marketing margins. Excluding chemicals and some metal sector related companies, corporates in most other sectors also reported a growth in profitability. This included information technology (IT) companies although sharp downward revisions in forward revenue guidance weighed on sentiment. In contrast to other sectors, auto companies, including two and four-wheeler passenger vehicles and commercial vehicle producers, saw profits being driven up by expansion in sales volume. The construction as well as construction materials and capital goods sector companies also registered sharp business growth, reflective of the underlying strength of domestic demand conditions. Chemicals sector companies, however, faced headwinds during the quarter in the face of subdued demand and pricing pressures in various segments. Banking and financial sector companies registered another quarter of stellar performance on the back of robust demand conditions and stable asset quality. Treasury incomes rose strongly due to a pullback in bond yields, allowing them to grow their core net interest income and other income. The profit surge has been led by public sector banks. In turn, profitability is boosting equity valuations of all listed corporates. 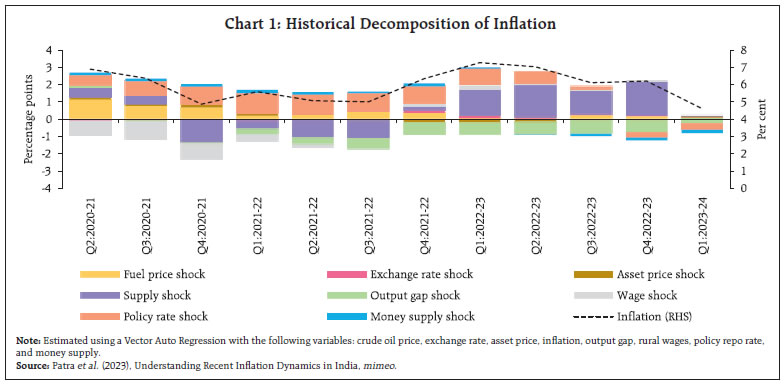 Inflation fell from its peak of 7.3 per cent in Q1:2022-23 to 4.6 per cent in Q1:2023-24. This 270 basis points (bps) decline in inflation was mainly due to the waning of supply shocks. The impact of monetary policy actions is gathering potency, accounting for around 130 bps of the decline of inflation. The contributions of other factors more or less offset each other (Chart 1). The uptick in inflation in its June reading mutated in July, with the unprecedented shock to tomato prices spilling over to prices of other vegetables. In the event, headline inflation surged to a 15-month high in July, exacerbated by a month-on-month (m-o-m) increase of 4.3 per cent in electricity prices. Notably, however, core inflation eased in July, extending a softening bias that set in from February 2023. The incidence of supply shocks is not over - elevation in vegetable prices has extended into the first half of August. Accordingly, headline inflation is expected to average well above 6 per cent in the second quarter. The vulnerability of the economy to recurring incidence of vegetable price shocks, especially ahead of and during the monsoon, warrants major reforms in perishable supply chains covering transportation networks, warehousing and storage technologies, and value addition processes that damp the amplitude of these swings. Stable prices for consumers, assured supplies and remunerative proceeds for farmers will follow when these reforms lead to efficiency and productivity gains while preserving the quality of output and building up insulation against food inflation from climatic events. The shadow of El Nino looms over the second half of the year and the outcome for food inflation in the rabi season. Yet another upside risk is the outlook on crude oil prices that is marred by ‘engineered’ supply shortfalls.9 There is a diminishing probability of crude price pressures easing over the rest of the year. This bodes ill for net energy importers like India. It is heartening to note that demand restraint exercised by monetary policy and supply augmenting measures are offsetting these price pressures considerably. In the absence of these policy responses, the inflation outlook would have been far more adverse. The commitment to remain anti-inflationary should quell threats to macroeconomic stability and help anchor expectations. In fact, households expect inflation to edge down over the year ahead. This is also reflected in the latest round of the consumer confidence survey with regard to the price situation. On balance, our assessment of the Indian economy in terms of its position in the business cycle is that the slack imposed by the pandemic has been pulled in. The output gap, which was mostly negative since the fourth quarter of 2019-20 has turned positive during January-March 2023 (Chart 2). Investors are ebullient about India’s growth prospects at a time when the rest of the world is slowing down. They look at industrials, financials and consumer discretionary stocks as major beneficiaries of India’s ongoing structural transformation.10 Credit raters are watching India as it sets ambitious targets for itself and for the world under its G20 presidency.11 The challenge in the decade ahead will be to achieve sustained high, stable and inclusive growth, the core of the G20’s vision. The global south will be watching as India balances the goals of achieving high growth and reducing the carbon intensity as it aspires to become a global manufacturing hub while harnessing the power of its demographic dividend and digital revolution. In the words of Shri Shaktikanta Das, Governor, RBI, “India is uniquely placed to benefit from the ongoing transformational shifts in global economy in the wake of geopolitical realignments and technological innovations. A large economy marching ahead with vast domestic demand, untapped resources and demographic advantages, India can become the new growth engine for the world” (Governors’ Statement, August 10, 2023). 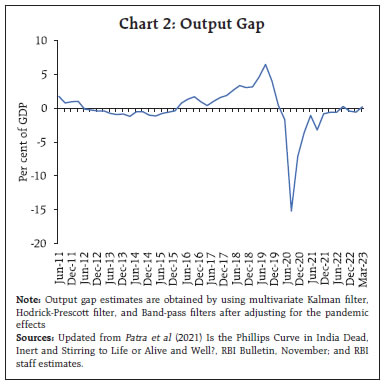 Global Setting Global growth was restrained by lacklustre activity in manufacturing and trade in Q2:2023 although the performance of the services sector remained resilient. The cumulative effects of monetary policy tightening are beginning to show up in credit and labour market conditions across advanced economies (AEs). Recession probabilities for the US rose to their highest in June 2023 since 2021 (Chart 3). 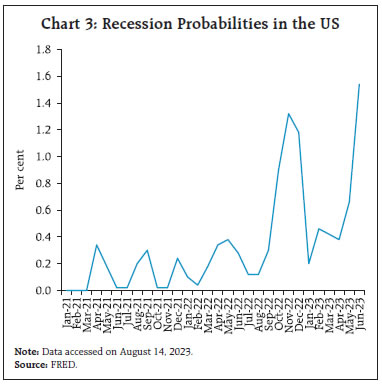 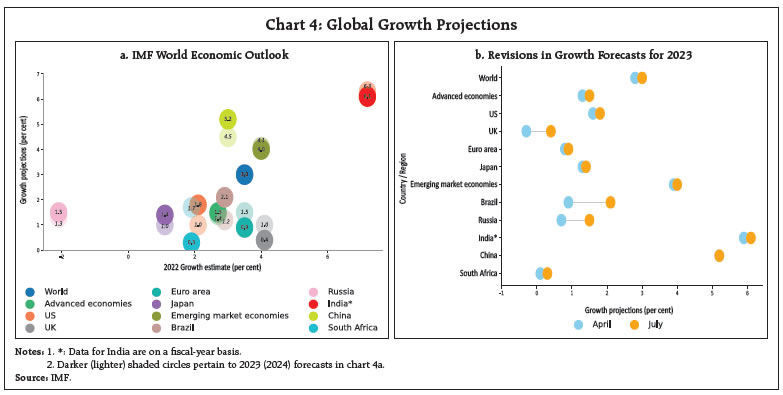 In its July 2023 update of the World Economic Outlook (WEO), the International Monetary Fund (IMF) revised its global growth forecast for 2023 marginally upwards to 3.0 per cent from its April projection of 2.8 per cent (Chart 4a). Much of the revision was in the AE group (0.2 percentage points), following better than expected H1:2023 performance (Chart 4b). Global growth for 2023 is, nonetheless, expected to trail below its 2022 level (3.5 per cent) as well as historical (2000-19) average of 3.8 per cent. Incoming data across geographies point towards a mixed picture. GDP growth in the US, the UK and the Euro area accelerated in Q2:2023, although in the case of the latter, Germany’s economy stagnated and Italy unexpectedly experienced a contraction. In China, GDP growth decelerated sharply in Q2 as pent-up demand waned after the rebound in late 2022. Our model-based nowcast for global GDP growth points towards a positive momentum in Q2:2023 (Chart 5). The global composite purchasing managers’ index (PMI) – a high frequency indicator of global economic activity – declined to its lowest reading since January 2023 (Chart 6a). The global services PMI moderated sequentially for the second consecutive month, although it remained in the expansionary zone. Financial services, barring banks and real estate bucked the trend, however, and registered robust activity. On the other hand, the global manufacturing PMI’s downturn persisted in July as output and new orders fell at faster rates, particularly in the basic materials and construction sector. Global supply chain pressures remained below historical averages despite a sequential pick-up in June and July (Chart 6b). 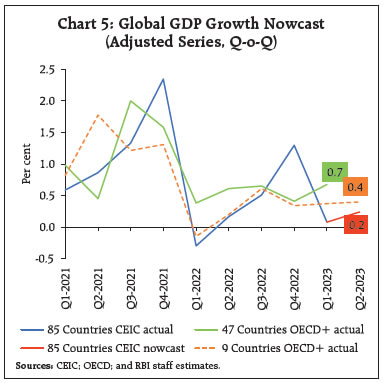 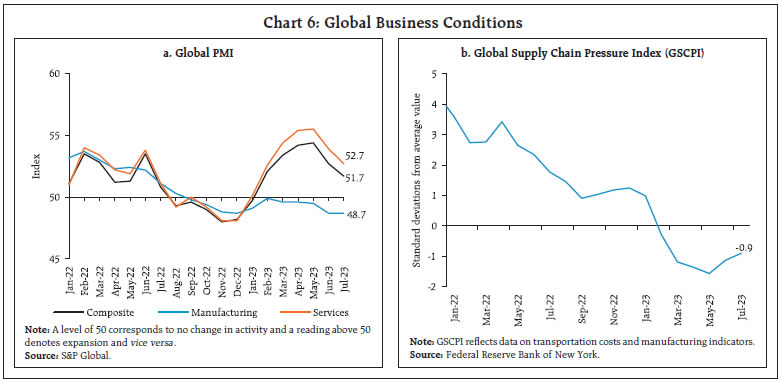 In its latest release on August 8, 2023, the United Nations Conference on Trade and Development (UNCTAD) revised its nowcast of merchandise trade volume downwards; world trade growth is nowcast at 0.47 per cent for Q3:2023, up from 0.19 per cent in Q2:2023 (Chart 7). The growth in services trade is nowcast at 1.78 per cent for Q2:2023 and 0.65 per cent for Q3:2023. Global commodity prices hardened in July (Chart 8a). Brent crude oil prices rose sharply in July to an average of US$ 80.1 per barrel from US$ 74.9 per barrel in June, driven by a sharp drop in US crude oil stocks and deeper supply cuts12 from OPEC+ (Chart 8b). Gold prices marginally rose in July as weaker than expected US jobs pushed the US dollar and Treasury yields lower; subsequently, however, gold prices moderated as the US dollar strengthened in early August (Chart 8c). Prices of food grains surged after Russia pulled out of the Black Sea Grain deal but retreated from end-July. The Food and Agriculture Organization (FAO) food price index increased by 1.3 per cent (m-o-m) in July due to a sharp rise in prices of vegetable oils, partially offset by a decline in the prices of sugar, cereals, dairy and meat (Chart 8d). 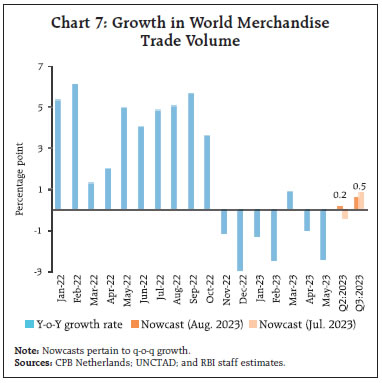 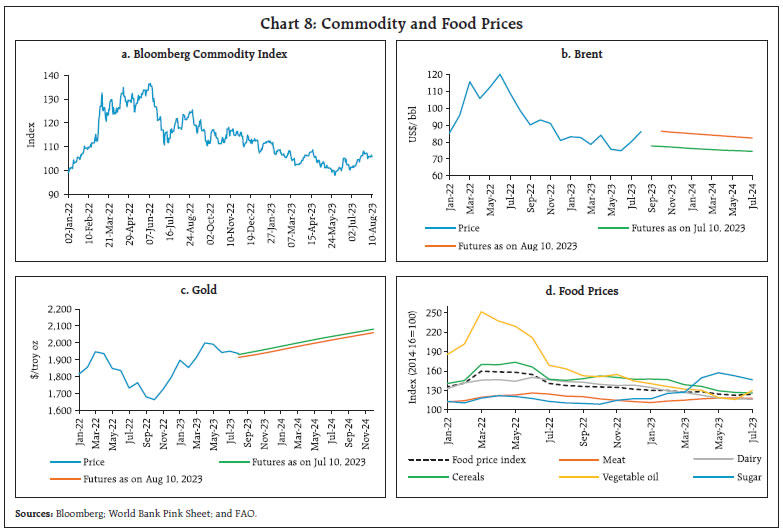 Headline inflation moderated across most economies. As per flash estimates, inflation in the Euro area further moderated to 5.3 per cent in July 2023, its lowest level since January 2022 (Chart 9a). In the US, CPI inflation edged up to 3.2 per cent in July from 3.0 per cent last month. Inflation based on the personal consumption expenditure (PCE) index also stood at 3.0 per cent in June 2023, the lowest reading since April 2021. In the UK, CPI inflation eased to 7.9 per cent in June while Japan’s CPI (all items less fresh food) inflation edged up marginally to 3.3 per cent in June (3.2 per cent in May). Among the EMEs, inflation edged up sharply in Brazil and Russia in July, while China registered a deflation of 0.3 per cent. Inflation in South Africa moderated in June (Chart 9b). Core and services inflation are exhibiting incipient signs of moderation but continue to remain above the headline in most regions (Chart 9c and 9d). Global equity indices edged up in July with gains across AEs and EMEs as investors priced in improving prospects of a soft landing due to lower than expected inflation prints (Chart 10a). Bond yields hardened following the policy rate hike by the US Federal Reserve and a hawkish policy stance. Yield curve inversion in the US has continued for a year now (Chart 10b). In early August, global stocks declined while treasury yields edged up following an announcement of large debt issuance by the US Treasury. This was exacerbated with the Fitch Ratings’ downgrading the long-term foreign currency issuer default rating for the US. Yields softened after non-farm payroll data released on August 4 showed signs of the labour market cooling. Also, ratings agency Moody’s downgraded the credit ratings of 10 small and midsized banks in the US on August 7 which led to a fall in banking stocks and broader stock market indices. 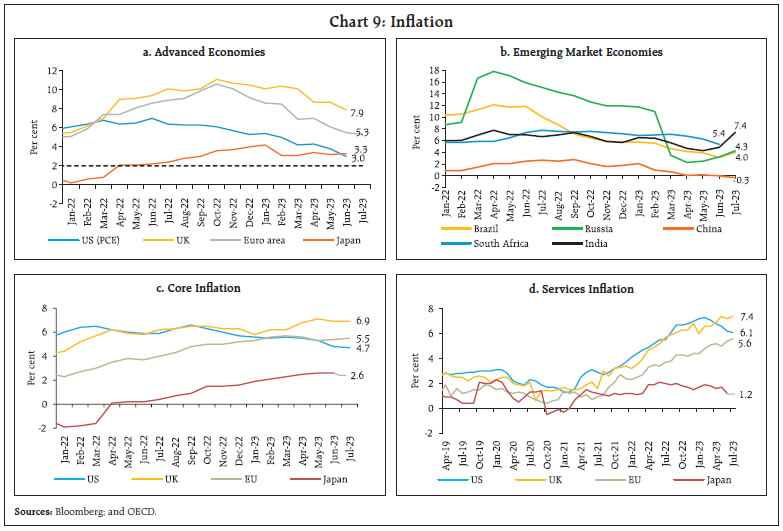 In the currency markets, the US dollar depreciated in July by around 1.6 per cent, touching a 15-month low in mid-July on expectations of an early end to monetary policy tightening. Towards end-July, however, the US dollar recouped some of its losses after better than expected US economic data defied investors’ expectations about the policy rate hike cycle ending. In early August, the US dollar appreciated on fresh concerns about the US banking sector and economic uncertainties in China which drove up safe-haven demand for the currency. Concomitantly, the Morgan Stanley Capital International (MSCI) currency index for EMEs gained marginally in July and capital flows to EMEs remained positive (Chart 10c and 10d). The MSCI currency index for EMEs declined in early August due to capital outflows. Financial conditions have come under pressure, especially in the Euro area, driven by credit tightening (Chart 11a). Weakness in the global housing sector amidst rising interest rates is also exacerbating financial conditions (Chart 11b). Among the major AE central banks, the US Federal Open Market Committee (FOMC), the European Central Bank (ECB) and the Bank of Canada raised their policy rates by 25 bps each in July, and the Bank of England raised its key rate by 25 bps in August (Chart 12a). The Bank of Japan maintained its policy rate at (-) 0.1 per cent in August but amended its conduct of yield curve control (YCC) to incorporate greater flexibility in the range of yield movement. 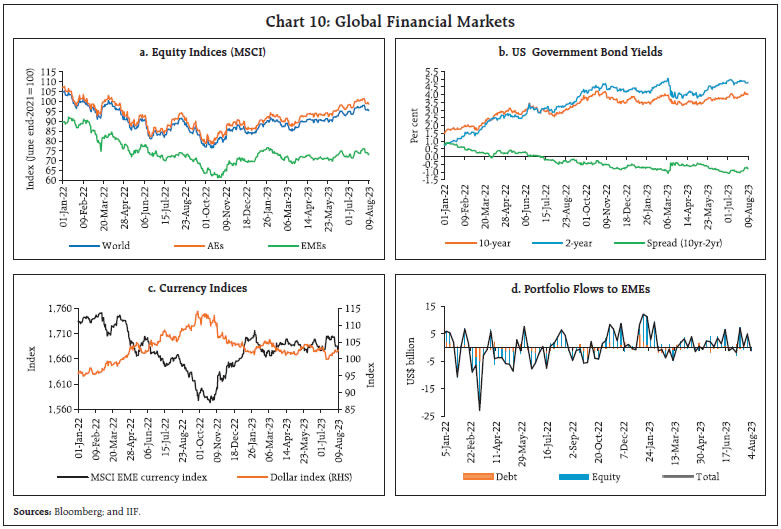 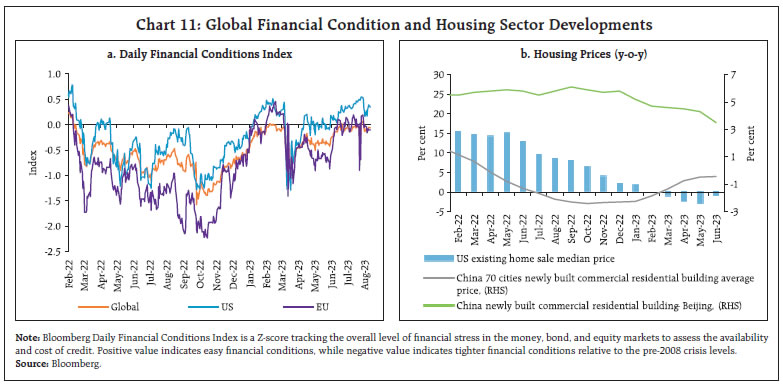 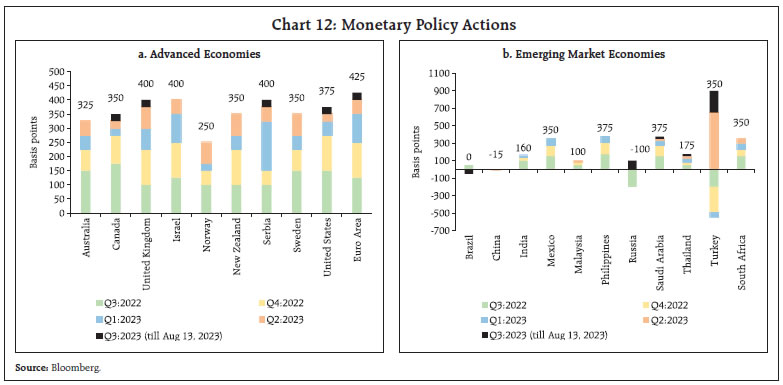 Within the few EME central banks which changed their policy rates, the Bank of Russia and the Central Bank of Turkey raised their policy rates by 100 bps and 250 bps, respectively, in July. Banco Central do Brasil (Brazil), however, cut its policy rate by 50 bps in August (Chart 12b). While the Bank of Russia in an emergency meeting in August hiked their policy rate further by 350 bps. People’s Bank of China cuts its medium term lending facility (MTF) by 15 bps and short term funding rates by 10 bps in August. III. Domestic Developments In its July 2023 update referred to earlier, the IMF revised India’s growth upwards to 6.1 per cent for 2023-24. We maintain our view13 that this projection may be surprised on the upside even with this upgrade. The index of supply chain pressure for India (ISPI), remains below its historical average, supporting growth impulses (Chart 13a). As alluded above, business sentiments remain positive about robust demand conditions (Annex 1). Over the year ahead, consumer confidence remains strong (Chart 13b). Our economic activity index (EAI) nowcasts GDP growth for Q1:2023-24 at 7.8 per cent (Chart 13c and 13d). Aggregate Demand Among lead indicators of demand conditions, E-way bill volumes registered a sequential pick up in July with a strong double digit y-o-y growth, indicating robust trade activity (Chart 14a). Toll collections remained higher than a year ago, albeit with a sequential moderation due to lower mobility with the onset of the south-west monsoon (SWM) [Chart 14b]. Automobile sales recorded a y-o-y contraction of (-) 3.9 per cent in July 2023 (Chart 15a). Except for three-wheelers, sales moderated in all the major categories (Chart 15b). Two-wheeler sales, which account for more than three-fourth of total sales, were dragged down by motorcycles sales and contracted for the first time in sixteen months. Passenger vehicles recorded their highest ever sales for the month of July, driven by increased demand for sports utility vehicles (SUVs). Vehicle registrations moderated sequentially, although they maintained a strong y-o-y growth of 9.8 per cent (Chart 15c). The daily average consumption of petroleum products declined by 9.4 per cent m-o-m in July due to lower demand for transportation fuels on account of reduced mobility during monsoons (Chart 15d). 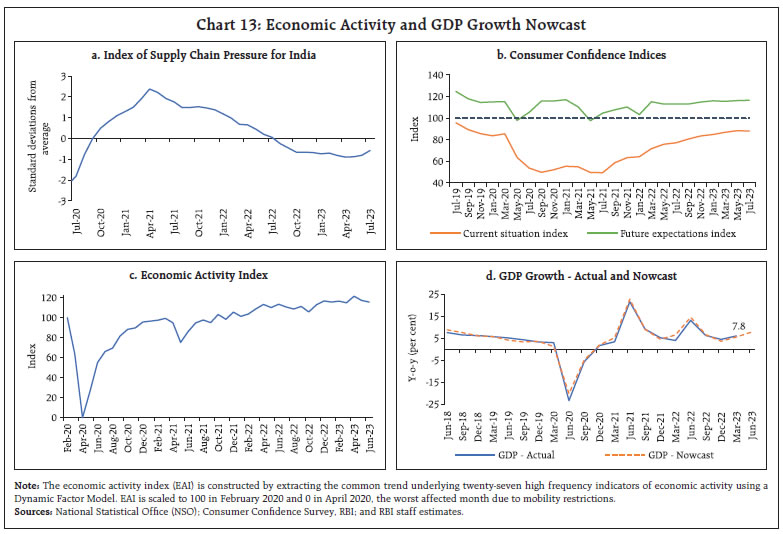 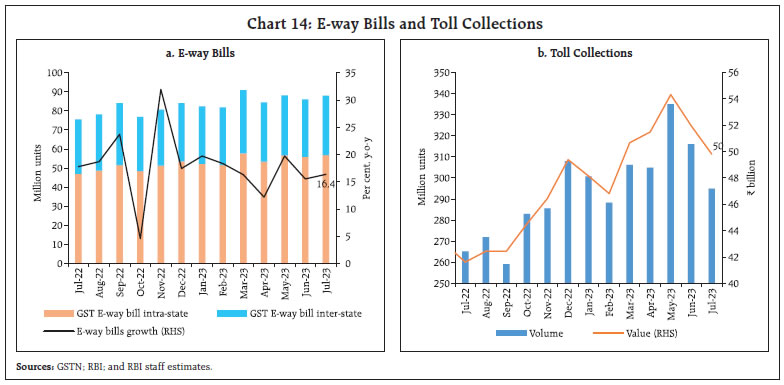 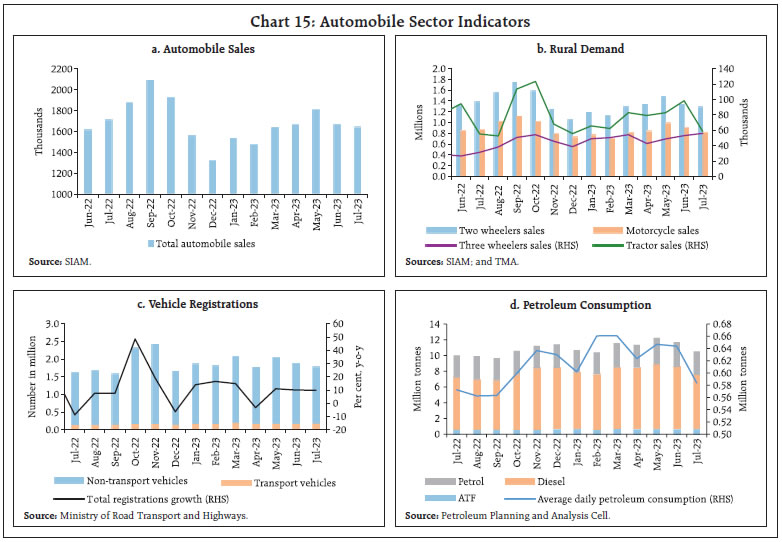 Sales of FMCG improved sequentially in July14 as retailers prepared for the upcoming festival season.15 The all-India unemployment rate (UR)16 fell to 7.95 per cent in July 2023 on account of lower UR in rural areas (Chart 16a). Both the labour force participation rate and the employment rate recorded a marginal decline in July, led by a fall in employment in the services sector (Chart 16b). The employment outlook in the organised sector, as polled by the PMI for manufacturing and services, remained in the expansionary zone (Chart 17). The demand for work under the Mahatma Gandhi National Rural Employment Guarantee Scheme (MGNREGS) went into a decline in July by 30.3 per cent (m-o-m), as kharif sowing operations picked up (Chart 18). Despite the sequential fall, it recorded a y-o-y growth of 15.2 per cent. India’s merchandise exports registered contraction for the sixth consecutive month in July 2023, declining by 15.9 per cent (y-o-y) due to negative momentum (Chart 19). The contraction in exports was broad-based, with more than two-third of the export basket (19 out of 30 major commodities) registering a y-o-y decline. 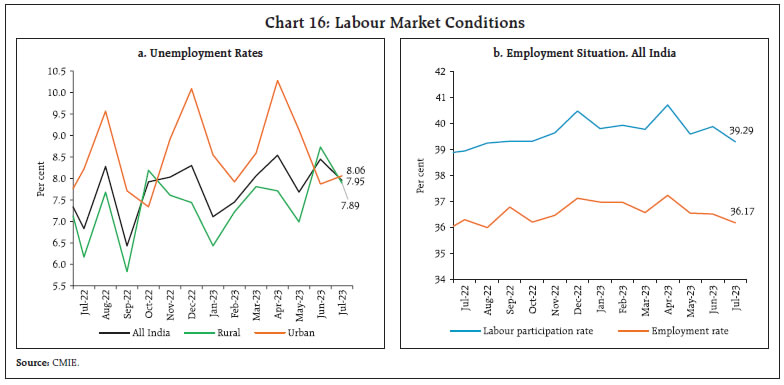 The largest drag on exports was from petroleum exports, which fell to an 18-month low of US$ 4.6 billion and registered a y-o-y contraction of 43.7 per cent – the fifth consecutive month of decline. Gems and jewellery and engineering goods were the other major drags. Electronic goods, iron ore, ceramic products and glassware contributed positively to overall export growth during the month (Chart 20). Notably, rice also had a positive contribution to export growth in July 2023. 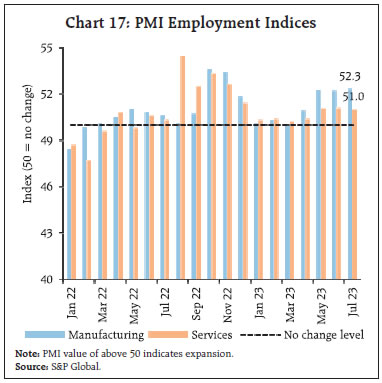 Trade restrictions on rice exports in September 2022 included prohibition of exports of broken rice and a 20 per cent cess on exports of all other rice varieties except parboiled and basmati. Despite the imposition of the duty, exports of non-basmati white rice continued to increase. This category accounted for 20.8 per cent of India’s rice exports by value during September 2022 to June 2023 (Chart 21a). To increase the domestic availability and contain inflation, exports of non-basmati white rice were prohibited with effect from July 20, 2023. Globally, prices of this variety surged after the export ban (Chart 21b). India remained the world’s largest rice exporter, with its share in global exports increasing from 35.7 per cent in 2021 to 36.8 per cent in 2022. 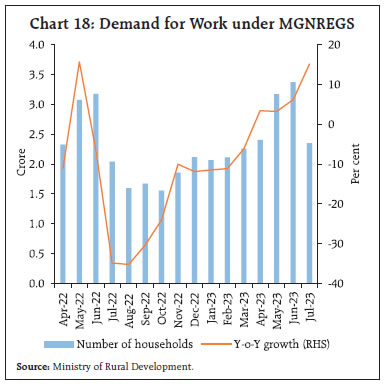 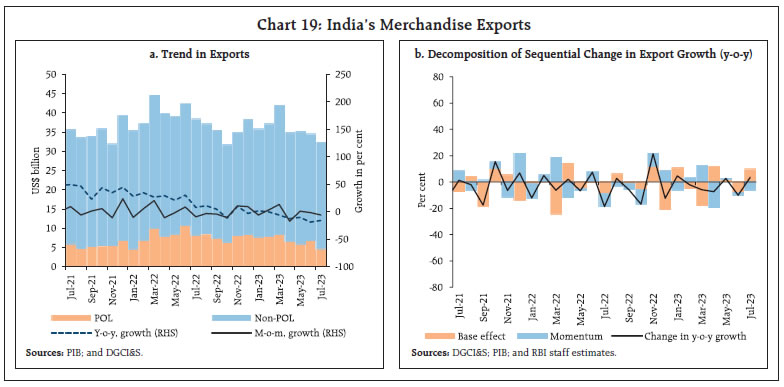 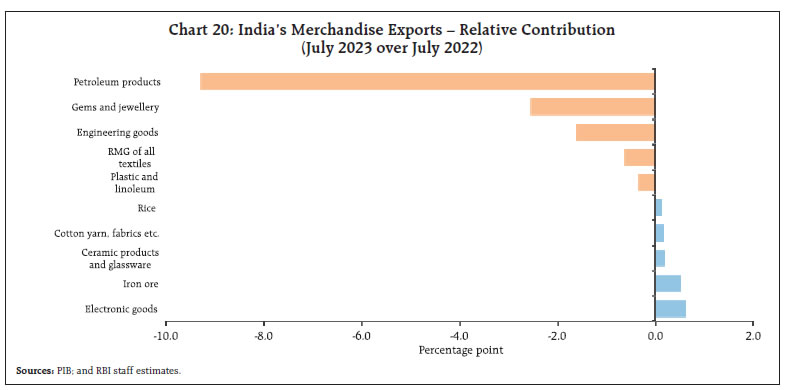 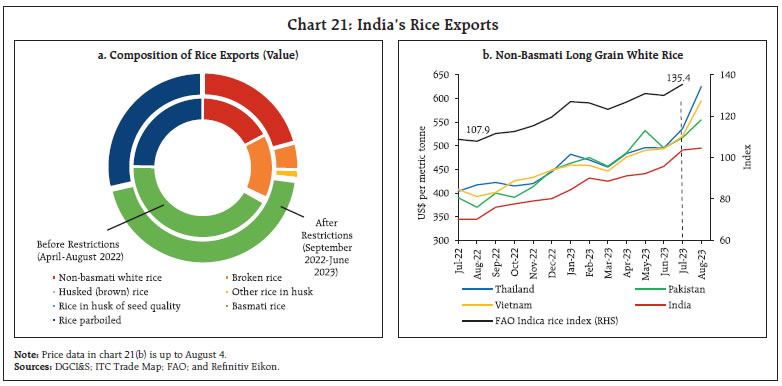 Merchandise imports at US$ 52.9 billion declined by 17.0 per cent (y-o-y) in July 2023, the seventh consecutive month of contraction (Chart 22), with 48 per cent of the import basket (16 out of 30 major commodities) declining on a y-o-y basis. Petroleum, oil and lubricants (POL), coal, pearls, precious and semi-precious stones were the main items that dragged imports down while gold, electronic goods, and machinery contributed positively in July 2023 (Chart 23). In the electronics segment, India has announced licensing requirements for import of laptops, tablets, all-in-one personal computers and ultra-small computers and servers with effect from November 1, 2023. The restricted items constitute around 10 per cent of India’s electronic imports (Chart 24). 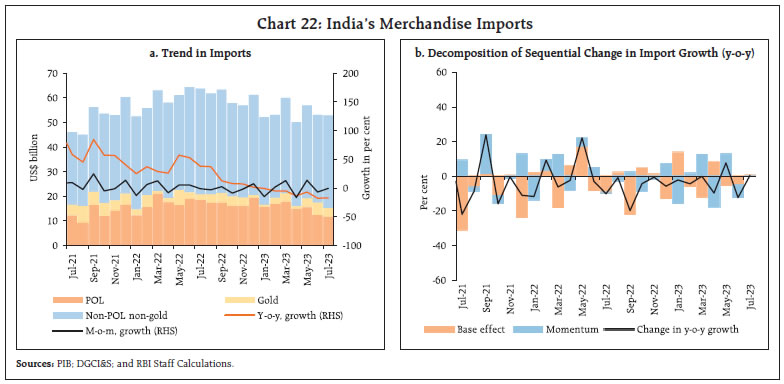 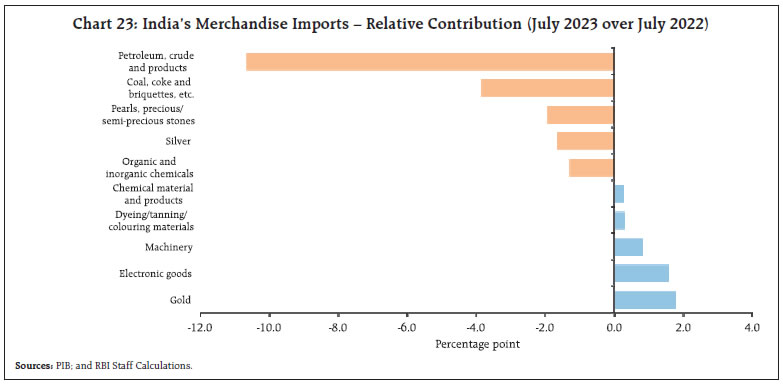 With both exports and imports declining, the merchandise trade deficit in July increased by US$ 1.9 billion on a sequential basis to US$ 20.7 billion. The oil deficit also widened sequentially and accounted for more than a third of the overall merchandise trade deficit in July (Chart 25). 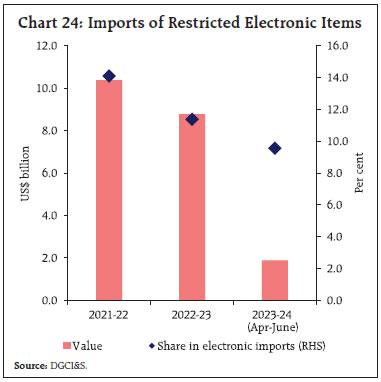 During April-July 2023, India’s merchandise exports at US$ 136.2 billion contracted by 14.5 per cent (y-o-y). The decline in exports was primarily led by petroleum products, gems and jewellery and engineering goods, while electronic goods, iron ore and drugs and pharmaceuticals contributed positively during April-July 2023. The merchandise imports at US$ 213.2 billion declined by 13.8 per cent (y-o-y) during April-July 2023. POL, coal, pearls, precious and semi-precious stones contributed negatively to import growth during April-July 2023, whereas gold, electronic goods and machinery supported import growth during this period. Higher contraction in imports than exports led to merchandise trade deficit narrowing to US$ 77.0 billion during April-July 2023 compared to US$ 88.0 billion during the corresponding period a year ago. Petroleum products continue to be major source of trade deficit, followed by electronic goods in 2023-24 so far (Chart 26a). Following the pattern of 2022-23, China and Russia are major sources of trade deficit in 2023-24 also (Chart 26b). 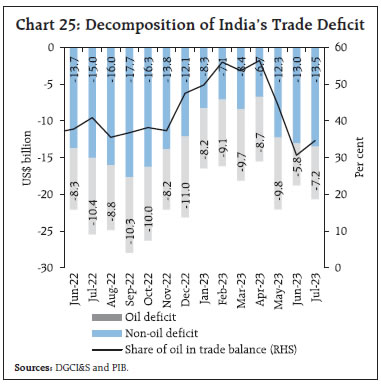 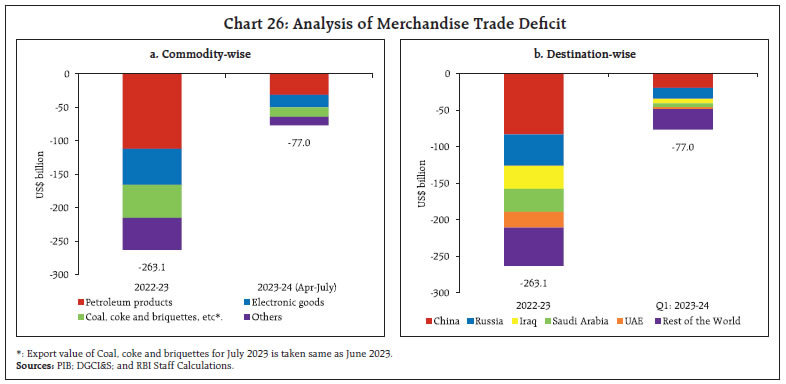 As per the Controller General of Accounts (CGA), the gross fiscal deficit (GFD) of the Central government during Q1:2023-24 stood at 25.3 per cent of the budget estimates (BE) for 2023-24, higher than 21.2 per cent of BE during the corresponding period of 2022-23. This is attributable to an increase in capital expenditure by 59.1 per cent (y-o-y) while revenue expenditure growth remained flat, and total expenditure increased by 10.8 per cent (y-o-y). Capital outlay recorded an increase of 45.3 per cent resulting in a marked improvement in the quality of spending (Chart 27). On the receipts side, direct tax collections contracted by 1.8 per cent (y-o-y) owing to a 13.9 per cent decline in corporate tax collections, while income tax receipts recorded a growth of 11.0 per cent. Indirect tax collections grew by 8.8 per cent (y-o-y), the growth in goods and services tax (GST) and customs revenues outweighing the contraction in excise duties.17 While gross tax revenue grew by 3.3 per cent (y-o-y), net tax revenue contracted by 14.3 per cent due to higher tax devolution to State governments18 with the release of one advance instalment of tax devolution to States in June 2023 to enable them to expedite capital spending (Chart 28). 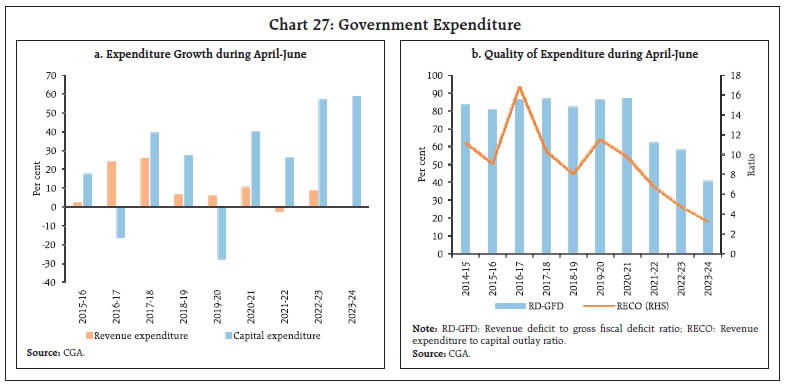 Non-tax revenue collection grew by 149.3 per cent (y-o-y) on account of more than budgeted surplus transfer from the Reserve Bank19, compensating for sub-par tax collections and non-debt capital receipts20 (Chart 29). Consequently, total receipts recorded a growth of 0.5 per cent on a y-o-y basis. 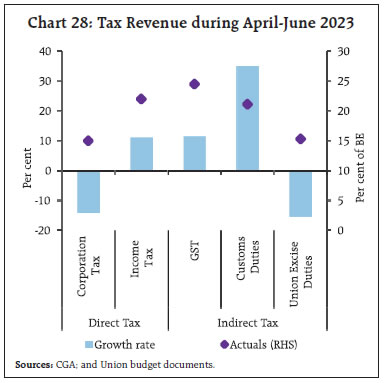 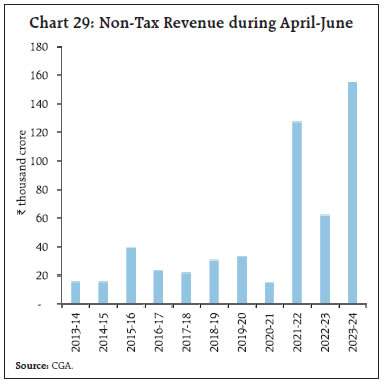 GST collections (Centre plus States) grew by 10.8 per cent (y-o-y) to record ₹1.65 lakh crore in July 2023, the third highest monthly collection since the inception of GST in July 2017. The average monthly gross GST collection during April-July 2023-24 stood at ₹1.68 lakh crore, up from ₹1.51 lakh crore during the same period of the previous fiscal year. Key fiscal indicators of States21 improved during Q1:2023-24 (Chart 30a). A slower growth in revenue expenditure vis-à-vis revenue receipts resulted in a surplus in the revenue account (Chart 30b). The capital expenditure of states increased by 74.4 per cent during Q1:2023-24, aided by the Union Government’s ‘Scheme for Special Assistance to States for Capital Investment’. By July 25, 2023 the Union government had approved expenditure amounting to ₹84,884 crore (accounting for 65.3 per cent of the ₹1.3 lakh crore budgeted for 2023-24) under the scheme, out of which ₹29,518 crore has already been disbursed to the States. Aggregate Supply The south-west monsoon (SWM), recovered from high deficiency in early June 2023 – the cumulative rainfall reached 99 per cent of the long period average (LPA) as on August 11, 2023.22 The production weighted rainfall index23 (PRN) was 2 per cent below the LPA (Chart 31). Nevertheless, uneven spatial distribution of rainfall persists as the eastern and north-eastern regions registered a 25 per cent rainfall deficit (Chart 32a). The sub-divisions adjoining the Himalayas and the eastern region are expected to receive normal/above normal rainfall in the second half of the SWM season (August-September), which could help improve the kharif sowing in these regions (Chart 32b). The reservoir position (as of August 10, 2023) remains comfortable at levels much above the decadal average (Chart 33). 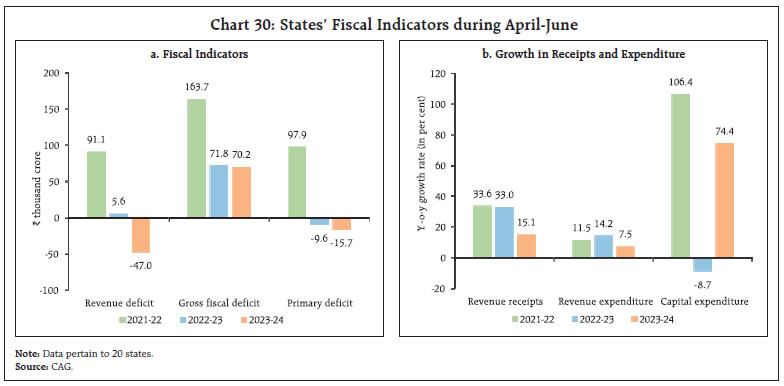 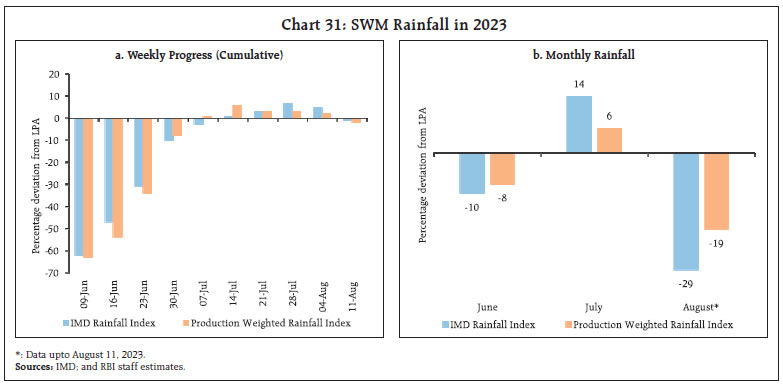 The total kharif sown area touched 979.9 lakh hectares as on August 11, 2023 marginally (0.8 per cent) higher than in the corresponding period of the previous year.24 Kharif acreage improved over successive weeks as the deficiency in SWM dissipated (Chart 34). As on August 11, 2023, 89.8 per cent of the full season normal area for kharif crops has been sown, aided by considerable progress of rice sowing (which alone accounts for 37 per cent of the total normal area) in July. Deficient rainfall in eastern and north-eastern states, that account for approximately 29 per cent of the total kharif rice sown area, has kept overall sown area under rice below normal (Chart 35). Acreage under all major pulses also remain low on account of sluggish sowing progress in the three prime producing States viz., Madhya Pradesh [(-) 10.6 per cent], Maharashtra [(-) 14.6 per cent] and Karnataka [(-) 17.0 per cent] where the SWM has been erratic. 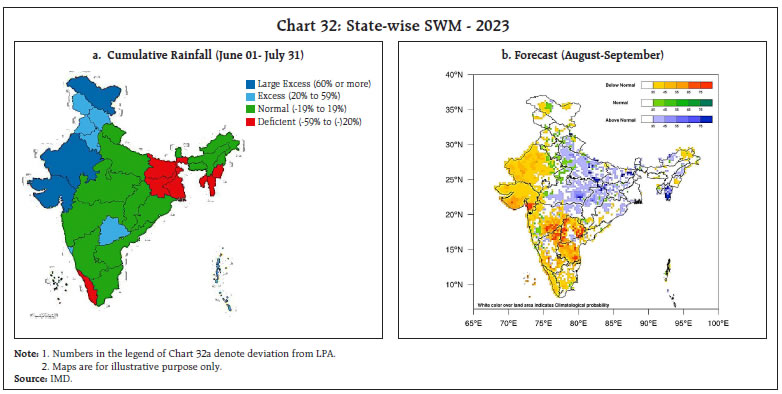 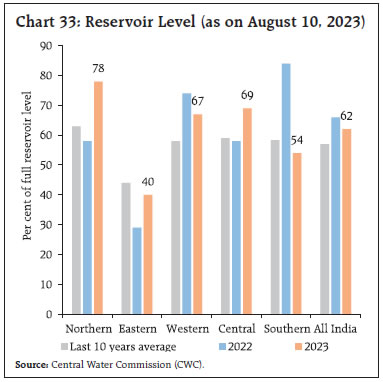 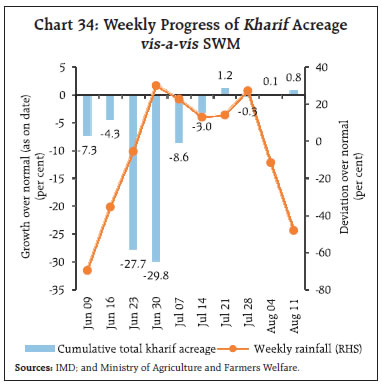 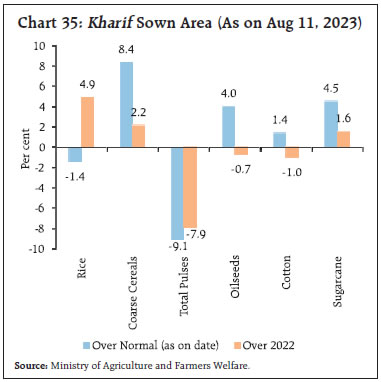 The headline PMI for manufacturing sector recorded a sequential moderation due to a fall in output, suppliers’ delivery times and stock of purchases, although the overall index remains in the expansionary zone and the output prospects are assessed to be strong (Chart 36a). The PMI services recorded its sharpest increase in over 13 years, led by robust demand and new business gains (Chart 36b). Transport indicators sustained momentum in July 2023. Cargo traffic at major ports improved in July, aided by growth across all categories barring thermal coal (Chart 37a). Railway freight traffic picked up moderately in July, led by increases in freight of iron ore and containerised cargo (Chart 37b). Coincident indicators of the construction sector remained buoyant on the back of continued impetus from the Government’s infrastructure spending. Steel consumption increased by 11.8 per cent (y-o-y) in July 2023 while cement production increased by 9.4 per cent y-o-y in June 2023 (Chart 38). 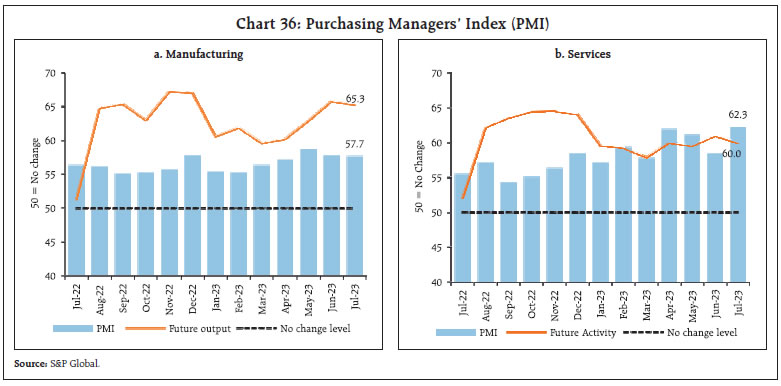 High-frequency indicators for the services sector showed resilience in overall economic activity in July 2023 (Table 1). In terms of regional policy initiatives, Karnataka launched the ‘Yuvanidhi Scheme’ to provide unemployment allowances of ₹1,500 and ₹3,000 per month to diploma and degree holders, respectively (who graduated in 2023) for a maximum duration of two years or until employment is secured, whichever is earlier. The Rajasthan Minimum Guaranteed Income Bill, 2023 ensures a minimum guaranteed income and at least 125 days of employment at the minimum wage per financial year for all adult citizens in both urban and rural parts of the state. 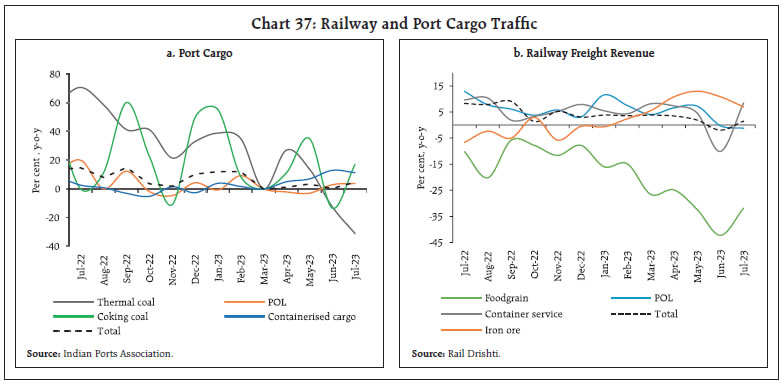  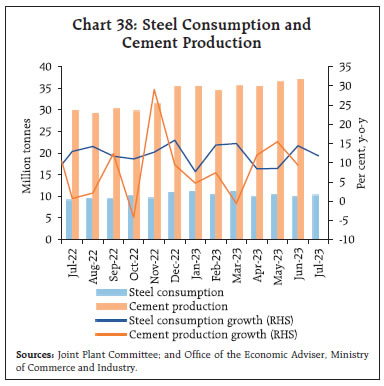 Inflation Headline inflation, as measured by y-o-y changes in the all-India consumer price index (CPI)25, surged to 7.4 per cent in July 2023 from 4.9 per cent in June 2023 (Chart 39). Positive momentum of about 290 bps – the highest in the current CPI series so far – was partly offset by the favourable base effect of 45 bps. The m-o-m increase in food prices was about 570 bps, at about 180 bps in fuel prices, and about 35 bps in the core group (i.e., excluding food and fuel). Inflation in the food and beverages group more than doubled to 10.6 per cent in July from 4.7 per cent in June, driven by a jump in momentum (5.7 per cent in July – the steepest increase in the CPI series so far vis-à-vis 2.2 per cent in June). This was driven primarily by the vegetables sub-group, which emerged out of deflationary territory over the last 8 months to register a y-o-y increase of 37.3 per cent in July. Inflation also edged up in cereals, meat and fish, fruits, pulses, sugar and spices. On the other hand, inflation in eggs, milk and prepared meals softened while the rate of deflation in edible oils eased (Chart 40). 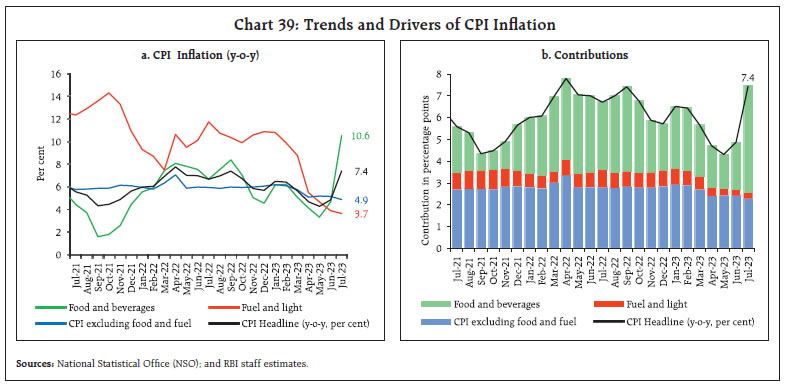 A number of measures were undertaken to arrest the price spike by improving the supply of key food items. The National Agricultural Cooperative Marketing Federation (NAFED) and National Cooperative Consumers Federation (NCCF) were directed to procure tomatoes from mandis in Andhra Pradesh, Karnataka, and Maharashtra for simultaneous distribution at discounted prices in major consumption centres where retail prices recorded maximum increases. Under the recently launched brand ‘Bharat Dal’, the sale of subsidised Chana dal (₹60 per kg for a one kg pack and ₹55 per kg for a 30 kg pack) from the government’s stock is intended to meet consumer demand at affordable prices. In response to high cereal inflation, the government has undertaken seven e-auctions under the Open Market Sale Scheme – Domestic [OMSS (D)], with a total sale around 8.2 lakh tonnes of wheat and 1,995 tonnes of rice (as on August 09). The Government has also ceased the diversion of subsidised rice to distilleries for ethanol production under the ethanol blending programme (EBP). Additionally, export of non-basmati white rice (semi-milled or wholly milled rice) and de-oiled rice bran (mainly used as fodder) was restricted with effect from July 20 and July 28, 2023, respectively. The stock levels for both rice and wheat stood at 2.8 and 1.0 times their respective quarterly buffer norms (as of August 01, 2023) which provides a cushion to address supply concerns. Inflation in the fuel and light group softened to 3.7 per cent in July from 3.9 per cent in June, mainly driven by a steep moderation in inflation in LPG prices and a sharper deflation in kerosene (PDS) prices. Electricity prices, however, went through a further increase (4.3 per cent m-o-m). Core inflation declined to 4.9 per cent in July from 5.2 per cent in June, softening in most of the sub-groups (i.e., clothing and footwear; housing; household goods and services; transportation and communication; and education). Inflation remained steady for sub-groups such as personal care and effects, and health, while it increased in respect of recreation and amusement (Chart 41). 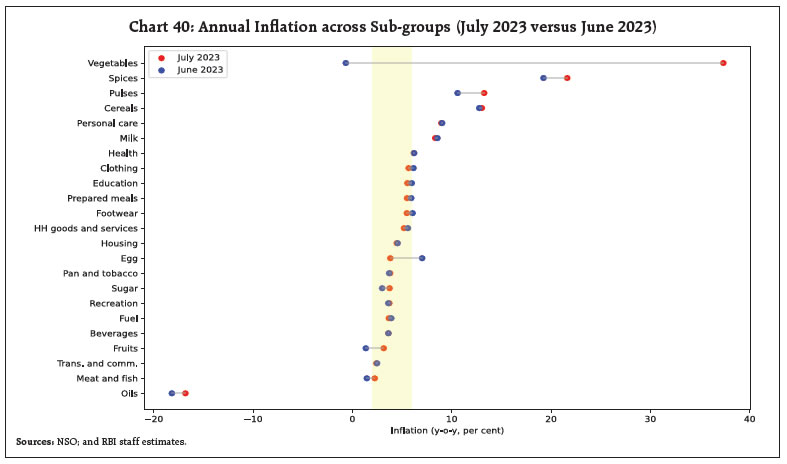 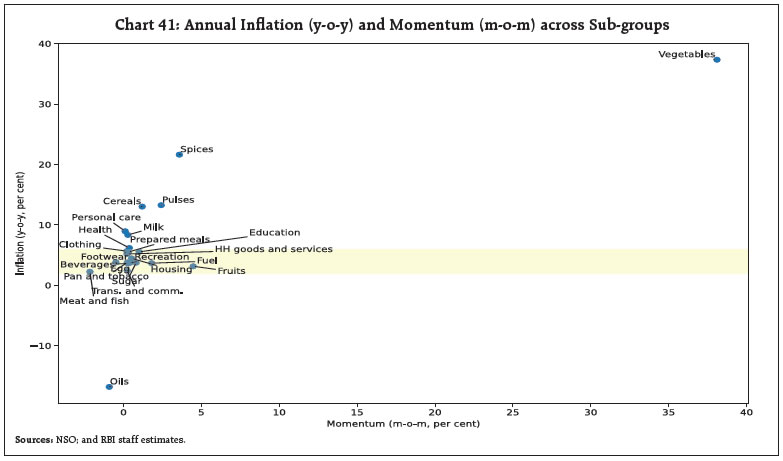 In terms of regional distribution, rural inflation at 7.6 per cent was higher than urban inflation at 7.2 per cent. Majority of the states registered inflation in the range of 6-8 per cent (Chart 42) High frequency food price data for August so far (up to 14th) show that prices of cereals and pulses continued to increase in August. Edible oil prices continued to decline in July-August (Chart 43). Tomato prices, on an average, registered a further increase in August so far, although more recent data indicate some pullback in prices. Onion and potato prices also registered sequential upticks. Retail selling prices of petrol and diesel in the four major metros remained steady in August so far (up to 14th). While kerosene prices increased sharply, LPG prices have been kept unchanged in August so far (Table 2). 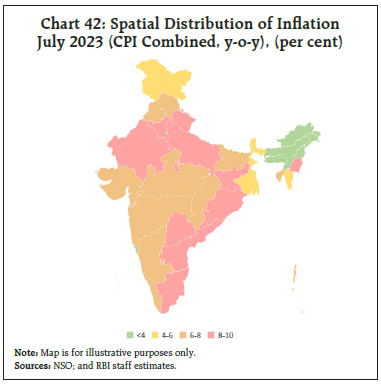 Input cost inflation based on the wholesale price index (WPI) for industrial inputs and farm inputs remained in deflation in July 2023 (Chart 44). 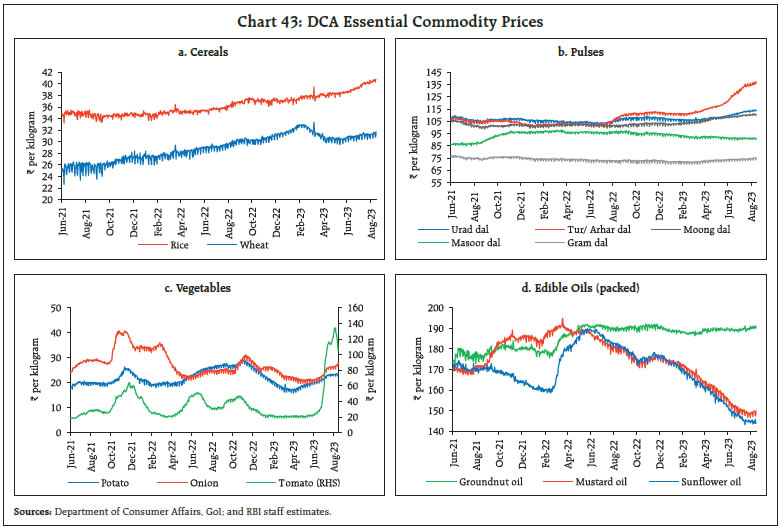 Inflation expectations of households moderated by 10 basis points each over the three months ahead and one year ahead horizons in July 2023 as compared with the May 2023 round of the survey. Since September 2022, three months and one year ahead inflation expectations have recorded cumulative moderation of 80 bps and 70 bps, respectively (Chart 45). 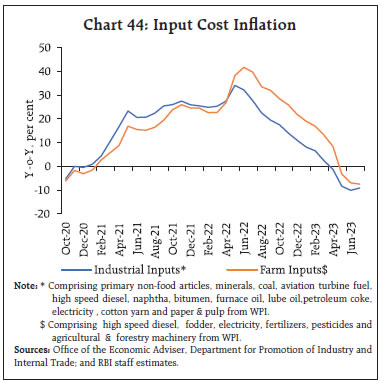 It is noteworthy that despite the sharp pick-up in inflation, the risk of stagflation remains low at the current juncture (Box 1). 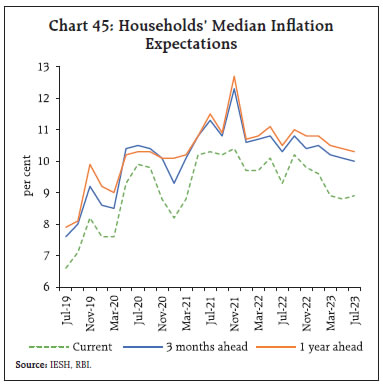
IV. Financial Conditions In view of the liquidity overhang engendered by the depositing of ₹2,000 banknotes with the banking system, the Reserve Bank announced an incremental cash reserve ratio (I-CRR) of 10 per cent in its third bi-monthly policy announcement on August 10, 2023. The I-CRR will be levied on the increase in scheduled banks’ net demand and time liabilities (NDTL) between May 19, 2023 and July 28, 2023 and will be effective from the fortnight beginning August 12, 2023. The ICRR will be reviewed on September 8, 2023 or earlier, well ahead of the festival season. During July 16 to August 11, 2023 liquidity conditions remained largely comfortable, with the average total absorption under the Liquidity Adjustment Facility (LAF) at ₹2.0 lakh crore (₹1.6 lakh crore during June 16 - July 15). The surplus was moderated by tax payments and GST related outflows. Of the total average surplus liquidity, the placement of funds under the standing deposit facility (SDF) averaged ₹1.2 lakh crore during July 16-August 11, 2023 while the remaining was mopped up through variable rate reverse repo (VRRR) operations. With liquidity conditions remaining easy, average recourse to the marginal standing facility (MSF) was lower at ₹0.05 lakh crore during July 16-August 11, 2023 (₹0.16 lakh crore during June 16 - July 15). Consequently, net absorptions under the LAF increased to ₹1.8 lakh crore during July 16 - August 11, 2023 from ₹1.3 lakh crore during June 16-July 15, 2023 (Chart 46). The weighted average call rate (WACR) traded with an easing bias. On an average basis, the WACR, triparty rate and market repo rates ruled 5 bps, 15 bps and 11 bps, respectively, below the policy repo rate during July 17 to August 11, 2023 (Chart 47a). Across the term money segment, the yield on 3-month certificates of deposit (CDs) and commercial paper (CP) for non-banking financial companies (NBFCs) remained largely stable above the upper band of the LAF corridor, while the yield on 3-month treasury bills (T-bills) was broadly aligned with the MSF rate (Chart 47b). In the primary market, fund mobilisation through issuances of CDs remained at ₹1.89 lakh crore during 2023-24 (up to July 28), marginally lower than ₹2.04 lakh crore in the corresponding period of the previous year. Strong credit growth and relatively lagging deposit growth have sustained CD issuances during the current year. On the other hand, CP issuances at ₹4.72 lakh crore (up to July 31) were higher than ₹4.43 lakh crore in the corresponding period of the previous year reflecting competitive rates for the corporates as well as large investments by the mutual funds due to availability of liquid funds. 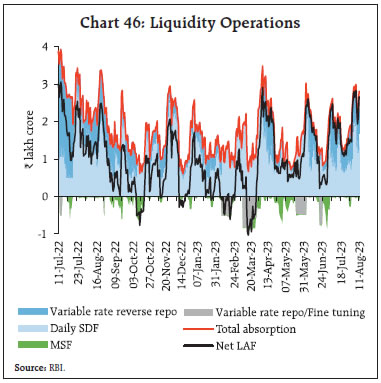 Domestic bond yields hardened in tandem with US treasury yields; the yield on the 10-year US treasury rose to a high of 4.18 per cent on August 3, its peak since November 7, 2022 on the back of stronger than expected US Q2:2023 GDP data and the downgrade of US credit rating by Fitch. The yield on the 10-year benchmark G-sec (7.26 per cent GS 2033) closed higher at 7.20 per cent on August 11, 2023 as compared with 7.09 per cent on July 14 (Chart 48a). The Reserve Bank’s monetary policy announcement on August 10 was largely anticipated by the market. Overall, the rise in domestic bond yields across the term structure was manifested in an upward shift of the yield curve (Chart 48b). 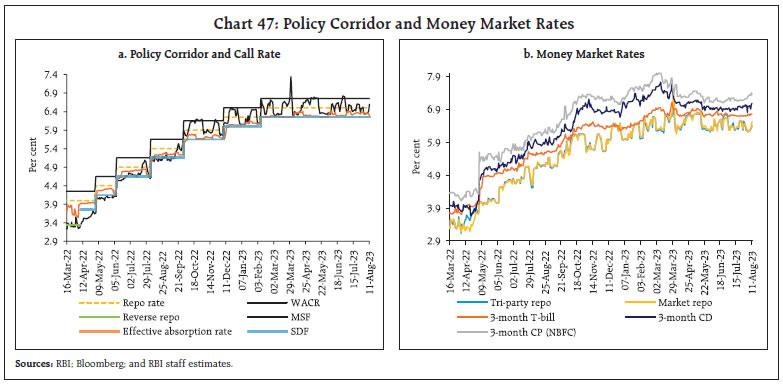 In contrast to firmer G-sec yields, corporate bond yields and associated risk premia declined during this period. The average risk premia in the bond market (5-year AAA minus 5 year G-sec) declined by 9 bps (Table 3). Funds mobilised through corporate bond issuances increased to ₹0.8 lakh crore during June 2023 from ₹0.7 lakh crore in July of the preceding year. Favourable market conditions engendered by stable long term yields and a cost advantage over bank loans has increased the preference for corporate bonds. Overall, corporate bond issuances during 2023-24 (up to July) amounted to ₹3.2 lakh crore, higher than ₹1.5 lakh crore during the same period in the previous year. 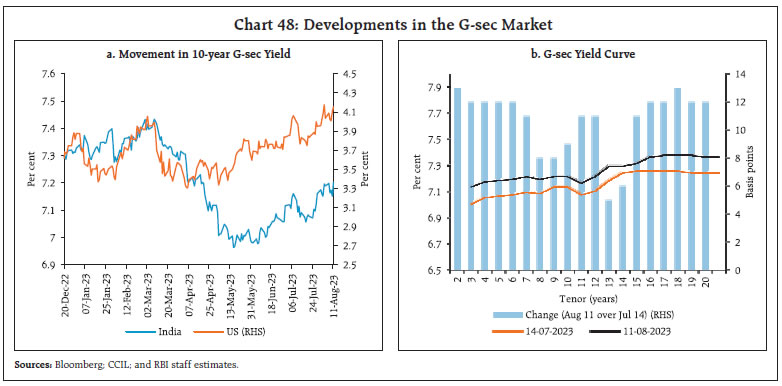 Reserve money (RM), excluding the first-round impact of change in the cash reserve ratio (CRR), grew by 6.1 per cent (y-o-y) as on August 4, 2023 (8.1 per cent a year ago) [Chart 49]. Currency in circulation (CiC), the largest component of RM, decelerated to 4.2 per cent from 8.2 per cent a year ago, with 88 per cent of the ₹2000 banknotes in circulation as on May 19, 2023 (announcement date) being returned as on July 31, 2023. Excluding the impact of the merger of a non-bank with a bank (with effect from July 1, 2023), money supply (M3) growth, as on July 28, 2023 was higher at 10.6 per cent (y-o-y) than 8.6 per cent in the corresponding period of last year. Aggregate deposits with banks, the largest component of M3, increased by 11.5 per cent (8.6 per cent a year ago). 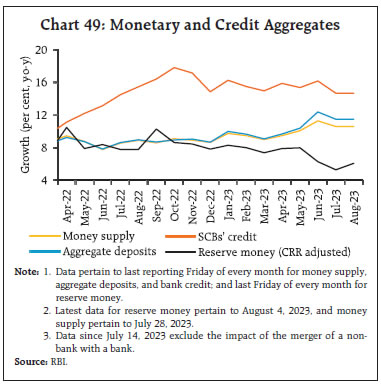 Scheduled commercial banks’ (SCBs’) credit, excluding the impact of the merger of a non-bank with a bank, moderated to 14.7 per cent as on July 28, 2023 due to an unfavourable base effect and tapering of the momentum of credit offtake by industry. Despite a marginal dip, SCBs’ deposit growth remained strong at 12.0 per cent (excluding the impact of merger) as on July 28, 2023 as compared with 9.2 per cent a year ago (Chart 50). 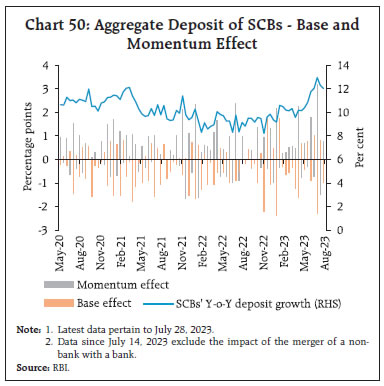 SCBs have increased their 1-year median marginal cost of funds-based lending rate (MCLR) by 155 bps during May 2022 to July 2023. Banks have completely passed on the repo rate hikes to their external benchmark-based lending rates (EBLRs). Consequently, the weighted average lending rates (WALRs) on fresh and outstanding rupee loans have increased by 169 bps and 110 bps, respectively during May 2022 to June 2023. Amidst robust credit demand, the weighted average domestic term deposit rates (WADTDRs) on fresh and outstanding deposits increased by 231 bps and 144 bps, respectively, during May 2022 to June 2023 (Table 4). Transmission across bank groups during May 2022 to June 2023 has been uneven. The increases in the WADTDR on fresh rupee deposits and WALR on fresh rupee loans were higher in the case of public sector banks, while the increases in WADTDR on outstanding deposits and WALR on outstanding loans were higher for private banks (Chart 51). Sales growth of private non-financial companies decelerated as suggested by the early results of listed companies for Q1:2023-2426 (Chart 52a). The manufacturing sector’s sales remained steady vis-a-vis the levels recorded a year ago, offset by a decline in sales in the petroleum sector. Real sales, however, expanded by 7.1 per cent (Chart 52b). Despite some relief from input cost pressures, increased staff costs and other expenses pulled down the operating profit margin of manufacturing companies on a sequential basis. 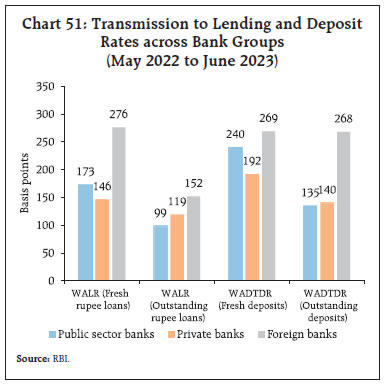 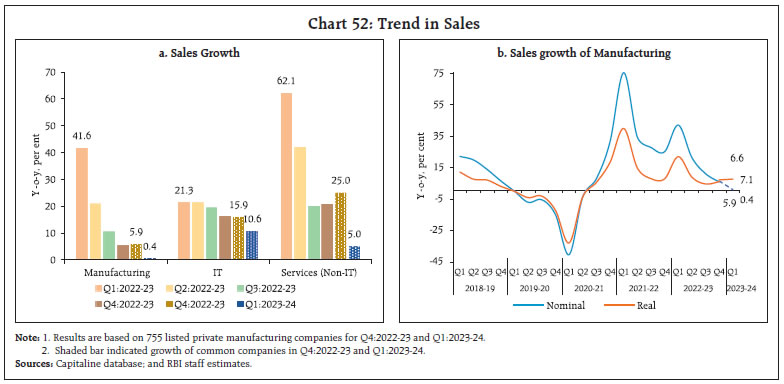 Banking and financial sector companies27 registered an impressive performance for another successive quarter. Robust demand conditions led to an acceleration in top-line growth (Chart 53). 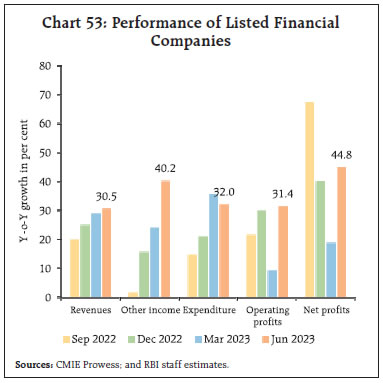 Equity markets scaled new highs in the second half of July 2023, aided by robust Q1:2023-24 corporate earnings and positive global cues (Chart 54). In early August 2023, equity markets registered some correction on general risk-off sentiment emanating from the sovereign rating downgrade of the US by Fitch and weak economic data releases from China and Europe. Closing at 65,323 on August 11, 2023 the BSE Sensex declined by 1.8 per cent in August so far, following gains of 2.8 per cent in July 2023. During Q1:2023-24, moderation in gross inward foreign direct investment (FDI), coupled with a rise in repatriation of FDI from India resulted in a decline in net FDI (Chart 55a). Manufacturing, financial services, business services, computer services, electricity, and other energy sectors received most of the investment and accounted for more than two-thirds of the fresh equity flows during this period. Singapore, followed by the Netherlands, Japan, the US, and Mauritius were major source countries for FDI during the same period. According to fDi Intelligence28, major globally announced FDI projects during H1:2023 were led by green energy transition and digitalisation (Chart 55b). 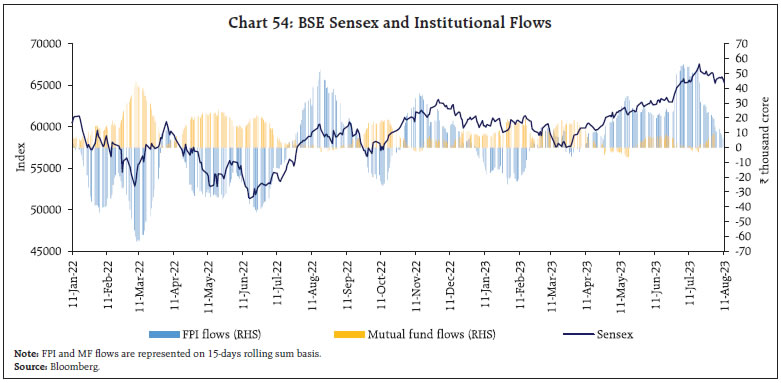 Foreign portfolio investors (FPIs) remained net buyers for the fifth consecutive month in July 2023 (US$ 4.3 billion) [Chart 56a]. Country-wise FPI investments reveal that Indian equities remain attractive among emerging market peers (Chart 56b). FPIs invested US$ 0.7 billion in domestic markets during August 2023 (up to 11th). 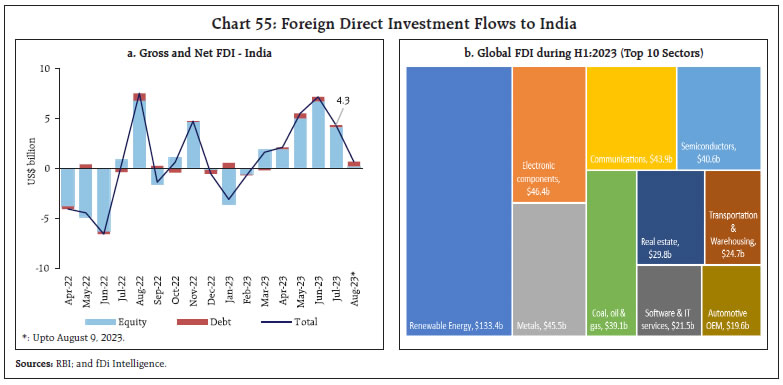 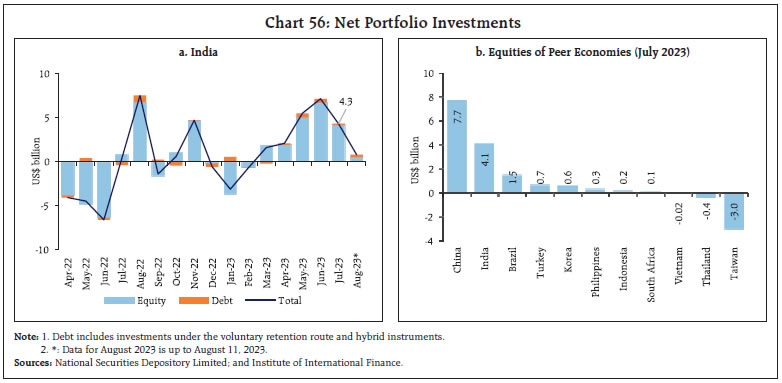 External commercial borrowing (ECB) registrations recorded a five-fold increase (y-o-y) during Q1:2023-24 (US$ 21.0 billion) as large corporations supplemented their local sources of financing with foreign funding (Chart 57). Rising investment demand, particularly in the infrastructure and services space, bolstered the appetite for external funds. ECB inflows of US$ 14.5 billion during the first quarter far exceeded the inflows of US$ 4.0 billion in Q1:2022-23. A significant rise in global interest benchmark rates, such as the Secured Overnight Financing Rate (SOFR), resulted in rise in the overall cost of ECB loans since March 2022, a relatively small part of which was offset by reduction in margin over the benchmark. The weighted average interest margin of 161 basis points (bps) during Q1:2023-24 stood lower than a year ago (197 bps) (Chart 58). 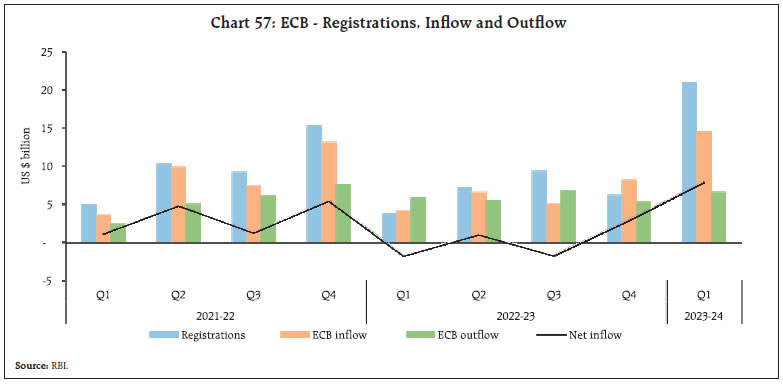 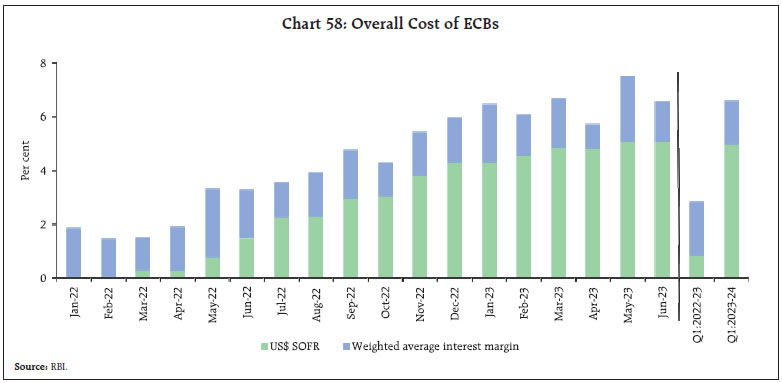 Over three-fourth of the ECB agreement amounts during April-June 2023 was effectively hedged in terms of explicit hedging, rupee denominated loans and loans from foreign parents, which considerably offsets the exchange rate sensitivity of such exposures (Chart 59). The foreign exchange reserves stood at US$ 601.5 billion on August 4, 2023, enough to cover about 10 months of imports projected for 2023-24 or 96 per cent of total external debt outstanding at end-March 2023 (Chart 60a). Reserves increased by 6.9 per cent (US$ 38.7 billion) during the calendar year 2023, the largest among major foreign exchange reserves holding countries (Chart 60b). 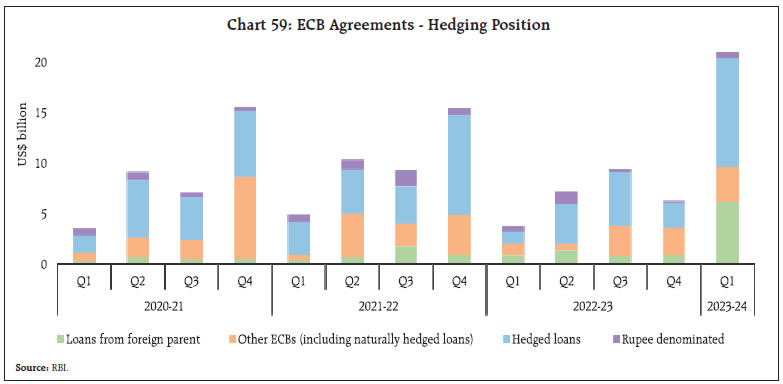 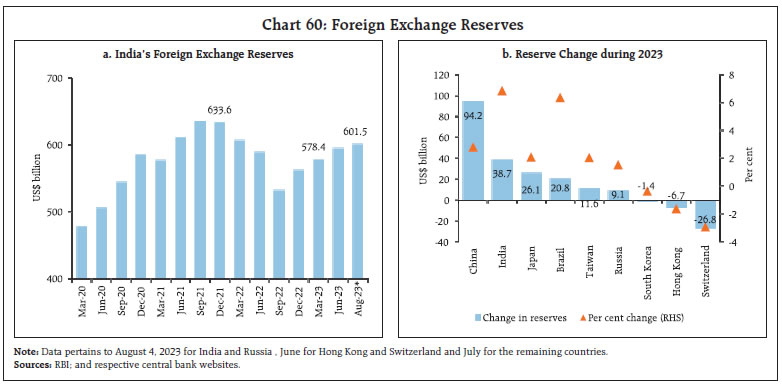 The Indian rupee (INR) appreciated by 0.1 per cent (m-o-m) vis-à-vis the US dollar in July 2023 and remained one of the least volatile currency among major currencies (Chart 61). In terms of the 40-currency real effective exchange rate (REER), the INR appreciated by 3.0 per cent (m-o-m) in July 2023 (Chart 62). Payment Systems Digital transactions sustained expansion (y-o-y) across major payment modes in July and August 2023 (up till 11th) (Table 5). There were 996 crore Unified Payments Interface (UPI) transactions in July, totalling over ₹15 lakh crore in value. Among the various prepayment options for online purchases, the UPI stands out as the most favoured mode (57 per cent), followed by credit cards (31 per cent), and other payment options such as wallets, net banking, and debit cards (12 per cent).29 Notably, the average transaction size for e-commerce payments using debit cards has risen by 50 per cent (y-o-y) in July.30 The disbursal of welfare payments under the PM Kisan Samman Nidhi (PM-KISAN) scheme induced an uptick (y-o-y) in transaction volumes for the National Automated Clearing House (NACH) in the month. The Reserve Bank’s recently released Digital Payments Index (DPI)31, a measure of the extent of digitalisation of the payment ecosystem, has been on a steady ascent, growing by 13.2 per cent in 2022-23.32 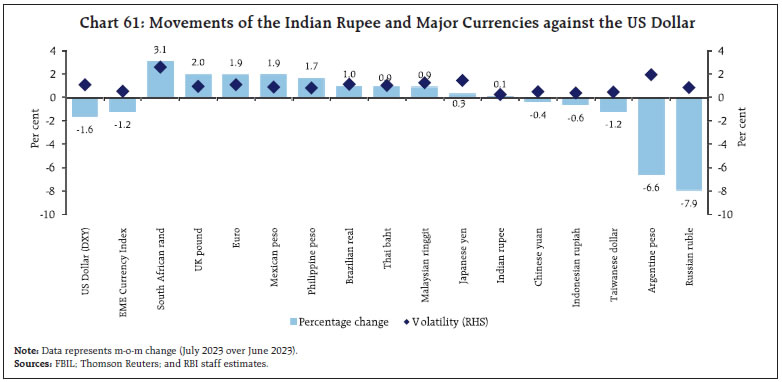 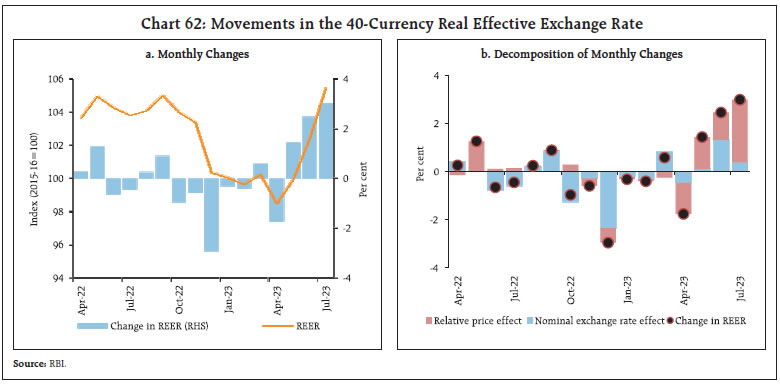 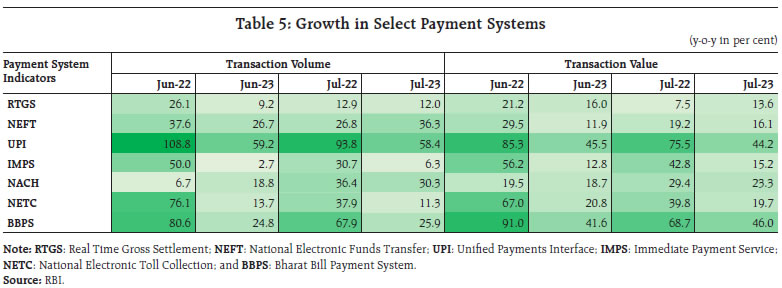 On the policy front, the Reserve Bank and the Central Bank of United Arab Emirates (UAE) signed two Memorandums of Understanding.33 First, a Local Currency Settlement System (LCSS) is proposed to be established to promote the use of the INR and the UAE Dirham (AED) for cross-border transactions between nations. Second, the two central banks agreed to (a) integrate their fast payment systems - India’s UPI with the Instant Payment Platform (IPP) of the UAE; (b) link the respective card switches (RuPay switch and UAESWITCH); and (c) explore the linking of payment messaging systems i.e., Structured Financial Messaging System (SFMS) of India with its counterpart in the UAE. These initiatives are anticipated to enable seamless cross-border fund transfers, facilitate mutual acceptance of domestic cards and foster the bilateral exchange of financial messages between the two countries. In the Statement on Developmental and Regulatory Policies dated August 10, 2023, the Reserve Bank has proposed a series of measures to bolster the uptake of digital payments, including an innovative payment mode, viz., “Conversational Payments” on the UPI that will enable users to interact with an artificial intelligence-powered system to initiate and complete transactions; facilitation of offline transactions under the on-device wallet UPI-Lite using Near Field Communication (NFC) technology; and increase in the per-transaction limit for small-value digital payments in offline mode to ₹500 from ₹200. In the FinTech space, a digital Public Tech Platform is being developed by the Reserve Bank Innovation Hub (RBIH) to enable the delivery of frictionless credit by facilitating a seamless flow of required digital information to lenders. V. Conclusion In this environment, the monetary policy committee (MPC) evaluated current and evolving macroeconomic and financial conditions in its meetings during August 8-10, 2023 and voted to maintain status quo on the policy rate and to stay committed to its stance of withdrawal of accommodation with the objective of aligning inflation with the target of 4 per cent. The MPC retained its forecast of growth at 6.5 per cent for 2023-24, noting that domestic economic activity is holding up well, supported by domestic demand in spite of the drag from weak external demand. The MPC revised upwards its projection of inflation taking into account the recent price surges in the food category of the CPI. The main revisions relate to the projections for the second and third quarters, with the forecast for the fourth quarter unchanged. This implies that the MPC expects these large shocks on account of supply disruptions due to adverse weather conditions to dissipate over the next six months. The Committee expressed “a readiness to act appropriately so as to ensure that their effects on the general level of prices do not persist.”34 Recent developments, including the return of ₹2000 banknotes overwhelmingly in the form of deposits, have expanded liquidity disproportionately. This has caused some dissonance with the disinflationary stance of monetary policy, while impeding transmission of policy impulses across the term structure of interest rates. The slosh of liquidity also has implications for financial stability in the form of potential asset price bubbles and weakening of lending standards. As the banking system engages in absorbing this excess liquidity into prudent credit expansion, it is necessary to temporarily pre-empt the surplus liquidity from getting into the cracks. Accordingly, the RBI announced an incremental cash reserve ratio (I-CRR) of 10 per cent on the increase in their net demand and time liabilities (NDTL) between May 19, 2023 and July 28, 2023. It would impound some of the surplus while leaving adequate liquidity in the system for normal banking business. The operative term is ‘temporary’ – the intent is to return the impounded funds ahead of advance tax outflows from the banking system and well before the pick-up in the demand for bank credit that typically characterises the second half of the year. The stance of monetary policy is best described in the Governor’s monetary policy statement: “In charting the course of monetary policy, we continuously assess the impact of our past actions, the evolving inflation dynamics and the implications of incoming data for the economic outlook. I reiterate our commitment to align CPI inflation to the 4 per cent target on a durable basis. We do look through idiosyncratic shocks, but if such idiosyncrasies show signs of persistence, we have to act.” Annex 1: Reserve Bank’s Quarterly Enterprise Surveys Q1:2023-24
* This article has been prepared by G. V. Nadhanael, Shahbaaz Khan, Yogesh H. C., Kunal Priyadarshi, Rohan Bansal, Ramesh Kumar Gupta, Silu Muduli, Himani Shekhar, Pankaj Kumar, Harendra Behera, Gautam, Anoop K Suresh, Akash Kovuri, Jobin Sebastian, Shelja Bhatia, Shivam, Prashant Kumar, Priyanka Sachdeva, Sakshi Awasthy, Abhinandan Borad, Khushi Sinha, Avnish Kumar, Kartikey Bhargav, Rajendra Nana Chavan, Savita Pareek, Arti Sinha, Asish Thomas George, Joice John, Vineet Kumar Srivastava, Samir Ranjan Behera, Deba Prasad Rath and Michael Debabrata Patra. Views expressed in this article are those of the authors and do not represent the views of the Reserve Bank of India. 1 Davis Malpass “Fitch Tells the Federal Reserve to Wake Up” https://www.wsj.com/articles/fitch-tells-the-federal-reserve-to-wake-up-bonds-private-sector-rating-116c0231 2 Lawrence H Summers, https://twitter.com/LHSummers/status/1686491454154125313. 3 Remarks by Secretary of the Treasury Janet L. Yellen on Inflation Reduction Act, Progress on Modernizing IRS, August 2, 2023. https://home.treasury.gov/news/press-releases/jy1672 4 Refer to Chart 60b. 5 The term was originally coined by Eichengreen, B. and Hausmann, R. (1999). Exchange Rates and Financial Fragility. NBER Working Paper No. 7418. 6 Robin Wigglesworth “The evolution of original sin”. https://www.ft.com/content/ae4db21e-d2a0-458f-a096-96b5d2d19af0 7 The Editorial Board, Financial Times, “Time to retire the ‘emerging markets’ label”, https://www.ft.com/content/1bb0b83f-6b0c-4c1d-9bd0-72a84392e7de 8 Antonio Guterres, UN Secretary General, Opening remarks at press conference on climate https://www.un.org/sg/en/content/sg/speeches/2023-07-27/secretary-generals-opening-remarks-press-conference-climate 9 Please refer to footnote no. 12 relating to production cuts by key suppliers. 10 Morgan Stanley Investor Presentation: Market Allocation – Major Changes. 11 ‘Morgan Stanley upgrades India, downgrades China’, Economic Times, August 4, 2023. 12 Saudi Arabia’s decision to extend its supply cut of one million barrels per day (bpd) through September and Russia’s announcement on August 3rd to curb exports by 300,000 bpd in September propelled prices even higher in early August. 13 State of the Economy, April 2023. 14 As per Bizom, a retail intelligence platform. 15 ‘FMCG sales rise as shops stock up ahead of festivals’, The Economic Times, August 3, 2023. 16 Source: Centre for Monitoring Indian Economy (CMIE). 17 The contraction in union excise duties during Q1: 2023-24 is primarily attributable to reduction in duties on fuel (viz., petrol and diesel) in May 2022. The excise duty was cut by ₹8 per litre and ₹6 per litre, for petrol and diesel, respectively, effective from May 22, 2022. 18 The Union government has released 3rd instalment of tax devolution to State governments amounting to ₹1,18,280 crore on June 12, 2023, as against normal monthly devolution of ₹59,140 crore. 19 During 2023-24, the Reserve Bank transferred a surplus of ₹87,416.22 crore to the Central government which is higher than both the amount transferred last year (₹30,307.45 crore) and the budgeted amount under Dividend/Surplus transfer of Reserve Bank of India, Nationalised Banks and Financial Institutions in the Union Budget 2023-24 (₹48,000 crore). 20 During Q1:2023-24, the government mobilised ₹4,235 crore as disinvestment receipts as compared with ₹24,559 crore during the corresponding period last year. 22 Source: India Meteorological Department (IMD). 23 PRN is calculated by using contribution of food grains production by each state. 24 Source: Ministry of Agriculture and Farmers Welfare. 25 As per the provisional data released by the National Statistical Office (NSO) on August 14, 2023. 26 The early results have a sample coverage of 79 per cent (by sales share). 27 Based on 303 companies, representing around 75 per cent of market capitalisation of all the listed banking and financial sector companies. 28 A specialist division from the Financial Times that provides a comprehensive offering of services related to foreign direct investment. 29 Shiprocket Report, 2023. eCommerce in the New Bharat and its Future. 30 Based on provisional data available for July 2023. 31 The index measures deepening and penetration of digital payments across 5 broad parameters. The 5 parameters are – Payment Enablers (weight of 25 per cent), Payment Infrastructure - Demand Side Factors (10 per cent) and Supply side factors (15 per cent), Payment Performance (45 per cent), and Consumer Centricity (5 per cent). 32 The latest RBI-DPI available for March 2023 was released on July 27, 2023 33 RBI. Press Release. July 15, 2023. 34 Monetary Policy Statement, 2023-24 Resolution of the Monetary Policy Committee (MPC) August 8-10, 2023. |

ଏହି ପେଜ୍ ଶେୟାର୍ କରନ୍ତୁ:


ରିଜର୍ଭ ବ୍ୟାଙ୍କ ଅଫ୍ ଇଣ୍ଡିଆ ମୋବାଇଲ୍ ଆପ୍ଲିକେସନ୍ ଇନଷ୍ଟଲ୍ କରନ୍ତୁ ଏବଂ ଲାଟେଷ୍ଟ ନିଉଜ୍ କୁ ଶୀଘ୍ର ଆକ୍ସେସ୍ ପାଆନ୍ତୁ!
ଆମର ଆପ୍ ଇନଷ୍ଟଲ୍ କରିବାକୁ QR କୋଡ୍ ସ୍କାନ୍ କରନ୍ତୁ


ପେଜ୍ ଅନ୍ତିମ ଅପଡେଟ୍ ହୋଇଛି:


