Inflation, as measured by year-on-year variations in the whole sale price index (WPI), had declined sharply to 0.8 per cent by end-March 2009 from the peak of 12.9 per cent on August 2, 2008. In 2009-10, it further declined and turned negative in early-June 2009 and continues to remain negative since then (-1.2 per cent as on July 11, 2009). The observed negative WPI inflation reflects the high base effect on account of sharp increases in prices during the first half of 2008-09. The momentum of the WPI since end-March 2009, however, indicates the existence of price pressures. During 2009-10 (up to July 11, 2009) WPI has registered an increase of 3.5 per cent. The upward revision in prices of administered petroleum products effective from July 2, 2009 on account of increases in international crude prices partly contributed to the increase in WPI during this period. Though international commodity prices had declined substantially from the peak recorded in 2008-09, they exhibited some firming up in the first quarter of 2009-10. The domestic supply prospects of key commodities are also affected by the delay in the progress of the monsoon. The visible signs of price pressures even as the headline inflation number turned negative over the short-run pose complex challenges for the conduct of monetary policy, particularly given the dampened domestic demand conditions. CPI based inflation in India remains high and the divergence between WPI inflation and CPI inflation continues to persist. VI.1 Inflationary conditions remained moderate among major economies during the first quarter of 2009-10. Pressure from aggregate demand continues to remain subdued on account of the global economic recession and international commodity prices have also remained significantly lower than their peaks recorded during the first half of 2008-09. The monetary policy stance pursued by most central banks in advanced economies as well as emerging economies during the first quarter of 2009-10 continued to be expansionary, as the ramifications of the financial crisis led to a deep recession in most of the advanced economies and significant contagion driven reduction in growth in emerging economies.
VI.2 In India, inflation as measured by year-on-year (y-o-y) variations in the wholesale price index (WPI), declined during 2009-10 from 0.8 per cent at end-March 2009 to turn negative in June 2009 (-1.2 per cent as on July 11, 2009), largely reflecting the base effect of sharp increase in prices recorded during the first half of 2008-09. During the current financial year (up to July 11, 2009), however, the WPI inflation has increased by 3.5 per cent indicating the existence of price pressures. Consumer price inflation, as reflected in various consumer price indices, remained high in the range of 8.6-11.5 per cent during May/June 2009 (y-o-y) as compared with 8.0-9.7 per cent in March 2009.
Global Inflation
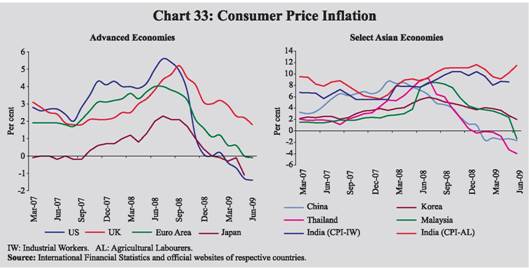
VI.3 Headline inflation in major advanced economies continued to decline from the high levels recorded during the first half of 2008-09. Consumer price inflation in OECD countries declined to 0.1 per cent in May 2009, continuing the sharp fall in annual inflation since its peak of 4.9 per cent in July 2008. The recent decline in inflation in OECD countries was led by a decline in inflation of energy and food articles. Amongst major economies, headline inflation in the US, Japan and Euro Area have entered negative territory while in the UK, inflation declined to 1.8 per cent in June 2009 (Chart 33). Core inflation also moderated in major economies. In OECD countries, inflation, excluding food and energy, came down to 1.8 per cent in May 2009 from 2.4 per cent in September 2008. Producer Price Index (PPI) inflation declined sharper in both advanced and emerging market economies (EMEs). PPI inflation in the OECD countries, which firmed up to 10.3 per cent in July 2008 declined sharply to (-)5.6 per cent in May 2009. VI.4 The headline inflation in most of the advanced countries fell significantly since mid-2008 and because of negative inflation experienced by the US, Japan and the Euro Area in the first half of 2009, the strong disinflation process created concerns of deflation in the face of persisting recessionary conditions. The major factors that contributed to the disinflation process include sharp decline in oil prices between mid-2008 and May 2009, major downward corrections in food and metals prices, lower shipping costs and the presence of significant slackness because of decline in capacity utilisation. According to the BIS (Annual Report, June 2009), synchronised slowdown and possible increase in household saving could aggravate the disinflation pressures. While short-term inflation expectations have declined, long-term expectations continued to remain stable. According to the IMF (July 2009) assessment, global inflation is expected to remain subdued notwithstanding upward pressure from recovering commodity prices because of the significant excess capacity. Risks for sustained deflation are perceived to be small, going by the trends in core inflation and inflation expectations.
VI.5 The monetary policy actions of most central banks continued to be focused on mitigating the adverse impact of the financial crisis. Countries like the US, UK and Japan, which had reduced their policy rates to near zero levels in 2008-09, kept these rates unchanged during the first quarter of 2009-10. Central banks in other advanced economies like the Euro Area, Australia and Canada reduced the policy rates further during the first quarter of 2009-10 (Table 49).
Table 49: Global Inflation Indicators |
(Per cent) |
Country/ Region |
Key Policy Rate |
Policy Rate (As on July 23, 2009) |
Changes in Policy Rates (basis points) |
CPI Inflation
(y-o-y) |
Sept 08 -Mar 09 |
Since end-Mar 09 |
Jun. 2008 |
Aug. 2008 |
Jun. 2009 |
1 |
2 |
3 |
4 |
5 |
6 |
7 |
8 |
Developed economies |
|
|
|
|
|
|
Australia |
Cash Rate |
3.00 (Apr.8, 2009) |
(-) 400 |
(-) 25 |
4.5^ |
5.0@ |
1.5^ |
Canada |
Overnight Rate |
0.25 (Apr.21, 2009) |
(-) 250 |
(-) 25 |
3.1 |
3.5 |
-0.3 |
Euro area |
Interest Rate on
Main Refinancing
Operations |
1.00 (May 13, 2009) |
(-) 275 |
(-) 50 |
4.0 |
3.8 |
-0.1 |
Japan |
Uncollateralised
Overnight Call Rate |
0.10 (Dec.19, 2008) |
(-) 40 |
0 |
1.3* |
2.1 |
-1.1* |
UK |
Official Bank Rate |
0.50 (Mar. 5, 2009) |
(-) 450 |
0 |
3.8 |
4.7 |
1.8 |
US |
Federal Funds Rate |
0.00 to 0.25
(Dec.16, 2008)
|
(-) 200 |
0 |
5.0 |
5.4 |
-1.4 |
Developing economies |
|
|
|
|
|
|
Brazil |
Selic Rate |
9.25 (June 11, 2009) |
(-) 250 |
(-) 200 |
6.1 |
6.2 |
4.8 |
India |
Reverse Repo Rate |
3.25 (Apr. 21, 2009) |
(-) 250 |
(-) 25 |
7.8* |
9.0 |
8.6* |
| |
Repo Rate |
4.75 (Apr. 21, 2009) |
(-) 400 |
(-) 25 |
|
|
|
| |
|
|
(- 400) |
0 |
|
|
|
China |
Benchmark 1-year |
5.31 (Dec 23, 2008) |
(-) 216 |
0 |
7.1 |
4.9 |
-1.7 |
| |
Lending Rate |
|
(-300) |
0 |
|
|
|
Indonesia |
Bank Indonesia (BI) Rate |
6.75 (July. 3, 2009) |
(-) 125 |
(-) 100 |
11.0 |
11.8 |
3.7 |
Israel |
Key Rate |
0.50 (Apr.1, 2009) |
(-) 350 |
(-) 25 |
4.8 |
5.0 |
3.6 |
Korea |
Base Rate |
2.00 (Feb 12, 2009) |
(-) 325 |
0 |
5.5 |
5.6 |
2.0 |
Philippines |
Reverse Repo Rate |
4.00 (July 9, 2009) |
(-) 125 |
(-) 75 |
11.4 |
12.5 |
1.5 |
Russia |
Refinancing Rate |
11.00 (July 13, 2009) |
200 |
(-) 200 |
15.2 |
15.0 |
11.9 |
South Africa |
Repo Rate |
7.50 (May. 29, 2009) |
(-) 250 |
(-) 200 |
11.7* |
13.7 |
8.0* |
Thailand |
1-day Repurchase Rate |
1.50 (Apr. 8, 2009) |
(-) 225 |
(-) 25 |
8.0 |
6.4 |
-4.0 |
^ : Q2. @: Q3. *: May.
Note: 1. For India, data on inflation pertain to CPI for Industrial Workers.
2. Figures in parentheses in column (3) indicate the dates when the policy rates were last revised. 3. Figures in parentheses in column (4) indicate the variation in the cash reserve ratios during the period.
Source : International Monetary Fund, websites of respective central banks and The Economist. |
VI.6 Since the second half of 2008-09, inflation in emerging economies eased significantly as international commodity prices declined and general slowdown in economic activity set in due to spillover of the global financial crisis. Among the major emerging economies, consumer price inflation in China, Thailand and Malaysia entered negative territory while the other major economies witnessed significant moderation in price pressures. Most central banks in emerging economies (except China) continued to reduce their policy rates to arrest the moderation in growth and to counter the spillover effects of the global financial crisis. Global Commodity Prices
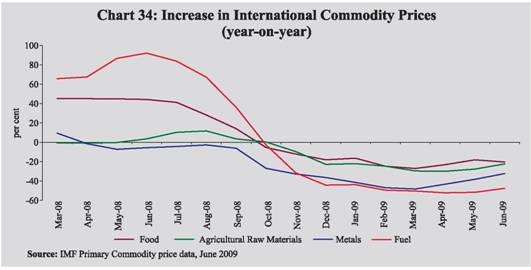
VI.7 International commodity prices, after recording sharp decline during the period July to December 2008, witnessed moderate increases up to June 2008 largely on account of increases in crude and food prices (Table 50). Most commodity prices, however, remained substantially lower than the very high levels recorded during the first half of 2008-09 as reflected by negative year-on-year changes (Chart 34). The expectations about recovery in global economy and weak supply prospects in major agricultural products have been the major drivers of the recent increases in international commodity prices. In July 2009, international prices exhibited considerable volatility.
Table 50: International Commodity Prices |
Commodity |
Unit |
Market Price
(2004) |
Index (2004=100) |
Variation
(Per cent) |
2005 |
2006 |
2007 |
Mar 2008 |
Jun 2008 |
Mar 2009 |
Apr 2009 |
May 2009 |
Jun 2009 |
Jun 09
over
Jun 08 |
Jun 09
over
Mar 09 |
1 |
2 |
3 |
4 |
5 |
6 |
7 |
8 |
9 |
10 |
11 |
12 |
13 |
14 |
Energy |
|
|
|
|
|
|
|
|
|
|
|
|
|
Coal |
$/mt |
53 |
90 |
93 |
124 |
223 |
302 |
115 |
120 |
122 |
135 |
-55.3 |
17.0 |
Crude oil (Average) |
$/bbl |
38 |
142 |
170 |
188 |
270 |
349 |
124 |
133 |
154 |
183 |
-47.4 |
48.3 |
Non-Energy Commodities |
|
|
|
|
|
|
|
|
|
|
|
|
|
Palm oil |
$/mt |
471 |
90 |
101 |
165 |
265 |
257 |
127 |
149 |
170 |
155 |
-39.8 |
22.1 |
Soybean oil |
$/mt |
616 |
88 |
97 |
143 |
240 |
250 |
118 |
130 |
145 |
144 |
-42.4 |
21.7 |
Soybeans |
$/mt |
307 |
90 |
88 |
125 |
188 |
203 |
123 |
135 |
152 |
164 |
-19.4 |
32.3 |
Rice |
$/mt |
238 |
120 |
128 |
137 |
250 |
318 |
247 |
231 |
224 |
241 |
-24.4 |
-2.8 |
Wheat |
$/mt |
157 |
97 |
122 |
163 |
280 |
222 |
147 |
149 |
167 |
163 |
-26.8 |
10.4 |
Maize |
$/mt |
112 |
88 |
109 |
146 |
210 |
257 |
147 |
151 |
161 |
161 |
-37.5 |
9.1 |
Sugar |
c/kg |
16 |
138 |
206 |
141 |
184 |
169 |
187 |
190 |
224 |
229 |
35.4 |
22.6 |
Cotton A Index |
c/kg |
137 |
89 |
93 |
102 |
129 |
124 |
83 |
92 |
100 |
99 |
-20.5 |
19.0 |
Aluminium |
$/mt |
1716 |
111 |
150 |
154 |
175 |
172 |
78 |
83 |
85 |
92 |
-46.8 |
17.8 |
Copper |
$/mt |
2866 |
128 |
235 |
248 |
294 |
288 |
131 |
154 |
159 |
175 |
-39.3 |
33.7 |
Gold |
$/toz |
409 |
109 |
148 |
170 |
237 |
217 |
226 |
218 |
227 |
231 |
6.3 |
2.3 |
Silver |
c/toz |
669 |
110 |
173 |
200 |
287 |
255 |
196 |
187 |
211 |
219 |
-14.0 |
11.8 |
Steel cold-rolled coilsheet |
$/mt |
607 |
121 |
114 |
107 |
132 |
181 |
148 |
115 |
115 |
115 |
-36.4 |
-22.2 |
Steel hot-rolled coilsheet |
$/mt |
503 |
126 |
119 |
109 |
149 |
199 |
159 |
119 |
119 |
119 |
-40.0 |
-25.0 |
Tin |
c/kg |
851 |
87 |
103 |
171 |
233 |
261 |
125 |
138 |
162 |
176 |
-32.6 |
40.4 |
Zinc |
c/kg |
105 |
132 |
313 |
309 |
240 |
181 |
116 |
132 |
142 |
149 |
-17.8 |
28.0 |
$: US dollar. c: US cent. bbl: barrel. mt: metric tonne. kg: Kilogram. toz: troy oz.
Source : Based on World Bank’s actual commodity price data. The year 2004 has been taken as the base to better exhibit price trends over the relevant period. |
VI.8 International crude oil prices (monthly average - West Texas Intermediary (WTI)) declined precipitously from the historical high of US$ 133.4 per barrel in July 2008 to US $ 39.2 per barrel in February 2009, reflecting falling demand in the Organisation for Economic Cooperation and Development (OECD) countries as well as some developing countries, notably in Asia, following the economic slowdown. Subsequently, crude oil prices firmed up to around US$ 70 per barrel by end-June 2009 reflecting the expectations of an early global economic recovery and future increases in oil consumption. WTI crude oil prices have been volatile since then and were at US$ 66.0 per barrel as on July 23, 2009.
VI.9 Iron and steel prices declined sharply since August 2008, reflecting falling demand from advanced economies and emerging economies, as global economic downturn has led to lower prospects for construction activity and investment in capital equipments. The World Bank steel price product index declined by 33.7 per cent, year-on-year, in June 2009. According to the ‘OECD Steel Committee’, steel industry is expected to benefit indirectly from the significant and widespread government support to key steel-using sectors, mainly infrastructure, construction and automobiles, as planned in most stimulus packages. A sharp revival in global steel demand, however, is seen to be unlikely by the Committee before the end of 2009.
VI.10 International food prices eased significantly since the second quarter of 2008-09 on the back of improved supply prospects, particularly for oilseeds and grains in major producing countries and unwinding of commodity investments by financial markets participants. Food prices, however, increased since December 2008 (19.6 per cent increase in IMF food price index between December 2008 and June 2009). The recent increase in food prices could be due to a number of factors. The Food and Agriculture Organisation (FAO), in its June 2009 ‘Food Outlook’ points to a reduction in cereal output for the year 2009-10. Supply prospects for other key agricultural products like oilseeds remain tight as the crop prospects in South America have deteriorated, and soybean production estimates had to be lowered several times because of persisting severe weather problems. VI.11 International sugar prices have remained high in 2008-09 and increased since December 2008 (international sugar prices rose by 40 per cent between December 2008 and June 2009) This price pattern mainly reflected a reduction in global export availability, following a sharp decline in India’s sugar output in 2008-09 and expectations of lower crops in the EU, the US, China and Australia. Global cotton prices have also been increasing in recent months. World cotton prices (represented by the ‘Cotton A Index’) have increased by 19 per cent since March 2009. According to the International Cotton Advisory Committee (ICAC), world cotton production is expected to remain at the same level during 2009-10 as in 2008-09, while global consumption is expected to increase marginally.
Inflation Conditions in India
VI.12 Since September 2008, the Reserve Bank shifted its policy stance from containing aggregate demand to supporting demand expansion with a view to arresting the moderation in growth. Accordingly, between October 2008 and March 2009, the Reserve Bank reduced the repo rate under the LAF from 9.0 per cent to 5.0 per cent, the reverse repo rate under the LAF from 6.0 per cent to 3.5 per cent and the CRR from 9.0 per cent to 5.0 per cent. The aim of these measures was to augment domestic liquidity and to ensure that credit continues to flow to productive sectors of the economy.
VI.13 The Annual Policy Statement (APS) of the Reserve Bank for the year 2009-10 observed that on account of slump in global demand, pressures on global commodity prices had abated markedly around the world. The sharp decline in prices of crude oil, metals, foodgrains, cotton and cement had influenced inflation expectations in most parts of the world. This was also reflected in the domestic WPI inflation reaching close to zero by end-March 2009. Prices of manufactured products have decelerated sharply, while that of the fuel group has contracted, though inflation on account of food articles remains high. Keeping in view the global trends in commodity prices and domestic demand-supply balance, WPI inflation for end-March 2010 was projected at around 4.0 per cent by the APS.
VI.14 The APS had also noted that with WPI inflation falling to near zero and possibly likely to get into a negative territory, albeit for a short period, CPI inflation was expected to moderate indicating that inflationary risks have clearly abated. Given this background of abating inflationary pressures, the Reserve Bank announced further monetary stimulus measures in terms of reduction in the repo rate under the LAF from 5.0 per cent to 4.75 per cent and the reverse repo rate under the LAF from 3.5 per cent to 3.25 per cent on April 21, 2009 (Table 51).
VI.15 Unlike WPI inflation which turned negative in June 2009, the CPI inflation continues to remain high in the range of 8.6 to 11.5 per cent during May/June 2009. The APS had highlighted that WPI inflation and CPI inflation which by and large moved in tandem till April 2007, have tended to diverge since then. The divergence in the recent period has been unusually high reflecting the volatilities in commodity prices like fuel and metals which have a higher weight in WPI.
Table 51 : Movements in Key Policy Rates in India |
(Per cent) |
Effective since |
Reverse
Repo Rate |
Repo Rate |
Cash Reserve Ratio |
WPI Inflation |
CPI (IW) Inflation |
1 |
2 |
3 |
4 |
5 |
6 |
April 14, 2007 |
6.00 |
7.75 |
6.25 (+0.25) |
6.3 |
6.7 |
April 28, 2007 |
6.00 |
7.75 |
6.50 (+0.25) |
6.0 |
6.7 |
August 4, 2007 |
6.00 |
7.75 |
7.00 (+0.50) |
4.4 |
7.3 |
November 10, 2007 |
6.00 |
7.75 |
7.50 (+0.50) |
3.2 |
5.5 |
April 26, 2008 |
6.00 |
7.75 |
7.75 (+0.25) |
8.3 |
7.8 |
May 10,2008 |
6.00 |
7.75 |
8.00 (+0.25) |
8.6 |
7.8 |
May 24,2008 |
6.00 |
7.75 |
8.25 (+0.25) |
8.9 |
7.8 |
June 12, 2008 |
6.00 |
8.00 (+0.25) |
8.25 |
11.7 |
7.7 |
June 25, 2008 |
6.00 |
8.50 (+0.50) |
8.25 |
11.9 |
7.7 |
July 5, 2008 |
6.00 |
8.50 |
8.50 (+0.25) |
12.2 |
8.3 |
July 19, 2008 |
6.00 |
8.50 |
8.75 (+0.25) |
12.5 |
8.3 |
July 30, 2008 |
6.00 |
9.00 (+0.50) |
8.75 |
12.5 |
8.3 |
August 30, 2008 |
6.00 |
9.00 |
9.00 (+0.25) |
12.4 |
9.0 |
October 11, 2008 |
6.00 |
9.00 |
6.50 (-2.50) |
11.3 |
10.4 |
October 20, 2008 |
6.00 |
8.00 (-1.00) |
6.50 |
10.8 |
10.4 |
October 25, 2008 |
6.00 |
8.00 |
6.00 (-0.50) |
10.7 |
10.4 |
November 3, 2008 |
6.00 |
7.50 (-0.50) |
6.00 |
8.7 |
10.4 |
November 8, 2008 |
6.00 |
7.50 |
5.50 (-0.50) |
8.7 |
10.4 |
December 8, 2008 |
5.00 (-1.00) |
6.50 (-1.00) |
5.50 |
6.6 |
9.7 |
January 5, 2009 |
4.00 (-1.00) |
5.50 (-1.00) |
5.50 |
5.3 |
10.4 |
January 17, 2009 |
4.00 |
5.50 |
5.00 (-0.50) |
4.9 |
10.4 |
March 4, 2009 |
3.50 (-0.50) |
5.00 (-0.50) |
5.00 |
0.9 |
8.0 |
April 21, 2009 |
3.25 (-0.25) |
4.75 (-0.25) |
5.00 |
1.7 |
8.7 |
Note: 1. With effect from October 29, 2004, the nomenclature of repo and reverse repo was changed in keeping with international usage. Now, reverse repo indicates absorption of liquidity and repo signifies injection of liquidity. Prior to October 29, 2004, repo indicated absorption of liquidity, while reverse repo meant injection of liquidity.
2. Figures in parentheses indicate change in policy rates. |
Wholesale Price Inflation
VI.16 WPI inflation in India has exhibited strong downward trend since August 2008 and reached 0.8 per cent by end-March 2009, driven by the reduction in the administered prices of petroleum products and electricity as well as decline in prices of freely priced minerals oil items, iron and steel, oilseeds, edible oils, oil cakes and raw cotton. Significant part of the reduction in WPI inflation during this period could also be attributed to the base effect reflecting the rapid increase in inflation recorded during the last quarter of 2007-08.
VI.17 Year-on-year WPI inflation declined further during the first quarter of 2009-10, entered negative territory on June 6, 2009 and continued to remain negative (-1.2 per cent as on July 11, 2009). The negative inflation numbers largely reflect the strong base effect of significant increase in administered prices of petroleum products in June 2008 on account of the substantially high international prices. Freely priced products like iron and steel, non-ferrous metals, chemicals and edible oils also recorded year-on-year decline during this period.
VI.18 WPI exhibited upward trend during the current financial year so far and increased by 3.5 per cent as on July 11, 2009, over end-March-2009. The recent increase in the WPI was largely on account of the upward revision of prices of petrol and diesel (effective July 2, 2009), increase in prices of freely priced products under the fuel group in line with hardening of crude oil prices and higher prices of vegetables, oilseeds/oil cakes, raw cotton and drugs and medicines. Metals prices, however, continued to decline during the current financial year. It may also be noted that, most commodity prices have moved up since March 2009 in line with the increase in international commodity prices (Table 52).
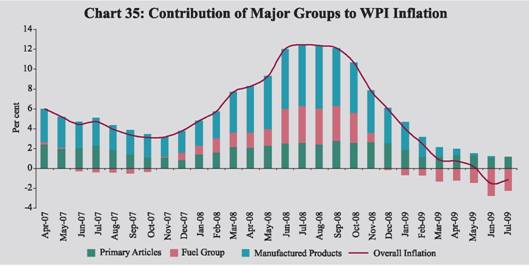
VI.19 In terms of contribution to overall inflation by the major groups, the contribution of fuel group to overall inflation has declined sharply and turned negative in December 2008 (Chart 35). The contribution of manufactured products group has waned in the declining phase of inflation, whereas, the contribution of primary article group continues to remain positive and strong.
Table 52: Key Commodity Prices -Global vis-à-vis Domestic |
(Per cent) |
Item |
Annual Inflation
(y-o-y, June 09) |
Recent trends Jun 09 over Mar 09 |
Global |
India |
Global |
India* |
1 |
2 |
3 |
4 |
5 |
1. |
Rice |
-24.4 |
14.9 |
-2.8 |
0.3 |
2. |
Wheat |
-26.8 |
7.2 |
10.4 |
2.3 |
3. |
Milk |
- |
4.8 |
- |
0.0 |
4. |
Raw Cotton |
-20.5 |
-10.6 |
19.0 |
5.2 |
5. |
Oilseeds |
-19.4 |
-3.8 |
32.3 |
5.3 |
6. |
Coal mining |
-55.3 |
-1.0 |
17.0 |
0.0 |
7. |
Minerals Oil |
-47.4 |
-18.3 |
48.3 |
3.7 |
8. |
Edible Oils |
-39.8 |
-12.3 |
22.1 |
-2.8 |
9. |
Oil Cakes |
-12.9 |
12.3 |
29.7 |
12.2 |
10. |
Sugar |
35.4 |
34.7 |
22.6 |
11.5 |
11. |
Basic Heavy Inorganic Chemicals |
- |
-23.1 |
- |
-4.5 |
12. |
Basic Metals, Alloys and Products |
-32.3# |
-14.1 |
21.1# |
-0.5 |
| |
- Iron and Steel |
-33.7 |
-19.9 |
-16.4 |
-0.6 |
*: Based on WPI as on June 27, 2009 over end-March 2009.
#: Represented by IMF metals price index, which covers copper, aluminium, iron ore, tin, nickel, zinc, lead and uranium.
Note : Global price increases are based on the World Bank and IMF primary commodity prices data. |
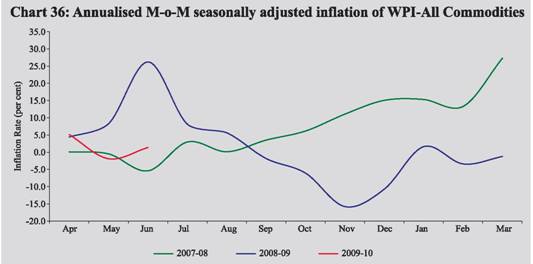
VI.20 Inflation momentum, as indicated by the movement in the annualised month-over-month seasonally adjusted WPI inflation, turned negative in September 2008 (Chart 36). Inflation momentum, however, has turned positive since April 2009 (the negative number of May 2009 is on account of provisional figure not being revised). According to the latest data available, annualised WPI (seasonally adjusted) inflation for the month of June 2009 remains positive. It may be noted that though M-o-M seasonally adjusted inflation is a useful indicator of inflationary conditions, it tends to be volatile.
VI.21 At a disaggregated level, the y-o-y inflation, excluding fuel, was at 1.4 per cent as on July 11, 2009 as compared with 10.9 per cent a year ago, indicating that the non-fuel component of WPI continues to record positive inflation. It could be observed that during the period June-October 2008, when WPI inflation was at substantially high level, overall inflation was higher than the WPI excluding fuel inflation. Since October 2008 the overall inflation has been lower than the WPI excluding fuel inflation, indicating that the fuel group contributes substantially to the volatility in inflation in the recent past (Chart 37). The annual average WPI inflation rate (average of 52 weeks) also declined to 5.4 per cent as on July 11, 2009 from 8.3 per cent at end-March 2009.
VI.22 Amongst the major groups, primary articles inflation, y-o-y, was at 5.0 per cent as on July 11, 2009 as compared with 5.2 per cent at end-March 2009, largely reflecting the high base effect. Since end-March 2009, primary articles prices have increased by 4.5 per cent, with increases in both food and non-food article prices. Vegetable prices recorded an increase of over 60 per cent over end-March 2009, reflecting the seasonal pattern as well as lower availability in the market due to strong and extended summer affecting vegetable cropping. Tea prices have increased by about 25 per cent since March 2009 as global tea production is forecast to decline by 16 per cent. Wheat, rice and pulses prices also recorded marginal increase over end-March 2009 (Table 53).
VI.23 Some of the non-food articles such as oilseeds and raw cotton also witnessed increase in prices during this period largely on account of elevated global prices and lower domestic production (raw cotton and oilseeds production are estimated to decline by 10 per cent and 5 per cent respectively in 2008-09 over the previous year, as per the fourth advance estimates for 2008-09). Global cotton and oilseeds prices also increased between March 2009 to June 2009. Notwithstanding the recent increase, raw cotton and oilseeds prices continued to remain below the levels recorded during the corresponding period a year ago.
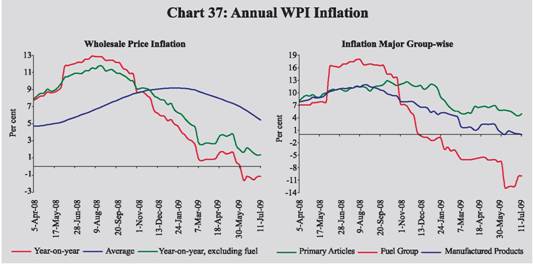
Table 53: Wholesale Price Inflation in India (year-on-year) |
(Per cent) |
Commodity |
Weight |
2008-09
(July 12) |
2008-09
(Mar 28) |
2009-10
(July 11) P |
Financial Year (over end-March 09) P |
Inflation |
WC |
Inflation |
WC |
Inflation |
WC |
Inflation |
WC |
1 |
2 |
3 |
4 |
5 |
6 |
7 |
8 |
9 |
10 |
All Commodities |
100.0 |
12.1 |
100.0 |
0.8 |
100.0 |
-1.2 |
100.0 |
3.5 |
100.0 |
1. |
Primary Articles |
22.0 |
10.4 |
19.8 |
5.2 |
141.4 |
5.0 |
96.8 |
4.5 |
30.7 |
| |
Food Articles |
15.4 |
5.7 |
7.6 |
7.0 |
128.9 |
8.2 |
107.3 |
4.8 |
22.4 |
| |
i. |
Rice |
2.4 |
8.4 |
1.5 |
14.9 |
38.7 |
15.2 |
27.0 |
1.4 |
1.0 |
| |
ii. |
Wheat |
1.4 |
8.5 |
1.0 |
4.5 |
7.7 |
2.2 |
2.6 |
1.4 |
0.6 |
| |
iii. |
Pulses |
0.6 |
0.5 |
0.0 |
9.4 |
7.4 |
15.9 |
8.6 |
6.7 |
1.3 |
| |
iv. |
Vegetables |
1.5 |
-4.6 |
-0.7 |
-5.2 |
-8.2 |
21.8 |
29.4 |
61.9 |
21.7 |
| |
v. |
Fruits |
1.5 |
12.1 |
1.5 |
5.9 |
12.4 |
2.5 |
3.2 |
-14.0 |
-7.3 |
| |
vi. |
Milk |
4.4 |
7.6 |
2.7 |
7.0 |
35.6 |
4.8 |
16.8 |
0.0 |
0.0 |
| |
vii. |
Eggs, Fish and Meat |
2.2 |
1.4 |
0.3 |
3.2 |
8.9 |
0.4 |
0.7 |
1.7 |
1.1 |
| |
Non-Food Articles |
6.1 |
16.3 |
8.2 |
0.1 |
1.0 |
-2.7 |
-14.2 |
4.8 |
8.3 |
| |
i. |
Raw Cotton |
1.4 |
31.5 |
3.0 |
2.5 |
3.5 |
-10.3 |
-11.9 |
6.8 |
2.3 |
| |
ii. |
Oilseeds |
2.7 |
18.5 |
4.1 |
-1.6 |
-5.6 |
-1.1 |
-2.8 |
6.2 |
4.8 |
| |
iii. |
Sugarcane |
1.3 |
-0.4 |
0.0 |
0.0 |
0.0 |
0.0 |
0.0 |
0.0 |
0.0 |
| |
Minerals |
0.5 |
50.0 |
4.1 |
7.2 |
11.6 |
2.9 |
3.3 |
0.0 |
0.0 |
2. |
Fuel, Power, Light and Lubricants |
14.2 |
16.9 |
29.9 |
-6.1 |
-155.7 |
-10.0 |
-192.1 |
5.4 |
30.6 |
| |
i. |
Coal Mining |
1.8 |
9.8 |
1.5 |
-1.0 |
-2.4 |
-1.0 |
-1.6 |
0.0 |
0.0 |
| |
ii. |
Minerals Oil |
7.0 |
26.7 |
27.6 |
-8.7 |
-132.8 |
-14.6 |
-176.2 |
9.4 |
30.6 |
| |
iii. |
Electricity |
5.5 |
1.4 |
0.8 |
-2.6 |
-21.1 |
-2.6 |
-14.3 |
0.0 |
0.0 |
3. |
Manufactured Products |
63.7 |
11.0 |
50.2 |
1.7 |
114.0 |
-0.05 |
-2.3 |
2.5 |
39.3 |
| |
i. |
Food Products |
11.5 |
14.1 |
11.7 |
8.8 |
108.7 |
9.8 |
85.7 |
5.2 |
16.4 |
| |
|
of which: Sugar |
3.6 |
6.0 |
1.2 |
18.4 |
52.8 |
34.0 |
65.7 |
12.2 |
9.7 |
| |
|
Edible Oils |
2.8 |
17.4 |
3.2 |
-7.6 |
-21.6 |
-12.9 |
-25.7 |
-3.2 |
-2.0 |
| |
|
Oil cakes |
1.4 |
49.3 |
6.5 |
19.3 |
43.2 |
12.4 |
22.6 |
12.6 |
7.9 |
| |
ii. |
Cotton Textiles |
4.2 |
6.2 |
1.6 |
16.2 |
53.5 |
3.4 |
8.6 |
0.8 |
0.7 |
| |
iii. |
Man Made Fibres |
4.4 |
6.6 |
1.1 |
-1.5 |
-3.2 |
-4.3 |
-6.9 |
2.5 |
1.3 |
| |
iv. |
Chemicals and Products |
11.9 |
10.0 |
9.3 |
2.0 |
26.4 |
2.3 |
21.3 |
5.5 |
17.5 |
| |
|
of which : Fertilisers |
3.7 |
10.0 |
2.6 |
4.8 |
17.5 |
-0.4 |
-0.9 |
0.3 |
0.3 |
| |
v. |
Non-Metallic Mineral Products |
2.5 |
4.3 |
0.9 |
1.9 |
5.4 |
3.5 |
6.7 |
1.8 |
1.2 |
| |
|
of which: Cement |
1.7 |
3.0 |
0.4 |
2.2 |
4.4 |
4.2 |
5.8 |
2.3 |
1.1 |
| |
vi. |
Basic Metals, Alloys and Metal Products |
8.3 |
22.9 |
18.0 |
-12.2 |
-155.9 |
-15.1 |
-134.7 |
-0.4 |
-1.1 |
| |
|
of which: Iron and Steel |
3.6 |
35.1 |
13.2 |
-18.4 |
-124.4 |
-21.0 |
-99.0 |
-0.5 |
-0.6 |
| |
vii. |
Machinery and Machine Tools |
8.4 |
6.1 |
3.3 |
2.6 |
18.9 |
-2.4 |
-12.5 |
-0.2 |
-0.3 |
| |
|
of which: Electrical Machinery |
5.0 |
6.2 |
1.7 |
1.1 |
4.2 |
-4.2 |
-11.6 |
-0.3 |
-0.2 |
| |
viii. |
Transport Equipment and Parts |
4.3 |
6.0 |
1.6 |
3.1 |
12.0 |
0.7 |
2.0 |
0.5 |
0.5 |
Memo: |
|
|
|
|
|
|
|
|
|
Food Items (Composite) |
26.9 |
8.9 |
19.3 |
7.7 |
237.6 |
8.9 |
193.0 |
5.0 |
38.8 |
WPI Excluding Food |
73.1 |
13.3 |
80.7 |
-1.6 |
-137.6 |
-4.6 |
-293.0 |
3.0 |
61.2 |
WPI Excluding Fuel |
85.8 |
10.8 |
70.1 |
2.7 |
255.7 |
1.4 |
92.1 |
3.1 |
69.4 |
WC: Weighted Contribution. P: Provisional. |
VI.24 The minimum support prices for most of the agricultural crops have been revised upwards during the 2008-09 crop season (Table 54). Part of the increase in prices of primary food articles could be attributed to this increase in minimum support price.
VI.25 Inflation in fuel group is driven by the trends in international crude oil prices. As international crude prices declined between July 2008 and March 2009, domestic prices of freely priced petroleum products followed the trends in international prices and declined substantially. The monthly average Indian basket price for crude oil declined sharply from US $ 132.3 per barrel in July 2008 to US $ 41.2 per barrel in December 2008. Against this backdrop, the Government cut the price of petrol by Rs.5 per litre and diesel by Rs.2 per litre effective from December 6, 2008. As the international crude oil prices (Indian basket) continued to remain around US $ 40 per barrel the Government effected another cut in the price of petrol by Rs.5 per litre, diesel by Rs.2 per litre and LPG for domestic use by Rs.25 per cylinder effective January 29, 2009. Consequently, the fuel group inflation turned negative by March 2009. Reflecting the base effect of upward revision of administered prices in June 2008, the fuel group inflation declined further and was at -10.0 per cent as on July 11, 2009.
Table 54: Minimum Support Price/Procurement Price for Crops |
Commodity/Year |
(Rs. per quintal) |
Variation (per cent) |
2006-07 |
2007-08 |
2008-09 |
2007-08 |
2008-09 |
1 |
2 |
3 |
4 |
5 |
6 |
Paddy (Common) (Procurement price) |
580a |
645b |
850c |
11.2 |
31.8 |
Wheat (Procurement price) |
750b |
1000.0 |
1080.0 |
33.3 |
8.0 |
Coarse cereals (Jowar, Bajra & Ragi) |
540.0 |
600.0 |
840.0 |
11.1 |
40.0 |
Sugarcane
(Statutory minimum price) |
80.3 |
81.2 |
81.2 |
1.0 |
0.0 |
Cotton (F-414/H-777) |
1770.0 |
1800.0 |
2500.0 |
1.7 |
38.9 |
Soyabean (Black) |
900.0 |
910.0 |
1350.0 |
1.1 |
48.4 |
Copra (milling) |
3590.0 |
3620.0 |
3660.0 |
0.8 |
1.1 |
a: An additional incentive bonus of Rs.40 per quintal is payable on procurement between January 10, 2006 and March 31, 2007.
b: An additional incentive bonus of Rs.100 per quintal is payable over the Minimum Support Price(MSP).
c: Bonus of Rs.50 per quintal is payable over the MSP.
Source : Economic Survey, Government of India, 2008-09. |
VI.26 International crude prices (WTI) recovered from the March 2009 levels and reached around US$ 70 per barrel by end-June 2009. Freely priced products under fuel group recorded corresponding increase. Among the various freely priced petroleum products, prices have increased by 46 per cent in case of aviation turbine fuel, 39 per cent in case of naphtha, 31 per cent in case of furnace oil, 23 per cent in the case of light diesel oil since end-March, 2009 (as on July 11, 2009). The Government also announced hikes in administered prices of petrol (by Rs.4 per litre) and diesel (by Rs.2 per litre) effective from July 2, 2009 as under-recoveries of oil companies increased on account of the increase in international crude prices. The direct impact of this increase was reflected in increase of WPI for the week ended July 4, 2009.
VI.27 Manufactured products inflation, year-on-year, has also declined since March 2009 reflecting the base effect and turned negative on July 11, 2009 (-0.05 per cent). The decline in inflation under manufactured group is largely driven by the year-on-year decline in prices of iron and steel, edible oils, man-made fibre and electrical machinery. Prices of sugar and cotton textiles, however, continued to register high annual inflation. During the first quarter of 2009-10, manufactured product groups registered increase in prices driven by the increase in manufactured food products as prices of sugar, oil cakes, drugs and medicines, and cement increased over end-March 2009.
VI.28 Since August 2008, edible oils, oil cakes prices declined reflecting the effect of fiscal measures as well as easing international prices on the back of projected increase in global production. However, according to the Fourth Advance Estimates for 2008-09, domestic oilseeds crop is expected to decline by 5 per cent over the previous year. Moreover, the global prices have increased in recent months on account of the shortage in supply. Reflecting these, oil seeds and oil cakes prices have increased over end-March 2009.
VI.29 Domestic iron and steel prices continued to remain low (-21.0 per cent (y-o-y) as on July 11, 2009). This decline in domestic iron and steel prices could be attributed to declining global prices, expected deceleration in demand, both domestic and external, as well as various fiscal measures in the form of reductions in customs duties and imposition of export duties on various steel items announced by the Government since April 2008.
VI.30 Overall, the negative WPI inflation (y-o-y) has been on account of the sharp decline in fuel group and manufactured products inflation, while prices of primary articles continue to remain positive and strong.
Consumer Price Inflation
VI.31 Inflation based on y-o-y variation in consumer price indices (CPIs) has increased since June 2008, mainly due to increase in the prices of food, fuel and services (represented by the ‘miscellaneous’ group). Various measures of consumer price inflation remained high in the range of 8.6-11.5 per cent during May/June 2009 as compared with 7.3-8.8 per cent in June 2008 and 8.0-9.7 per cent in March 2009 (Table 55). The higher order increase in consumer price inflation as compared to WPI inflation in recent months could be attributed to the higher prices of food articles, the weights of which are higher in CPIs. Moreover, the miscellaneous group in CPIs, which do not form part of the WPI (having weight in the range of 11.9 per cent to 24 per cent in various CPIs), exhibited significant price pressures, causing part of the divergence. Similarly, metals group in WPI, which does not form part of the CPI group has exhibited significant negative inflation, thereby accentuating the overall difference between CPIs and WPI. Also, there is usually a lag in the movement of CPI inflation in relation to the WPI inflation.
Table 55: Consumer Price Inflation - Major Groups |
(Year-on-year variation in per cent) |
CPI Measure |
Weight |
Mar-07 |
Mar-08 |
Jun-08 |
Sep-08 |
Dec-08 |
Mar-09 |
Apr-09 |
May-09 |
Jun-09 |
1 |
2 |
3 |
4 |
5 |
6 |
7 |
8 |
9 |
10 |
11 |
CPI-IW (Base: 2001=100) |
General |
100.0 |
6.7 |
7.9 |
7.7 |
9.8 |
9.7 |
8.0 |
8.7 |
8.6 |
– |
Food Group |
46.2 |
12.2 |
9.3 |
10.5 |
13.1 |
13.1 |
10.6 |
10.4 |
11.7 |
- |
Pan, Supari etc. |
2.3 |
4.4 |
10.9 |
7.1 |
7.8 |
8.5 |
8.3 |
6.7 |
7.5 |
- |
Fuel and Light |
6.4 |
3.2 |
4.6 |
8.4 |
9.1 |
9.7 |
7.4 |
6.6 |
5.9 |
- |
Housing |
15.3 |
4.1 |
4.7 |
4.7 |
3.8 |
3.8 |
6.0 |
6.0 |
6.0 |
- |
Clothing, Bedding etc. |
6.6 |
3.7 |
2.6 |
2.5 |
2.5 |
4.2 |
5.0 |
4.2 |
4.1 |
- |
Miscellaneous |
23.3 |
3.3 |
6.3 |
6.2 |
7.6 |
8.3 |
7.4 |
7.4 |
7.4 |
- |
CPI-UNME (Base: 1984-85=100) |
General |
100.0 |
7.6 |
6.0 |
7.3 |
9.5 |
9.8 |
9.3 |
8.8 |
9.7 |
– |
Food Group |
47.1 |
10.9 |
7.8 |
9.6 |
13.2 |
13.4 |
12.2 |
11.1 |
12.9 |
- |
Fuel and Light |
5.5 |
6.4 |
4.6 |
5.3 |
6.2 |
7.7 |
5.9 |
6.7 |
5.8 |
- |
Housing |
16.4 |
5.6 |
4.0 |
3.8 |
3.5 |
3.5 |
5.8 |
6.0 |
6.0 |
- |
Clothing, Bedding etc. |
7.0 |
3.6 |
4.3 |
3.4 |
3.1 |
2.7 |
3.3 |
4.2 |
4.2 |
- |
Miscellaneous |
24.0 |
4.4 |
4.8 |
6.6 |
8.4 |
9.3 |
8.6 |
7.6 |
8.1 |
- |
CPI-AL (Base: 1986-87=100) |
General |
100.0 |
9.5 |
7.9 |
8.8 |
11.0 |
11.1 |
9.5 |
9.1 |
10.2 |
11.5 |
Food Group |
69.2 |
11.8 |
8.5 |
9.6 |
12.0 |
11.9 |
9.7 |
9.1 |
11.2 |
12.4 |
Pan, Supari etc. |
3.8 |
5.7 |
10.4 |
11.2 |
12.8 |
13.7 |
15.3 |
14.5 |
14.4 |
14.2 |
Fuel and Light |
8.4 |
6.9 |
8.0 |
8.9 |
10.2 |
11.3 |
11.5 |
10.9 |
10.6 |
11.0 |
Clothing, Bedding etc. |
7.0 |
3.5 |
1.8 |
3.1 |
6.0 |
7.0 |
7.4 |
7.9 |
7.6 |
8.3 |
Miscellaneous |
11.7 |
6.8 |
6.1 |
6.5 |
7.1 |
7.0 |
6.5 |
6.2 |
6.6 |
6.1 |
CPI-RL (Base: 1986-87=100) |
General |
100.0 |
9.2 |
7.6 |
8.7 |
11.0 |
11.1 |
9.7 |
9.1 |
10.2 |
11.3 |
Food Group |
66.8 |
11.5 |
8.2 |
9.6 |
12.0 |
11.9 |
10.0 |
9.1 |
11.2 |
12.4 |
Pan, Supari etc. |
3.7 |
5.7 |
10.6 |
10.9 |
12.5 |
13.4 |
15.0 |
14.0 |
14.1 |
14.1 |
Fuel and Light |
7.9 |
6.9 |
8.0 |
8.9 |
10.5 |
11.3 |
11.5 |
10.9 |
10.6 |
11.0 |
Clothing, Bedding etc. |
9.8 |
3.1 |
2.8 |
4.1 |
6.5 |
7.3 |
8.2 |
8.4 |
8.3 |
8.8 |
Miscellaneous |
11.9 |
6.3 |
6.2 |
6.8 |
7.4 |
7.5 |
6.7 |
6.2 |
6.4 |
6.2 |
Memo: |
|
|
|
|
|
|
|
|
|
|
WPI Inflation (End of period) |
|
5.9 |
7.7 |
12.0 |
12.1 |
5.9 |
0.8 |
1.7 |
0.1 |
-1.6 |
GDP Deflator based Inflation* |
|
5.5 |
4.9 |
8.0 |
10.6 |
8.3 |
7.8 |
- |
- |
- |
* : Data for March pertain to full year.
IW : Industrial Workers.
UNME : Urban Non-Manual Employees.
AL : Agricultural Labourers. RL : Rural Labourers. |
VI.32 Overall, the current negative WPI inflation largely reflects the base effect of sharp increases in prices recorded a year ago. The momentum of WPI since end-March 2009, however, indicates the existence of price pressures largely on account of increases in international commodity prices during the first quarter of 2009-10 and changing domestic supply conditions largely caused by the delay in the progress of South-West monsoon. Consumer price inflation and prices of food articles continue to remain firm; inflation expectations, therefore, are not moderating commensurately with decline in WPI inflation. |


