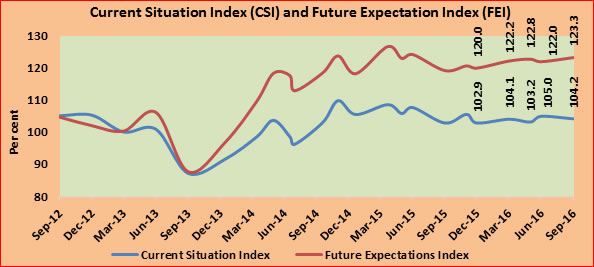
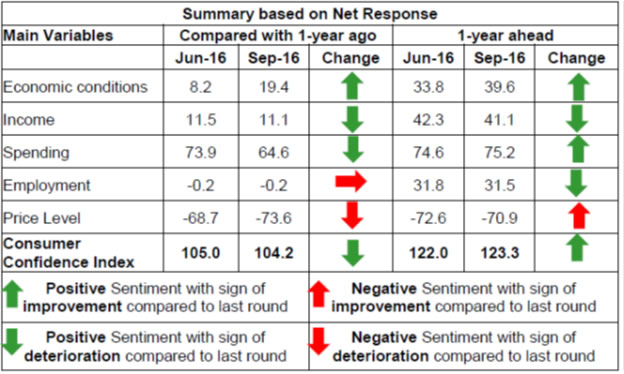
Strong Improvement in General Economic Conditions in September 2016 The Consumer Confidence Survey provides an assessment of respondents’ perceptions on general economic conditions and their financial situation during the current period and a year ahead. The current situation is compared with the position a year ago and the outlook for a year ahead is on the basis of current situation. The survey captures qualitative information on a three-point scale, i.e., improve, remain the same or worsen, from respondents spread across six metropolitan cities viz. Bengaluru, Chennai, Hyderabad, Kolkata, Mumbai and New Delhi. In the latest Consumer Confidence Survey, field work was carried out during August 26, 2016 to September 09, 2016. The salient findings of the survey, based on the responses of around 5,000 respondents are presented below. Highlights: I. Current Situation Index (CSI) slid down marginally during September 2016 round of the survey mainly due to decrease in the net response of prices levels and spending perceptions. Future Expectations Index (FEI), however, improved by 1.3 percentage points and reached 123.3 in the current round of the survey as compared to June 2016 round of the survey due to higher perception on future economic conditions and price expectations. II. The respondents in September 2016 round of the survey indicated strong improvement in the general economic conditions, as measured by net response, both for the current as well as one-year ahead period. The net response increased by 11.2 and 5.8 percentage points for the current and one-year ahead periods, respectively. III. Perception of the respondents on current spending deteriorated in September 2016 round of the survey with net response declining by 9.3 percentage points as compared to June 2016 round of the survey. However, outlook on future spending continued to be strong as more than 79.0 per cent respondents expected increase in spending for the one-year ahead period. IV. Net response on current as well as future spending on non-essential items also improved substantially - by around 18.0 percentage points - during this round of the survey as compared to June 2016 round of the survey. V. Current sentiments on price levels showed deterioration in the September 2016 round of the survey, while price expectation for one-year ahead period showed improvement, albeit moderately. Current inflation perception as well as one-year ahead inflation expectations improved substantially in September 2016 round of the survey compared with June 2016 round.
| Table 1: Perceptions on Economic Conditions | | (Percentage responses) | | | Compared with 1-year ago | 1-year ahead | | Dec-15 | Mar-16 | Jun-16 | Sep-16 | Dec-15 | Mar-16 | Jun-16 | Sep-16 | | Improved/ Will improve | 38.0 | 39.9 | 40.2 | 44.6 | 51.0 | 54.6 | 54.2 | 57.7 | | Remained the same/ Will remain the same | 30.9 | 30.3 | 27.9 | 30.1 | 27.6 | 27.2 | 25.5 | 24.3 | | Worsen/ Will worsen | 31.1 | 29.8 | 31.9 | 25.3 | 21.4 | 18.2 | 20.4 | 18.0 | | Net Response | 7.0 | 10.1 | 8.2 | 19.4 | 29.6 | 36.4 | 33.8 | 39.6 |
| Table 2: Perceptions on Income | | (Percentage responses) | | | Compared with 1-year ago | 1-year ahead | | Dec-15 | Mar-16 | Jun-16 | Sep-16 | Dec-15 | Mar-16 | Jun-16 | Sep-16 | | Increased/Will Increase | 28.7 | 31.3 | 29.9 | 31.2 | 49.1 | 52.1 | 51.2 | 52.3 | | Remained the same/ Will remain the same | 50.2 | 48.9 | 51.8 | 48.6 | 40.4 | 39.3 | 39.9 | 36.4 | | Decreased/ Will Decrease | 21.1 | 19.8 | 18.4 | 20.2 | 10.5 | 8.6 | 8.9 | 11.3 | | Net Response | 7.7 | 11.6 | 11.5 | 11.1 | 38.6 | 43.5 | 42.3 | 41.1 |
| Table 3: Perceptions on Spending | | (Percentage responses) | | | Compared with 1-year ago | 1-year ahead | | Dec-15 | Mar-16 | Jun-16 | Sep-16 | Dec-15 | Mar-16 | Jun-16 | Sep-16 | | Increased/ Will Increase | 78.7 | 78.0 | 82.7 | 70.3 | 79.3 | 78.5 | 82.2 | 79.1 | | Remained the same/ Will remain the same | 9.8 | 9.9 | 8.4 | 24.1 | 10.1 | 10.6 | 10.2 | 17.0 | | Decreased/ Will Decrease | 11.5 | 12.1 | 8.8 | 5.7 | 10.6 | 11.0 | 7.6 | 3.9 | | Net Response | 67.2 | 65.9 | 73.9 | 64.6 | 68.6 | 67.5 | 74.6 | 75.2 |
| Table 4: Perceptions on Spending-Essential Items | | (Percentage responses) | | | Compared with 1-year ago | 1-year ahead | | Dec-15 | Mar-16 | Jun-16 | Sep-16 | Dec-15 | Mar-16 | Jun-16 | Sep-16 | | Increased/Will Increase | 81.4 | 79.6 | 83.0 | 79.1 | 81.5 | 78.6 | 81.1 | 82.5 | | Remained the same/ Will remain the same | 9.0 | 9.3 | 8.2 | 16.9 | 9.4 | 11.9 | 10.6 | 12.7 | | Decreased/ Will Decrease | 9.6 | 11.1 | 8.8 | 4.0 | 9.1 | 9.6 | 8.3 | 4.8 | | Net Response | 71.8 | 68.5 | 74.3 | 75.1 | 72.4 | 69.0 | 72.8 | 77.6 |
| Table 5: Perceptions on Spending-Non-Essential Items | | (Percentage responses) | | | Compared with 1-year ago | 1-year ahead | | Dec-15 | Mar-16 | Jun-16 | Sep-16 | Dec-15 | Mar-16 | Jun-16 | Sep-16 | | Increased/Will Increase | 45.3 | 37.7 | 43.9 | 50.2 | 49.2 | 44.7 | 51.2 | 60.6 | | Remained the same/ Will remain the same | 28.9 | 31.7 | 32.3 | 37.6 | 28.6 | 33.2 | 30.3 | 29.5 | | Decreased/ Will Decrease | 25.8 | 30.6 | 23.8 | 12.2 | 22.2 | 22.1 | 18.5 | 9.9 | | Net Response | 19.5 | 7.1 | 20.1 | 38.0 | 27.1 | 22.6 | 32.7 | 50.7 |
| Table 6: Perceptions on Employment | | (Percentage responses) | | | Compared with 1-year ago | 1-year ahead | | Dec-15 | Mar-16 | Jun-16 | Sep-16 | Dec-15 | Mar-16 | Jun-16 | Sep-16 | | Increased/Will Increase | 34.0 | 34.3 | 35.6 | 31.7 | 51.6 | 50.4 | 51.1 | 50.5 | | Remained the same/ Will remain the same | 34.7 | 31.1 | 28.7 | 36.4 | 29.8 | 31.4 | 29.6 | 30.5 | | Decreased/ Will Decrease | 31.3 | 34.6 | 35.7 | 31.9 | 18.7 | 18.1 | 19.3 | 19.0 | | Net Response | 2.6 | -0.3 | -0.2 | -0.2 | 32.9 | 32.3 | 31.8 | 31.5 |
| Table 7: Perceptions on price level | | (Percentage responses) | | | Compared with 1-year ago | 1-year ahead | | Dec-15 | Mar-16 | Jun-16 | Sep-16 | Dec-15 | Mar-16 | Jun-16 | Sep-16 | | Gone up/ Will go up | 79.5 | 77.3 | 78.1 | 78.2 | 78.9 | 78.6 | 80.5 | 77.8 | | Remained almost Unchanged | 10.9 | 12.4 | 12.5 | 17.2 | 11.7 | 11.7 | 11.5 | 15.2 | | Gone down/ Will go down | 9.6 | 10.4 | 9.4 | 4.6 | 9.4 | 9.7 | 8.0 | 6.9 | | Net Response | -70.0 | -66.9 | -68.7 | -73.6 | -69.5 | -68.8 | -72.6 | -70.9 | | Note: Perceptions of increase in prices is considered to be negative sentiments and decrease in prices is considered to be positive sentiments. The net responses are therefore, negative |
| Table 8: Perceptions on rate of change in price levels (Inflation) | | (Percentage responses) | | | Compared with 1-year ago | 1-year ahead | | Dec-15 | Mar-16 | Jun-16 | Sep-16 | Dec-15 | Mar-16 | Jun-16 | Sep-16 | | Gone up/ Will go up | 86.3 | 82.7 | 85.3 | 61.8 | 85.4 | 82.4 | 83.3 | 64.3 | | Remained almost Unchanged | 10.8 | 13.9 | 12.4 | 22.4 | 11.7 | 13.2 | 13.0 | 22.4 | | Gone down/ Will go down | 2.9 | 3.4 | 2.3 | 15.8 | 2.8 | 4.4 | 3.7 | 13.3 | | Net Response | -83.4 | -79.3 | -83.0 | -45.9 | -82.6 | -78.0 | -79.6 | -51.0 |
|  IST,
IST,


