International
Financial Markets
During 2006-07 (April-March), short-term interest
rates increased further in major advanced economies as well as emerging market
economies (EMEs) (Table 40) as many central banks continued
monetary tightening to contain inflation and stabilise inflationary expectations
as detailed in the previous chapter. During the year, the US Federal Reserve increased
the fed funds rate target twice by 25 basis points each in May 2006 and June 2006.
It has since then paused. The European Central Bank increased its policy rate
five times by 25 basis points each in June 2006, August 2006, October 2006, December
2006 and March 2007. The UK also raised its policy rate thrice by 25 basis points
each in August 2006, November 2006 and January 2007. Other advanced economies
such as Australia, Canada, Japan, New Zealand, Norway, Sweden and Switzerland
also increased their policy rates during the year. The increase in short-term
rates in the US during 2006-07 was lower than other major advanced economies reflecting
the pause by the US Fed since end-June 2006. Central banks in many EMEs such as
China, South Africa, South Korea, Taiwan and Turkey also increased their policy
rates. Other EMEs such as Israel and Thailand initially raised their policy rates
during the year but subsequently cut their policy rates to support growth; Brazil
Table
40: Short-term Interest Rates | (Per
cent) | Region/Country
1 | At end of |
March | March | June | September | December | March |
2005 | 2006 | 2006 | 2006 | 2006 | 2007 |
2 | 3 | 4 | 5 | 6 | 7 |
Advanced Economies | | | | | | |
Euro Area | 2.15 | 2.80 | 3.06 | 3.38 | 3.70 | 3.91 |
Japan | | 0.02 | 0.04 | 0.24 | 0.34 | 0.44 | 0.57 |
Sweden | | 1.97 | 1.99 | 2.23 | 2.55 | 2.94 | 3.21 |
UK | | 4.95 | 4.58 | 4.70 | 5.02 | 5.27 | 5.55 |
US | | 2.90 | 4.77 | 5.48 | 5.21 | 5.25 | 5.23 |
Emerging Market Economies | | | | | | |
Argentina | | 4.56 | 9.63 | 10.00 | 10.38 | 10.63 | 9.63 |
Brazil | | 19.25 | 16.54 | 15.18 | 14.17 | 13.19 | 12.68 |
China | | 2.25 | 2.40 | 3.00 | 2.95 | 2.88 | 2.86 |
Hong Kong | 2.79 | 4.47 | 4.67 | 4.20 | 3.97 | 4.17 |
India | | 5.37 | 6.11 | 6.36 | 6.60 | 7.18 | 7.98 |
Malaysia | | 2.82 | 3.51 | 3.93 | 3.85 | 3.73 | 3.64 |
Philippines | 7.25 | 7.38 | 8.00 | 7.63 | 6.56 | 5.31 |
Singapore | 2.06 | 3.44 | 3.50 | 3.44 | 3.44 | 3.00 |
South Korea | 3.54 | 4.26 | 4.57 | 4.63 | 4.73 | 4.94 |
Thailand | | 2.64 | 5.10 | 5.40 | 5.40 | 5.20 | 4.45 |
Note : Data for India refer
to 91-day Treasury Bills rate and for other countries 3-month money market rates.
Source : The Economist. | 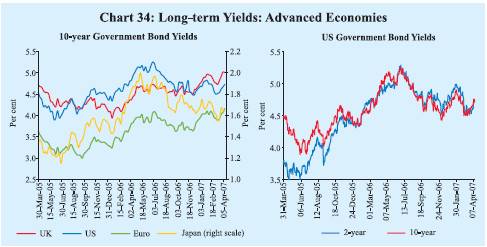
continued
to reduce policy rates throughout the year. Short-term interest rates, therefore,
declined in such EMEs.
Long-term Government bond yields exhibited mixed
trends in major advanced economies during 2006-07. During the year, 10-year yield
declined by 18 basis points in the US and 12 basis points in Japan but increased
by 56 basis points in the UK and 32 basis points in the euro area. The decline
in the yield in the US could be attributed to easing of crude oil prices, weakening
of economic growth and pause in monetary tightening by the Federal Reserve (Chart
34). The hardening of yields in the euro area and the UK could be attributed
to higher short-term rates in the wake of further tightening and improved growth
prospects. Since early June 2006, 10-year US bond yields have generally remained
below those on 2-year bonds. Spreads on risky corporate debt in major advanced
economies fell during the year, reaching record lows in the first quarter of 2007
on the back of strong risk appetite and sound corporate balance sheets. Spreads
on emerging market debt also eased to record lows in the first quarter of 2007.
Global equity markets recorded further gains during 2006-07, interspersed
with intermittent corrections (Chart 35). Equity markets
initially registered losses between mid-May and early June 2006 in a number of
economies reflecting concerns about growing inflationary pressures and concomitant
increase in risk aversion. Global equity markets recovered part of the losses
during the second and third quarters of 2006-07 reflecting strong corporate results,
decline in crude oil prices, better than expected growth in the euro area, strong
merger and acquisition activity and pause by the US Federal Reserve. Stock markets
in a number of economies declined on December 19, 2006 following the decision
of the Bank of Thailand (BoT) to impose unremunerated reserve requirement (URR) 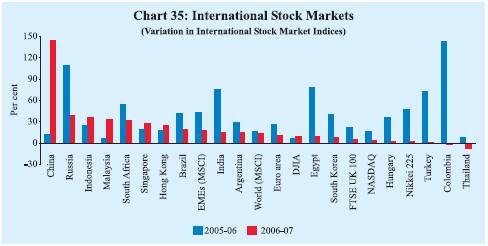
of
30 per cent on short-term capital flows to discourage speculative short-term capital
flows, with the market in Thailand, in particular, declining by 14.8 per cent
on December 19, 2006 (over its level on the previous day). The markets, however,
recovered some of these losses the next day as the BoT exempted investments in
stock markets from the URR. During the last week of February 2007, equity markets
in many advanced as well as EMEs fell. The Chinese stock markets declined by 9.0
per cent on February 27, 2007 but recovered some of these losses in the subsequent
days. The equity markets in the US and several other developed and EMEs declined
again in March 2007 on concerns over sub-prime mortgage lending and slowdown in
the US economy. Notwithstanding these corrections during the course of the year,
the MSCI World and MSCI emerging markets indices at end-March 2007 were higher
by 13.4 per cent and 18.3 per cent, respectively, over their levels at end-March
2006. These gains were led by stock markets in China (143.6 per cent), followed
by Russia (38.4 per cent), Indonesia (36.1 per cent), Malaysia (32.4 per cent),
South Africa (32.0 per cent), Singapore (27.0 per cent) and the Hong Kong (24.2
per cent).
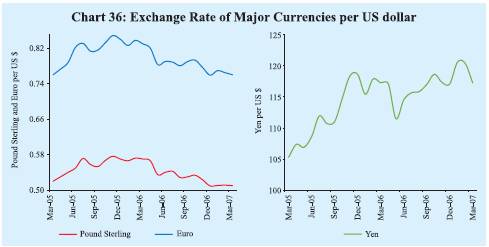
In the foreign exchange market, the US dollar depreciated
against the major currencies during 2006-07, reflecting narrowing of interest
rate differentials, moderation of activity in the US and robust growth in the
euro area and Japan (Chart 36). Between end-March 2006
and end-March 2007, the US dollar depreciated by 11.4 per cent against the Pound
sterling and 9.1 per cent against the euro but appreciated by 0.2 per cent against
the yen. Amongst Asian currencies, the US dollar depreciated by 6.2 per cent against
the Malaysian ringgit, 9.9 per cent against the Thai baht, 3.5 per cent against
the Chinese yuan and 3.6 per cent against the Korean won over the same period.
Between end-March 2006 and end-March 2007, the euro appreciated by 10.0 per cent
against
the US dollar and 10.3 per cent against the yen, but depreciated by 2.5 per cent
against the Pound sterling. Over the same period, the euro appreciated by 3.2
per cent against the Malaysian ringgit, 6.1 per cent against the Chinese yuan
and 6.0 per cent against the Korean won; however, it depreciated by 0.9 per cent
against Thai baht. The Japanese yen recorded depreciation against almost all the
major currencies, i.e., by 0.2 per cent against the US dollar, 9.3 per
cent against the euro, 11.6 per cent against the Pound sterling, 10.1 per cent
against the Thai baht, 6.4 per cent against the Malaysian ringgit, 3.9 per cent
against the Korean won and 3.7 per cent against the Chinese yuan over the same
period.
Domestic Financial Markets
Indian financial
markets remained generally orderly for most part of 2006-07. There were, however,
some spells of volatility at different points of time during the year reflecting
developments in liquidity conditions on account of large and sudden changes in
capital flows and cash balances of the Governments. Interest rates in various
segments increased during the year. The call money rate edged up during the year
in tandem with movements in policy rates. The call rate remained mostly within
the corridor set by the Reserve Bank's repo and reverse repo rates during April-November
2006. In the subsequent months, there were a few brief episodes (last week of
December 2006 and second half of March 2007) of higher volatility when the call
rate exceeded the repo rate significantly. Interest rates in the collateralised
segment of the overnight money market also hardened, but remained below the call
rate during the year. In the foreign exchange market, the Indian rupee exhibited
two-way movements with a strengthening bias since mid-July 2006.
Table
41: Domestic Financial Markets at a Glance | Month | Call
Money | Government Securities | Foreign
Exchange | Liquidity
Management | Equity |
Average Daily Turnover
(Rs. crore) | Average
Call Rates*
(Per cent) | Average
Turnover in
Govt.
Securities
(Rs. crore)+ | Average10-Year
Yield@
(Per cent) | Average Daily
Inter- bank Turnover
(US $ million) | Average
Exchange Rate(Rs. per US $) | RBI’s
net
Foreign Currency Sales (-)/Purchases
(+)
(US $ million) | Average
Forward Premia3-month(Per cent) | Average
MSS Out- standing#(Rs. crore) | Average
Daily Reverse Repo
(LAF)
Out- standing
(Rs. crore) | Average
Daily BSE Turnover
(Rs. crore) | Average
Daily
NSE Turnover
(Rs. crore) | Average
BSE Sensex** | Average S&P
CNX
Nifty** | 1 | | 2 | 3 | 4 | 5 | 6 | 7 | 8 | 9 | 10 | 11 | 12 | 13 | 14 | 15 |
2004-05 | 14,170 | 4.65 | 4,826 | 6.22 | 8,892 | 44.93 | 20,847## | 1.66 | 46,445 | 35,592 | 2,050 | 4,506 | 5741 | 1805 |
2005-06 | 17,979 | 5.60 | 3,643 | 7.12 | 12,738 | 44.27 | 8,143## | 1.60 | 58,792 | 10,986 | 3,248 | 6,256 | 8295 | 2518 |
April | | 17,213 | 4.77 | 3,001 | 7.02 | 9,880 | 43.74 | 0 | 1.96 | 65,638 | 30,675 | 1,890 | 4,136 | 6379 | 1987 |
May | | 15,269 | 4.99 | 3,805 | 7.11 | 10,083 | 43.49 | 0 | 1.57 | 68,539 | 22,754 | 1,971 | 3,946 | 6483 | 2002 |
June | | 20,134 | 5.10 | 6,807 | 6.88 | 10,871 | 43.58 | -104 | 1.40 | 70,651 | 13,916 | 2,543 | 4,843 | 6926 | 2134 |
July | | 20,046 | 5.02 | 3,698 | 7.13 | 11,003 | 43.54 | 2,473 | 1.56 | 70,758 | 10,754 | 3,095 | 6,150 | 7337 | 2237 |
August | 16,158 | 5.02 | 4,239 | 7.04 | 11,749 | 43.62 | 1,552 | 0.69 | 71,346 | 34,832 | 3,452 | 6,624 | 7726 | 2358 |
September | 16,292 | 5.05 | 5,207 | 7.04 | 11,040 | 43.92 | 0 | 0.62 | 67,617 | 30,815 | 3,871 | 6,923 | 8272 | 2512 |
October | 17,164 | 5.12 | 2,815 | 7.14 | 13,087 | 44.82 | 0 | 0.69 | 68,602 | 18,608 | 2,955 | 6,040 | 8220 | 2487 |
November | 22,620 | 5.79 | 3,314 | 7.10 | 11,228 | 45.73 | 0 | 0.67 | 67,041 | 3,268 | 2,635 | 5,480 | 8552 | 2575 |
December | 21,149 | 6.00 | 2,948 | 7.13 | 13,808 | 45.64 | -6,541 | 1.51 | 52,040 | 1,452 | 3,516 | 6,814 | 9162 | 2773 |
January | 17,911 | 6.83 | 3,094 | 7.15 | 16,713 | 44.40 | 0 | 2.60 | 40,219 | -15,386 | 3,966 | 7,472 | 9540 | 2893 |
February | 13,497 | 6.95 | 2,584 | 7.32 | 15,798 | 44.33 | 2,614 | 2.85 | 33,405 | -13,532 | 3,688 | 7,125 | 10090 | 3019 |
March | | 18,290 | 6.58 | 2,203 | 7.40 | 17,600 | 44.48 | 8,149 | 3.11 | 29,652 | -6,319 | 5,398 | 9,518 | 10857 | 3236 |
2006-07 | 21,725 | 7.22 | 4,863 | 7.78 | 18,540 | 45.25 | 24,517## | 2.14 | 37,698 | 21,973 | 3,877 | 7,883 | 12319 | 3585 |
April | | 16,909 | 5.62 | 3,685 | 7.45 | 17,712 | 44.95 | 4,305 | 1.31 | 25,709 | 46,088 | 4,860 | 9,854 | 11742 | 3494 |
May | | 18,074 | 5.54 | 3,550 | 7.58 | 18,420 | 45.41 | 504 | 0.87 | 26,457 | 59,505 | 4,355 | 9,155 | 11599 | 3437 |
June | | 17,425 | 5.73 | 2,258 | 7.86 | 15,310 | 46.06 | 0 | 0.73 | 31,845 | 48,610 | 3,261 | 6,828 | 9935 | 2915 |
July | | 18,254 | 5.86 | 2,243 | 8.26 | 14,325 | 46.46 | 0 | 0.83 | 36,936 | 48,027 | 2,605 | 5,652 | 10557 | 3092 |
August | 21,294 | 6.06 | 5,786 | 8.09 | 15,934 | 46.54 | 0 | 1.22 | 40,305 | 36,326 | 2,869 | 5,945 | 11305 | 3306 |
September | 23,665 | 6.33 | 8,306 | 7.76 | 18,107 | 46.12 | 0 | 1.31 | 40,018 | 25,862 | 3,411 | 6,873 | 12036 | 3492 |
October | 26,429 | 6.75 | 4,313 | 7.65 | 16,924 | 44.47 | 0 | 1.67 | 41,537 | 12,983 | 3,481 | 6,919 | 12637 | 3649 |
November | 25,649 | 6.69 | 10,654 | 7.52 | 20,475 | 44.85 | 3,198 | 2.07 | 38,099 | 9,937 | 4,629 | 8,630 | 13416 | 3869 |
December | 24,168 | 8.63 | 5,362 | 7.55 | 19,932 | 44.64 | 1,818 | 3.20 | 38,148 | -1,713 | 4,276 | 8,505 | 13647 | 3918 |
January | 22,360 | 8.18 | 4,822 | 7.71 | 21,065
P | 44.33 | 2,830 | 4.22 | 39,553 | -10,738 | 4,380 | 8,757 | 13984 | 4037 |
February | 23,254 | 7.16 | 4,386 | 7.90 | 20,050
P | 44.16 | 11,862 | 3.71 | 40,827 | 648 | 4,680 | 9,483 | 14143 | 4079 |
March | | 23,217 | 14.07 | 2,991 | 8.00 | 24,231
P | 44.03 | – | 4.51 | 52,944 | -11,858 | 3,716 | 7,998 | 12850 | 3731 |
*: Average of daily weighted call money
borrowing rates.
+ : Average of daily outright turnover in Central
Government
dated securities.
@: Average of daily closing rates.
# : Average of weekly
outstanding MSS.
**: Average of daily closing indices.
## : Cumulative
for the financial year.
LAF: Liquidity Adjustment Facility.
BSE : Bombay
Stock Exchange Limited.
MSS: Market Stabilisation Scheme.
– : Not
available.
NSE: National Stock Exchange of India Ltd.
P : Provisional.
Note : In column 11, (-) indicates injection of liquidity, while
(+) indicates absorption of liquidity. | Yields in the
Government securities market hardened during the year and the yield curve flattened.
Banks' deposit and lending rates edged up, especially in the second half of the
year. The stock markets reached record highs during the year interspersed with
periodic corrections (Table 41). The primary market segment
of the capital market continued to exhibit buoyancy.
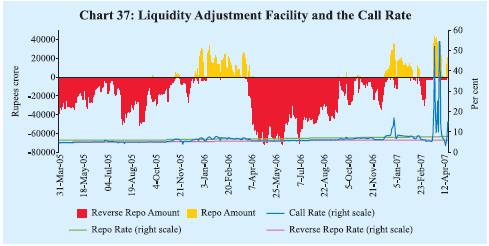
Money Market
Money market rates edged up during the year, broadly moving in line
with the policy rates, with intra-year movements depending upon the evolving liquidity
conditions. The call money rate was generally anchored close to the reverse repo
rate up to mid-September 2006 (Chart 37). Liquidity conditions
became relatively tighter in the second half of September 2006, inter alia,
on account of liquidity pressures emanating from advance tax outflows and festive
season currency demand coupled with high credit demand. The call rate crossed
the repo rate and touched 7.38 per cent on September 29, 2006. The call rate eased
below the repo rate by early October 2006 partly on account of reduction in Centre’s
surplus cash balances with the Reserve Bank and remained mostly within repo-reverse
repo corridor between end-October to second week of December 2006. The call rates
eased to near reverse repo levels by the last week of November 2006, before the
announcement on December 8, 2006 of a hike of 25 basis points each in the cash
reserve ratio (CRR) effective the fortnights beginning December 23, 2006 and January
6, 2007. The call rate again edged up from the second week of December 2006 crossing
the repo rate to touch 16.88 per cent on December 29, 2006 under the impact of
advance tax outflows and the CRR hike. The call rate eased from the elevated levels
in the first week of January 2007 on the back of improvement in liquidity conditions.
Notwithstanding an increase in the repo rate by 25 basis points on January 31,
2007 (reverse repo rate remained unchanged), the call rate eased further to around
6.5 per cent by the second week of February 2007 due to forex induced liquidity.
Following the announcement
(on
February 13, 2007) of the hike of 25 basis points each in the CRR effective the
fortnights beginning February 17, 2007 and March 3, 2007, the call rate again
firmed up to about 8.0 per cent by mid-February 2007 but quickly eased to around
6.1 per cent by end-February 2007. It further declined to below the lower bound
of the corridor between March 5-15, 2007 as liquidity conditions eased. Modified
arrangements of liquidity 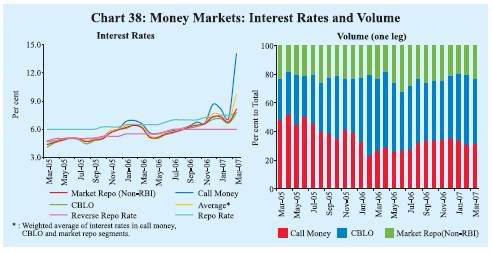
management
were put in place effective March 5, 2007 under which a flexible arrangement of
MSS auctions of dated securities was introduced along with a ceiling of Rs.3,000
crore under the LAF reverse repo (see Chapter III). The call money rate hardened
in the second half of March 2007 as liquidity conditions tightened due to advance
tax outflows, year-end considerations, sustained credit demand and asymmetric
distribution of Government securities holdings across the banks. The call rate
averaged 21.99 per cent during March 16-30, 2007 and reached an intra-year high
of 54.3 per cent as on March 30, 2007. The call rate eased to 3.3 per cent on
April 12, 2007 with the easing of liquidity conditions. It was 12.0 per cent on
April 18, 2007.
The interest rates in the collateralised segments of the
money market –the market repo (outside the LAF) and the Collateralised Borrowing
and Lending Obligation (CBLO) – increased in line with the call rate, and
continued to remain below the call rate during 2006-07. The rates in these segments
exhibited relative stability vis-à-vis the call rate. For the
financial year 2006-07, as a whole, the interest rates averaged 6.24 per cent
and 6.34 per cent in the CBLO and market repo segments, respectively, as compared
with 7.22 per cent in the call money market. The collateralised market is now
the predominant segment in the money market, accounting for about 70 per cent
of the total volume during 2006-07 (Chart 38 and Table 42).
Mutual funds and insurance companies are the major lenders in the CBLO market
with nationalised banks, primary dealers and non-financial companies being
the major borrowers. In the market repo segment, mutual funds and foreign banks
are the major provider of funds, while the foreign banks, private sector banks
and primary dealers are the major borrowers.
Table
42: Activity in Money Market Segments | (Rupees
crore) | | Average
Daily Volume (One Leg) | Commercial
Paper | Certificates
of Deposit Outstanding | Month | Call
Money Market | Repo Market
(Outside the LAF) | Collateralised
Borrowing and Lending Obligation(CBLO) | Term
Money Market | Out- standing | Amount
Issued | 1 | 2 | 3 | 4 | 5 | 6 | 7 | 8 |
2004-05 | 7,085 | 4,284 | 3,349 | 263 | 11,723 | 1,090 | 6,052 |
2005-06 | 8,990 | 5,296 | 10,020 | 417 | 17,285 | 3,140 | 27,298 |
April | 8,607 | 3,044 | 5,185 | 331 | 15,598 | 3,549 | 16,602 |
May | 7,635 | 3,422 | 6,117 | 273 | 17,182 | 3,824 | 17,689 |
June | 10,067 | 4,291 | 5,896 | 267 | 17,797 | 2,925 | 19,270 |
July | 10,023 | 4,526 | 7,646 | 359 | 18,607 | 3,360 | 20,768 |
August | 8,079 | 5,331 | 7,272 | 377 | 19,508 | 4,110 | 23,568 |
September | 8,146 | 4,718 | 8,572 | 558 | 19,725 | 2,519 | 27,641 |
October | 8,582 | 5,245 | 10,882 | 367 | 18,726 | 2,892 | 29,193 |
November | 11,310 | 6,415 | 10,248 | 459 | 18,013 | 2,483 | 27,457 |
December | 10,575 | 6,394 | 10,633 | 388 | 17,234 | 3,304 | 32,806 |
January | 8,956 | 6,149 | 12,817 | 545 | 16,431 | 1,937 | 34,521 |
February | 6,749 | 6,024 | 17,081 | 407 | 15,876 | 3,160 | 34,487 |
March | 9,145 | 7,991 | 17,888 | 669 | 12,718 | 2,813 | 43,568 |
2006-07 | 10,863 | 8,419 | 16,195 | 506 | 21,478 | 4,537 | 64,954 |
April | 8,455 | 5,479 | 16,329 | 447 | 16,550 | 6,065 | 44,059 |
May | 9,037 | 9,027 | 17,147 | 473 | 17,067 | 4,701 | 50,228 |
June | 8,713 | 10,563 | 13,809 | 628 | 19,650 | 4,981 | 56,390 |
July | 9,127 | 9,671 | 15,670 | 432 | 21,110 | 5,812 | 59,167 |
August | 10,647 | 7,764 | 15,589 | 510 | 23,299 | 6,460 | 65,621 |
September | 11,833 | 9,185 | 14,771 | 568 | 24,444 | 5,220 | 65,274 |
October | 13,214 | 9,721 | 16,964 | 466 | 23,171 | 3,373 | 65,764 |
November | 12,825 | 9,374 | 16,069 | 348 | 24,238 | 6,392 | 68,911 |
December | 12,084 | 7,170 | 15,512 | 481 | 23,536 | 3,080 | 68,619 |
January | 11,180 | 6,591 | 15,758 | 515 | 24,398 | 3,490 | 70,149 |
February | 11,627 | 7,794 | 19,063 | 467 | 21,167 | 2,763 | 72,795 |
March | 11,608 | 8,687 | 17,662 | 739 | 19,102
* | 2,106 | 92,468# |
* : As on March 15, 2007.
# : As on March 16, 2007. | Certificates of Deposit
The outstanding amount of certificates of deposit (CDs) more than doubled
from Rs.43,568 crore at end-March 2006 (4.8 per cent of aggregate deposits of
issuing banks) to Rs.92,468 crore (4.9 per cent) by March 16, 2007 as banks continued
to supplement their efforts at deposit mobilisation to support sustained credit
demand (Table 42 and Chart 39). The weighted average discount
rate (WADR) of CDs increased by 215 basis points during the year to 10.77 per
cent as on March 16, 2007. Mutual funds are amongst the major investors in the
CDs. Since CDs can be traded and easily liquidated, mutual funds find them quite
attractive.
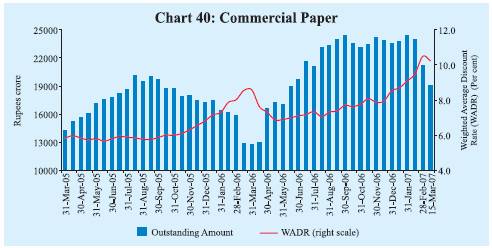
Commercial Paper
Issuances of commercial papers
(CPs) increased sharply in the first half of 2006-07, but fell during the second
half of the year. Outstanding CPs rose from 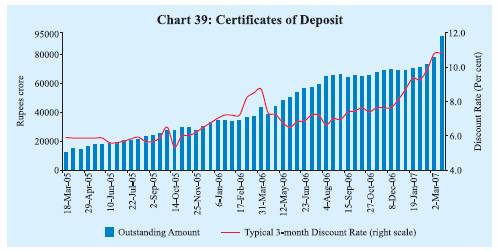
Rs.12,718
crore at end-March 2006 to Rs.24,444 crore as on September 30, 2006 before declining
to Rs.19,102 crore as on March 15, 2007 (Chart 40).
The weighted average discount rate (WADR) on CPs increased from 8.59 per cent
during the fortnight ended March 31, 2006 to 10.24 per cent during the fortnight
ended March 15, 2007 in tandem with the increase in the money market rates. The
discount rate on CPs moved from a range of 6.69-9.25 per cent during the fortnight
ended March 31, 2006 to 7.50-13.35 per cent during the fortnight ended March 15,
2007.
Leasing and finance companies continued to remain the pre-dominant issuers
of CPs in the absence of the access of these companies to public deposits (Table
43). 
Table
43: Commercial Paper – Major Issuers | (Rupees
crore) | Category of Issuer | End
of | | March | March | June | September | December | March
# | | 2005 | 2006 | 2006 | 2006 | 2006 | 2007 |
1 | 2 | 3 | 4 | 5 | 6 | 7 |
Leasing and Finance | 8,479 | 9,400 | 13,460 | 15,817 | 15,060 | 12,803 |
| (59.6) | (73.9) | (68.5) | (64.7) | (64.0) | (67.0) |
| | | | | | |
Manufacturing | 2,881 | 1,982 | 4,155 | 4,847 | 4,811 | 3,204 |
| (20.2) | (15.6) | (21.1) | (19.8) | (20.4) | (16.8) |
| | | | | | |
Financial Institutions | 2,875 | 1,336 | 2,035 | 3,780 | 3,665 | 3,095 |
| (20.2) | (10.5) | (10.4) | (15.5) | (15.6) | (16.2) |
| | | | | | |
Total | 14,235 | 12,718 | 19,650 | 24,444 | 23,536 | 19,102 |
| (100.0) | (100.0) | (100.0) | (100.0) | (100.0) | (100.0) |
| | | | | | |
#: As on March 15, 2007.
Note : Figures in parentheses are percentage shares in the total. |
Treasury Bills
The primary market yields on Treasury
Bills (TBs) increased in the range of 117-132 basis points during 2006-07. In
the first quarter of 2006-07, yields on Treasury Bills firmed up over concerns
of higher inflation, hike of fed funds rate target, larger issuances on account
of reintroduction of the Market Stabilisation Scheme (MSS) and the hike in the
repo and reverse repo rates by 25 basis points each effective June 9, 2006. After
remaining broadly unchanged during July-November 2006, yields on Treasury Bills
increased from December 2006 following hikes in the CRR and the repo rate (Chart
41). The yield spread between 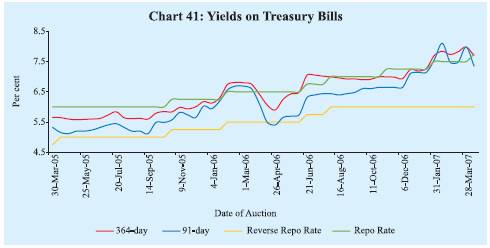
Table
44: Treasury Bills in the Primary Market | Month | Notified | Average
Implicit Yield at | Average
Bid-Cover Ratio | | Amount
(Rupees crore) | Minimum
Cut-off Price
(Per cent) | | | |
| | 91-day | 182-day
364-day | 91-day | 182-day | 364-day |
1 | 2 | 3 | 4 | 5 | 6 | 7 | 8 |
| | | | | | | |
2004-05 | 1,38,500
@ | 4.91 | – | 5.16 | 2.43 | – | 2.52 |
2005-06 | 1,55,500
@ | 5.68 | 5.82 | 5.96 | 2.64 | 2.58 | 2.45 |
April | 19,000 | 5.17 | 5.36 | 5.62 | 4.03 | 4.48 | 2.54 |
May | 15,000 | 5.19 | 5.35 | 5.58 | 3.30 | 3.37 | 2.29 |
June | 18,500 | 5.29 | 5.37 | 5.61 | 1.54 | 2.42 | 1.81 |
July | 11,500 | 5.46 | 5.67 | 5.81 | 1.21 | 1.79 | 1.68 |
August | 21,000 | 5.23 | 5.42 | 5.63 | 3.07 | 2.68 | 2.54 |
September | 23,000 | 5.24 | 5.37 | 5.70 | 1.52 | 1.45 | 1.61 |
October | 15,000 | 5.50 | 5.71 | 5.84 | 1.69 | 1.53 | 3.44 |
November | 11,000 | 5.76 | 5.85 | 5.96 | 2.12 | 1.92 | 2.30 |
December | 5,000 | 5.89 | 6.00 | 6.09 | 3.07 | 2.97 | 2.36 |
January | 5,000 | 6.25 | 6.22 | 6.21 | 2.86 | 2.83 | 2.72 |
February | 5,000 | 6.63 | 6.74 | 6.78 | 3.04 | 2.07 | 2.71 |
March | 6,500 | 6.51 | 6.66 | 6.66 | 4.17 | 3.43 | 3.36 |
2006-07 | 1,86,500@ | 6.64 | 6.91 | 7.01 | 1.97 | 2.00 | 2.66 |
April | 5,000 | 5.52 | 5.87 | 5.98 | 5.57 | 4.96 | 2.02 |
May | 18,500 | 5.70 | 6.07 | 6.34 | 1.88 | 1.84 | 1.69 |
June | 15,000 | 6.14 | 6.64 | 6.77 | 1.63 | 1.35 | 2.11 |
July | 16,500 | 6.42 | 6.75 | 7.03 | 1.82 | 1.55 | 3.12 |
August | 19,000 | 6.41 | 6.70 | 6.96 | 2.03 | 2.71 | 3.48 |
September | 15,000 | 6.51 | 6.76 | 6.91 | 1.35 | 1.80 | 2.92 |
October | 15,000 | 6.63 | 6.84 | 6.95 | 1.31 | 1.20 | 2.02 |
November | 18,500 | 6.65 | 6.92 | 6.99 | 1.33 | 1.22 | 2.49 |
December | 15,000 | 7.01 | 7.27 | 7.09 | 1.19 | 1.29 | 3.34 |
January | 19,000 | 7.28 | 7.45 | 7.39 | 1.02 | 1.35 | 1.74 |
February | 15,000 | 7.72 | 7.67 | 7.79 | 2.48 | 2.56 | 3.16 |
March | 15,000 | 7.68 | 7.98 | 7.90 | 2.08 | 2.15 | 3.87 |
@ : Total for the financial year.
Note : 1. 182-day TBs were reintroduced with effect from April
2005.
2. Notified amounts are inclusive of issuances under the Market Stabilisation
Scheme (MSS). | 364-day and 91-day TBs was 22 basis points
in March 2007, marginally higher than that in March 2006 (15 basis points) (Table
44). The notified amount of Rs.1,500 crore each for auctions of the 91-day
TBs under the MSS was not fully subscribed at some of the auctions during the
year, reflecting tight liquidity conditions. There was, however, no devolvement
on the PDs.
Foreign Exchange
Market
In the foreign exchange market, the Indian rupee exhibited
two-way movements during 2006-07 moving in a range of Rs.43.14–46.97 per
US dollar (Chart 42). The rupee initially depreciated against
the US dollar during the year, reaching Rs.46.97 on July 19, 2006, reflecting
higher crude oil prices, FII outflows and geo-political risks in the Middle East
region. The rupee, however, strengthened thereafter on the back of moderation
in crude oil prices, revival of FII inflows and weakness of the US dollar in the
international markets. The rupee appreciated further in the second half of March
2007 to reach Rs.43.14 per US dollar on March 28, 2007, due to increased supply
of dollars in the market. The exchange rate at Rs.43.60 per US dollar as on March
30, 2007 recorded an appreciation of 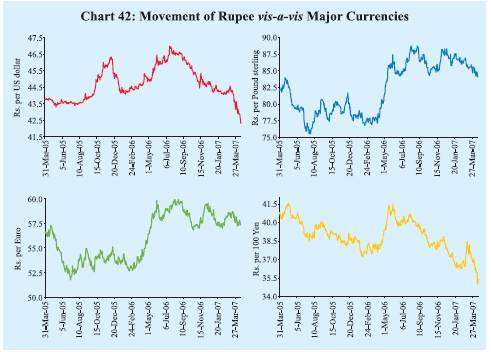
2.3
per cent over its level as on March 31, 2006 (Rs.44.61 per US dollar). Reflecting
cross-currency movements, the rupee depreciated by 9.1 per cent against the Pound
sterling and 6.8 per cent against the euro but appreciated by 2.7 per cent against
the Japanese yen over the same period. The exchange rate was Rs.41.91 per US dollar
as on April 18, 2007.
The nominal effective exchange rate (NEER) of the
Indian rupee (six-currency trade-based weights) appreciated by 3.1 per cent between
April 2006 and April 18, 2007. Over the same period, the real effective exchange
rate (REER) of the Indian rupee (six-currency trade-based weights) appreciated
by 7.8 per cent (Table 45).
Forward premia increased
during 2006-07 reflecting growing interest rate differential in view of increase
in domestic interest rates (Chart 43). While one-month
forward premia increased from 3.79 per cent in March 2006 to 6.99 per cent in
March 2007, the six-month premia increased from 2.43 per cent to 3.80 per cent
over the same period.
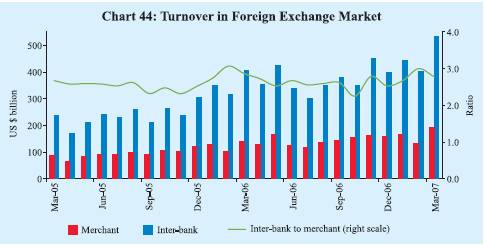
The turnover in the inter-bank segment of the foreign
exchange market increased from US $ 405 billion in March 2006 to US $ 533 billion
in March 2007 and that in the merchant segment from US $ 141 billion to US $ 192
billion
Table
45: Indices of Nominal and Real Effective
Exchange Rate of the Indian Rupee
(6-Currency Trade Based Weights) | Year/Month | Base
: 1993-94 (April-March) = 100 | NEER | | REER |
1 | 2 | | 3 |
| | | |
1993-94 | 100.00 | | 100.00 |
2000-01 | 77.30 | | 102.64 |
2001-02 | 75.89 | | 102.49 |
2002-03 | 71.09 | | 97.43 |
2003-04 | 69.75 | | 98.85 |
2004-05 | 69.26 | | 101.35 |
2005-06 | 71.41 | | 106.67 |
2006-07 (P) | 68.13 | | 104.91 |
March 2006 | 71.61 | | 108.11 |
April 2006 | 70.22 | | 104.12 |
May 2006 | 67.95 | | 101.91 |
June 2006 | 67.39 | | 101.79 |
July 2006 | 66.79 | | 101.26 |
August 2006 (P) | 66.28 | | 101.20 |
September 2006 (P) | 67.04 | | 103.86 |
October 2006 (P) | 68.31 | | 106.49 |
November 2006 (P) | 68.53 | | 107.12 |
December 2006 (P) | 68.01 | | 105.99 |
January 2007 (P) | 68.97 | | 108.20 |
February 2007(P) | 69.10 | | 108.57 |
March 2007(P) | 68.91 | | 108.35 |
April 18, 2007 (P) | 72.40 | | 112.21 |
NEER: Nominal Effective Exchange
Rate.
REER: Real Effective Exchange Rate.
P: Provisional.
Note:
Rise in indices indicates appreciation of the rupee and vice versa. |
(Chart 44). The ratio of inter-bank to merchant
turnover at 2.8 during 2006-07 was almost the same as in 2005-06. 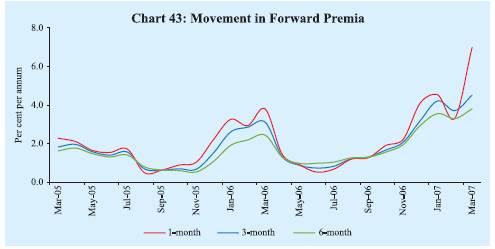
Credit
Market
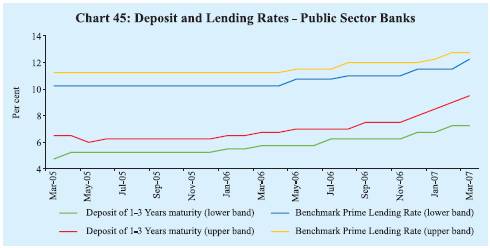
Both the deposit and lending rates of scheduled commercial
banks (SCBs) increased during 2006-07. Interest rates offered by public sector
banks (PSBs) on deposits of maturity of one year to three years were placed in
the range of 7.25-9.50 per cent in March 2007 as compared with 5.75-6.75 per cent
in March 2006, while those on deposits of maturity of above three years were placed
in the range of 7.50-9.50 per cent in March 2007 as compared with 6.00-7.25 per
cent in March 2006 (Table 46 and Chart 45). Similarly, interest rates offered
by private sector banks on deposits of maturity of one year to three years were
placed higher in the range of 6.75-9.75 per cent in March 2007 as compared with
5.50-7.75 per cent in March 2006, while those on deposits of maturity above three
years were placed in the range of 7.75-9.60 per cent in March 2007 as compared
with 6.00-7.75 per cent in March 2006. The rates offered by foreign banks on deposits
of maturity of one year to three years were placed in the range of 3.50-9.50 per
cent in March 2007 as compared with 4.00-6.50 per cent in March 2006. As
regards lending rates, the Benchmark Prime Lending Rates (BPLRs) of PSBs were
placed in the range of 12.25-12.75 per cent in March 2007 as compared with that
of 10.25-11.25 per cent in March 2006 (Table 46). The weighted
average BPLR of public sector banks increased from 10.7 per cent in March 2006
to 11.6 per cent in December 2006 and further to 12.5 per cent in March 2007.
Over the same period, the weighted average BPLR of private sector banks increased
from 12.4 per cent in March 2006 to 13.2 per cent in December 2006 and further
to 14.1 per cent in March 2007. The weighted average BPLR of foreign banks
at 12.7 per cent in March 2007 was the same as in December 2006 and in March 2006.
Table
46: Deposit and Lending Rates | (Per
cent) | Interest
Rate | March
2005 | March
2006 | June
2006 | September
2006 | December
2006 | March2007 |
1 | 2 | 3 | 4 | 5 | 6 | 7 |
1. | Domestic
Deposit Rate | | | | | | |
| Public
Sector Banks | | | | | | |
| Up
to 1 year | 2.75-6.00 | 2.25-6.50 | 2.75-6.50 | 2.75-7.00 | 2.75-7.00 | 2.75-8.75 |
| More
than 1 year and up to 3 years | 4.75-6.50 | 5.75-6.75 | 5.75-7.00 | 6.25-7.50 | 6.75-8.00 | 7.25-9.50 |
| More
than 3 years | 5.25-7.00 | 6.00-7.25 | 6.00-7.25 | 6.50-8.00 | 7.00-8.00 | 7.50-9.50 |
| Private
Sector Banks | | | | | | |
| Up
to 1 year | 3.00-6.25 | 3.50-7.25 | 3.50-6.75 | 3.00-7.25 | 3.00-8.00 | 3.00-9.00 |
| More
than 1 year and up to 3 years | 5.25-7.25 | 5.50-7.75 | 6.50-7.75 | 6.75-8.25 | 6.40-8.50 | 6.75-9.75 |
| More
than 3 years | 5.75-7.00 | 6.00-7.75 | 6.50-8.25 | 6.75-8.50 | 7.00-8.50 | 7.75-9.60 |
| Foreign
Banks | | | | | | |
| Up
to 1 year | 3.00-6.25 | 3.00-6.15 | 3.25-6.50 | 3.00-7.50 | 3.00-7.25 | 3.00-9.50 |
| More
than 1 year and up to 3 years | 3.50-6.50 | 4.00-6.50 | 5.00-6.50 | 3.50-8.15 | 3.50-8.15 | 3.50-9.50 |
| More
than 3 years | 3.50-7.00 | 5.50-6.50 | 5.50-6.75 | 4.00-8.25 | 4.05-8.25 | 4.05-9.50 |
| | | | | | | |
2. | Benchmark
Prime Lending Rate | | | | | | |
| Public
Sector Banks | 10.25-11.25 | 10.25-11.25 | 10.75-11.50 | 11.00-12.00 | 11.50-12.00 | 12.25-12.75 |
| Private
Sector Banks | 11.00-13.50 | 11.00-14.00 | 11.00-14.50 | 11.50-15.00 | 11.50-15.00 | 12.00-16.50 |
| Foreign
Banks | 10.00-14.50 | 10.00-14.50 | 10.00-14.50 | 10.00-14.50 | 10.00-14.50 | 10.00-15.50 |
| | | | | | | |
3. | Actual
Lending Rate* | | | | | | |
| Public
Sector Banks | 2.75-16.00 | 4.00-16.50 | 4.00-16.50 | 4.00-16.50 | 4.00-16.50 | – |
| Private
Sector Banks | 3.15-22.00 | 3.15-20.50 | 3.15-26.00 | 3.15-24.00 | 3.15-24.00 | – |
| Foreign
Banks | 3.55-23.50 | 4.75-26.00 | 4.75-25.00 | 4.50-23.00 | 4.50-26.50 | – |
* : Interest rate on non-export
demand and term loans above Rs.2 lakh excluding lending rates at the extreme five
per cent on both sides.
– : Not available. |
Government
Securities Market
The yields in the Government securities market
hardened during 2006-07. Yields moved up from mid-April 2006 reflecting sustained
credit demand, monetary policy tightening in the US and other economies, volatile
crude oil prices, apprehensions over domestic fuel price hike, and hike in the
reverse repo rate by 25 basis points effective June 9, 2006. Reflecting these
factors, yields on 10-year paper reached an intra-year peak of 8.40 per cent on
July 11, 2006, an increase of 88 basis points over end-March 2006. Subsequently,
yields softened in consonance with easing of Government bond yields in the US,
the Fed’s decision to keep the fed funds rate target unchanged since end-June
2006, easing of crude oil prices, increased demand for gilts from banks to meet
their SLR requirements and the announcement of the borrowing calendar of the Central
Government for the second half of 2006-07 which was in accordance with market
expectations. The 10-year yield reached a low of 7.38 per cent as on November
28, 2006. There was again some hardening of the yields from the second half of
December 2006 in tandem with tightness in domestic liquidity conditions on the
back of advance tax outflows, higher inflation and hikes in the CRR. The 10-year
yield was 7.97 per cent as on March 31, 2007, 45 basis points higher than the
level as on March 31, 2006 (7.52 per cent) (Chart 46).
The yield was 8.07 per cent as on April 18, 2007. The yield curve flattened during
2006-07, with the spread between 1-10 year yields narrowing down to 42 basis points
at end-March 2007 from 98 basis pints at end-March 2006. The spread between 10-year
and 30-year yields, however, widened to 37 basis points at end-March 2007 from
30 basis points at end-March 2006.
The turnover in the Government securities
market continued to be influenced by trends in yields. The turnover remained subdued
during April-July 2006 as 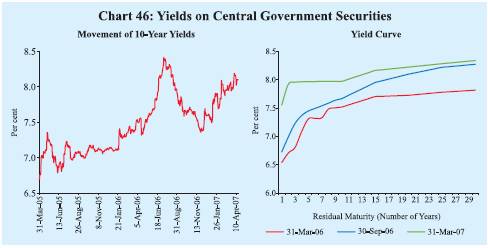
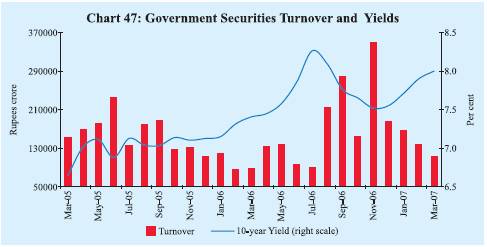
banks
preferred to hold securities, rather than trade, in an environment of hardening
of yields. The turnover, however, increased during August-November 2006 (the highest
since June 2005) as yields trended downwards. The decline in turnover in October
2006 partly reflected lower number of trading days. The turnover again turned
subdued from December 2006 as yields started hardening (Chart
47).
The yields on 5-year AAA-rated corporate bonds increased during
2006-07 in tandem with higher Government securities yield. The yield spread between
5-year AAA-rated bonds and 5-year Government securities, however, widened to 142
basis points at end-March 2007 from that of 91 basis points at end-March 2006
(Chart 48). 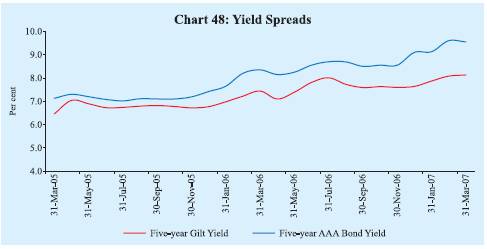
Equity
Market
Primary Market
Resources raised through the public
issues increased by 20.2 per cent to Rs.32,382 crore during 2006-07 (Table
47). The average size of issues increased to Rs.272 crore from Rs.195 crore
during the corresponding period of the previous year. All issues, except one,
during 2006-07 were by non-Government public limited companies (private sector)
and mostly by non-financial companies. Out of 119 issues during the year, 75 issues
were initial public offerings (IPOs) constituting 85.0 per cent of total resource
mobilisation.
Mobilisation of resources through private placement increased
by 50.8 per cent to Rs.1,03,169 crore during April-December 2006 over the corresponding
period of the previous year (Table 47). This was mainly
on account of a near doubling of resources mobilised by private sector entities
to Rs.59,796 crore. Resources raised by public sector entities increased by only
11.4 per cent. Private sector entities, thus, raised more resources than public
sector entities in contrast to the trend in 2005-06. Financial intermediaries
(both from public sector and private sector) continued to account for the bulk
of resource mobilisation from the private placement market (69.4 per cent of the
total during April-December 2006 as compared with 64.1 per cent during April-December
2005).
Table
47: Mobilisation of Resources from the Primary Market |
(Amount in Rupees crore) |
Item | No.
of Issues | Amount | No.
of Issues | Amount |
1 | 2 | 3 | 4 | 5 |
| 2005-06 | | 2006-07
P | | A. | Prospectus
and Rights Issues* | | | | |
| 1. | Private
Sector (a+b) | 131 | 21,154 | 118 | 31,600 |
| | a) | Financial | | 11 | 7,746 | 9 | 2,420 |
| | b) | Non-financial | 120 | 13,408 | 109 | 29,180 |
| 2. | Public
Sector (a+b+c) | 7 | 5,786 | 1 | 782 |
| | a) | Public
Sector Undertakings | – | – | – | – |
| | b) | Government
Companies | 1 | 373 | – | – |
| | c) | Banks/Financial
Institutions | 6 | 5,413 | 1 | 782 |
| 3. | Total
(1+2) | | 138 | 26,940 | 119 | 32,382 |
| | Of
which: (i) | Equity | 136 | 26,695 | 116 | 31,535 |
| | | (ii) | Debt | 2 | 245 | 3 | 847 |
B. | Private
Placement@ | | | | |
| 1. | Private
Sector | 673 | 29,501 | 1,111 | 59,796 |
| | a) | Financial | | 281 | 18,191 | 450 | 35,887 |
| | b) | Non-financial | 392 | 11,310 | 661 | 23,909 |
| 2. | Public
Sector | 108 | 38,926 | 84 | 43,373 |
| | a) | Financial | | 84 | 25,677 | 71 | 35,734 |
| | b) | Non-financial | 24 | 13,249 | 13 | 7,639 |
| 3. | Total
(1+2) | | 781 | 68,427 | 1,195 | 1,03,169 |
| | Of
which: (i) | Equity | 1 | 150 | 1 | 57 |
| | | (ii) | Debt | 780 | 68,277 | 1,194 | 1,03,112 |
C. | Euro
Issues | | 48 | 11,352 | 40 | 17,005 |
P : Provisional. * : Excluding offers for
sale.
– : Nil/Negligible. @: Data pertain to April-December. |
Table
48: Resource Mobilisation by Mutual Funds | (Rupees
crore) | Mutual Fund | 2005-06 | 2006-07 |
Net | Net | Net | Net |
Mobilisation @ | Assets | Mobilisation
@ | Assets | 1 | 2 | 3 | 4 | 5 |
| | | | |
Private Sector | 42,977 | 1,81,515 | 79,038 | 2,62,079 |
Public Sector | 6,379 | 20,829 | 7,621 | 28,725 |
UTI | 3,424 | 29,519 | 7,326 | 35,488 |
Total | 52,780 | 2,31,862 | 93,985 | 3,26,292 |
@: Net of redemptions.
Source:
Securities and Exchange Board of India. | The
resources raised through Euro issues - American Depository Receipts (ADRs) and
Global Depository Receipts (GDRs) - by Indian corporates increased by 49.8 per
cent to Rs.17,005 crore during 2006-07.
During 2006-07, net mobilisation of
resources by mutual funds increased substantially by 78.1 per cent to Rs.93,985
crore over the corresponding period of previous year (Table 48).
Bulk of the net mobilisation of funds (68.2 per cent of total) was under income/debt-oriented
schemes, while growth/equity-oriented schemes accounted for 30.0 per cent of the
net mobilisation of funds.
Secondary Market
The domestic
stock markets recorded further gains during 2006-07 (Chart
49). FIIs investments in the domestic stock markets during 2006-07 were lower
than a year ago. Mutual funds investments in the domestic stock markets were also
lower than a year ago. Growth in corporate profitability remained buoyant. 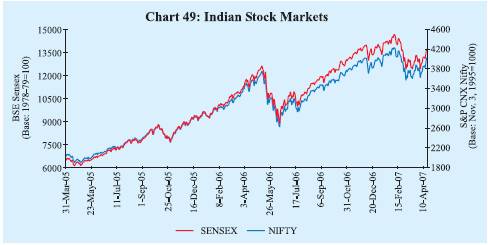
Stock
market gains were interspersed by some sharp corrections during the course of
the year. In consonance with the trends in global equity markets, domestic stock
markets witnessed correction during May-June 2006, December 2006 and February/
March 2007. The BSE Sensex reached an intra-year low of 8929 as on June 14, 2006,
a decline of 29.2 per cent over the then all-time high of 12612 reached on May
10, 2006. The stock markets recouped these losses in the subsequent months and
the BSE Sensex reached an all-time high of 14652 on February 8, 2007. The markets,
however, witnessed some correction thereafter. The BSE Sensex closed at 13072
on March 30, 2007. The BSE Sensex, thus, increased by 15.9 per cent during 2006-07
(year-on-year) as compared with a gain of 73.7 per cent during 2005-06. The BSE
Sensex was 13672 as on April 18, 2007.
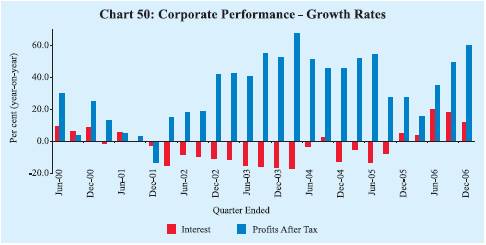
Profits after tax of corporates
improved sharply in each of the first three quarters of 2006-07. Profits after
tax of select non-Government non-financial companies increased by 48.7 per cent
during April-December 2006 on top of 36.8 per cent growth recorded in the corresponding
period of 2005. Ratio of profits after tax to sales improved to 11.0 per cent
during the quarter ended December 2006 from 8.6 per cent a year ago (Table
49 and Chart 50).
Table
49: Corporate Financial Performance | (Growth
rates in per cent) | Item | 2004-05 | 2005-06 | 2005 | 2006 | 2005-06
| 2006-07 |
April-December | Q1 | Q2 | Q3 | Q4 | Q1 | Q2 | Q3 |
1 | 2 | 3 | 4 | 5 | 6 | 7 | 8 | 9 | 10 | 11 | 12 |
Sales | | 24.1 | 16.9 | 16.1 | 28.9 | 18.5 | 16.4 | 13.2 | 19.5 | 25.6 | 29.2 | 30.3 |
Expenditure | 21.9 | 16.4 | 15.6 | 26.3 | 18.0 | 16.3 | 12.7 | 18.9 | 24.6 | 26.6 | 26.9 |
Depreciation Provision | 11.2 | 10.2 | 7.0 | 16.7 | 4.4 | 7.4 | 10.2 | 13.2 | 14.9 | 16.4 | 16.8 |
Gross Profits | 32.5 | 20.3 | 24.8 | 45.4 | 32.0 | 19.1 | 21.2 | 16.6 | 33.9 | 45.9 | 51.8 |
Interest | | -5.8 | 1.9 | -5.5 | 17.7 | -13.5 | -8.0 | 4.6 | 3.8 | 19.9 | 18.0 | 11.9 |
Profits After Tax | 51.2 | 24.2 | 36.8 | 48.7 | 54.2 | 27.5 | 27.0 | 15.1 | 34.7 | 49.4 | 59.5 |
Select Ratios (Per
cent) | Gross Profits
to Sales | 11.9 | 13.0 | 13.8 | 16.1 | 13.1 | 13.0 | 12.8 | 12.7 | 15.6 | 15.9 | 15.8 |
Profits After Tax to Sales | 7.2 | 8.7 | 9.1 | 11.1 | 8.6 | 8.5 | 8.6 | 8.7 | 10.6 | 11.0 | 11.0 |
Interest Coverage Ratio | 4.6 | 6.4 | 6.1 | 7.8 | 6.0 | 6.2 | 6.2 | 7.3 | 7.2 | 7.8 | 8.0 |
Interest to Sales | 2.6 | 2.0 | 2.3 | 2.1 | 2.2 | 2.1 | 2.1 | 1.7 | 2.2 | 2.0 | 2.0 |
Interest to Gross Profits | 21.8 | 15.7 | 16.4 | 12.9 | 16.6 | 16.2 | 16.2 | 13.7 | 13.9 | 12.8 | 12.5 |
Memo: | (Amount
in Rupees crore) | No. of Companies | 2,214 | 2,210 | 2,251 | 1,933 | 2,355 | 2,361 | 2,366 | 2,415 | 2,228 | 2,263 | 2,258 |
Sales | | 5,49,449 | 7,74,578 | 5,79,881 | 6,80,662 | 1,94,608 | 2,12,693 | 2,19,098 | 2,49,971 | 2,34,610 | 2,51,125 | 2,60,064 |
Expenditure | 5,14,574 | 6,66,690 | 4,95,284 | 5,64,331 | 1,66,972 | 1,83,717 | 1,88,934 | 2,18,511 | 1,95,556 | 2,09,437 | 2,16,053 |
Depreciation Provision | 22,697 | 28,883 | 22,044 | 24,557 | 7,137 | 7,617 | 7,748 | 8,340 | 8,449 | 8,892 | 9,172 |
Gross Profits | 65,301 | 1,00,666 | 79,937 | 1,09,432 | 25,577 | 27,620 | 28,135 | 31,652 | 36,567 | 40,041 | 41,169 |
Interest | | 14,268 | 15,789 | 13,095 | 14,137 | 4,241 | 4,467 | 4,555 | 4,348 | 5,083 | 5,121 | 5,162 |
Profits After Tax | 39,599 | 67,506 | 52,891 | 75,460 | 16,726 | 18,169 | 18,790 | 21,634 | 24,845 | 27,710 | 28,698 |
Note :
1. Growth rates
are percentage changes in the level for the period under reference over the corresponding
period of the previous year.
2. Data in column (2) are based on audited balance
sheets, while those in column (3) onwards are based on the abridged results of
the sample non-Government non-financial companies.
3. Data for the full year
and for the nine months period may not add to the quarterly totals due to difference
in the number of companies covered. |
According
to the Securities and Exchange Board of India (SEBI), FIIs made net purchases
of Rs.25,236 crore (US $ 6.0 billion) during 2006-07 on top of net purchases of
Rs.48,542 crore (US $ 11.0 billion) during the previous year. Mutual funds also
made net investments of Rs.9,024 crore during 2006-07 as compared with net purchases
of Rs.14,302 crore during the previous year (Chart 51).
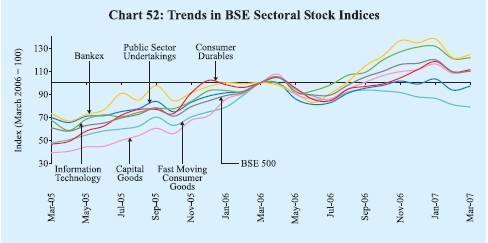
Major stock indices and sectors showed mixed trends during 2006-07 (Chart
52). On a point-to-point basis, the BSE 500 and the BSE Mid-cap increased by 9.7
per cent and 0.7 per cent, respectively, while the BSE Small-cap declined
by 1.9 per cent. Amongst major sectors, oil and gas stocks recorded gains of 30.5
per cent, followed by bank stocks (24.2 per cent), IT (21.6 per cent), consumer
durables (11.1 per cent) and capital goods (11.1 per cent). However, losses were
noticed in the fast moving consumer goods sector (21.4 per cent), auto sector
stocks (8.7 per cent), healthcare (5.4 per cent), metals (4.3 per cent) and PSUs
(3.2 per cent).
The price-earnings (P/E) ratio for the 30 scrips included
in the BSE Sensex declined from 20.9 at end-March 2006 to 20.3 at end-March 2007
(Table 50). The market capitalisation of the BSE increased
by 17.3 per cent between end-March 2006 and end-March 2007. 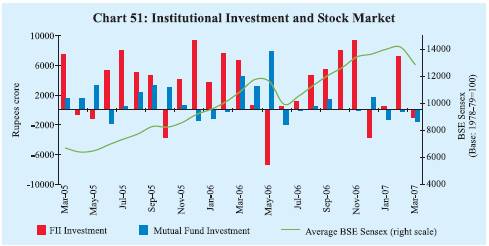
Table
50: Stock Market Indicators | Indicator | | BSE | | | NSE | |
2004-05 | 2005-06 | 2006-07 | 2004-05 | 2005-06 | 2006-07 |
1 | 2 | 3 | 4 | 5 | 6 | 7 |
BSE Sensex / S&P CNX Nifty* | | | | | | |
End-period | 6493 | 11280 | 13072 | 2036 | 3403 | 3822 |
Average | 5741 | 8280 | 12277 | 1805 | 2513 | 3572 |
Volatility# (Per cent) | 11.2 | 16.7 | 9.0 | 11.3 | 15.6 | 10.5 |
P/E Ratio (end-period)* | 15.6 | 20.9 | 20.3 | 14.6 | 20.3 | 18.4 |
Turnover (Rupees crore) | 5,18,716 | 8,16,074 | 9,56,185 | 11,40,071 | 15,69,556 | 19,44,645 |
Market Capitalisation | | | | | | |
(Rupees crore) (end-period) | 16,98,429 | 30,22,190 | 35,45,041 | 15,85,585 | 28,13,201 | 33,67,350 |
* : For 30 scrips included in
the BSE Sensex and 50 scrips included in the S&P CNX Nifty.
# : Volatility
is measured by coefficient of variation.
Source : Bombay
Stock Exchange Limited (BSE) and National Stock Exchange of India Limited (NSE). |
Total turnover (BSE and NSE) in the cash segment during 2006-07 at
Rs.29,00,830 crore was 21.7 per cent higher than that in the corresponding period
of 2005-06 (Chart 53). Total turnover (BSE and NSE) in
the derivative segment increased by 53.7 per cent during 2006-07 to Rs.74,15,448
crore. 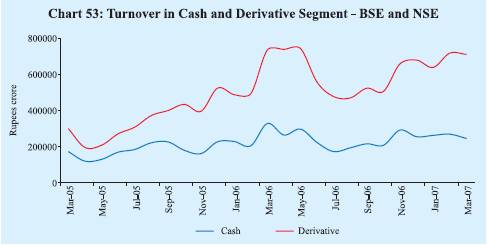
|
 IST,
IST,


