 IST,
IST,
VI. Price Situation
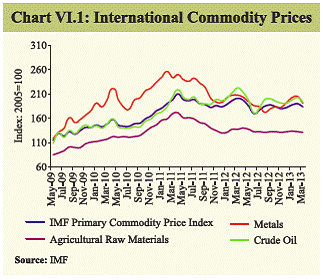
Growth slowdown, softer commodity prices, range-bound exchange rate in recent months and past monetary policy actions contributed to the moderation of headline inflation to 6.0 per cent (provisional) in March 2013 from 7.7 per cent in March 2012. inflation, however, continues to remain above comfort level. The divergence between WPI and CPI inflation widened, reflecting high food inflation, which is a source of concern. Headline inflation in 2013-14 is expected to remain range-bound around the current level. While sluggish global growth may dampen global inflation risks, domestically energy price adjustments, supply-side bottlenecks, including that of food, and sustained wage pressures may offset the moderation of inflation resulting from growth moderation and past monetary policy actions. Global inflationary pressures remained muted in 2012-13 VI.1 Global inflation continued to remain muted against the backdrop of fragile and uneven global economic recovery. In advanced economies (AEs), weak demand pressure and high unemployment rate contributed to low inflation. The April 2013 World Economic Outlook (WEO) projected the consumer price inflation in the AEs to moderate to 1.7 per cent in 2013 from 2.0 per cent in 2012. In emerging market and developing economies (EMDEs), it is projected to remain at 5.9 per cent in 2013, same as in the previous year. VI.2 Low inflation, even below the inflation targets in the case of several AEs, provided space to extend their monetary accommodation through unconventional monetary policies. Policy rates in several AEs remained at the zero lower bound, prompting them to undertake further doses of quantitative easing (QE) (Table VI.1). Some other AEs that had space lowered policy rates further. The central banks of AEs continue to stimulate protracted recovery along with well-anchored inflation expectations. While the immediate risk of global inflation resurgence remains low, once recovery shapes up, inflation concerns could resurface given the presence of excess global liquidity. VI.3 Although consumer price inflation generally remained moderate in the case of EMDEs, some EMDEs, including India, the Middle East, Sub-Saharan Africa and some East European countries, faced high inflation in 2012. India emerged as an outlier among BRICS and the G-20 nations with double-digit CPI inflation (Table VI.1). India’s high CPI inflation remains a worry in the context of its increased openness and on account of welfare implications. Global commodity prices exhibit softening bias VI.4 The year 2012-13 was marked by stable oil and food prices and softer prices for metals, beverages and agricultural raw materials. Metal prices, after falling until August 2012, witnessed an uptrend in subsequent months (Chart VI.1). However, global oil and non-oil commodity prices witnessed marked correction during April 2013, reflecting improved supply prospects and weaker global growth expectations. Global food prices continued to remain range-bound. Food and Agriculture Organisation (FAO) assessment indicate improved food supply outlook for 2013 on account of favourable production prospects.
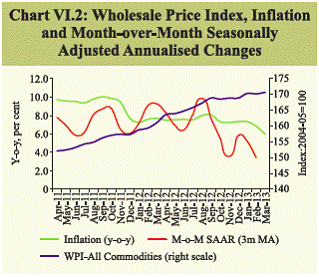
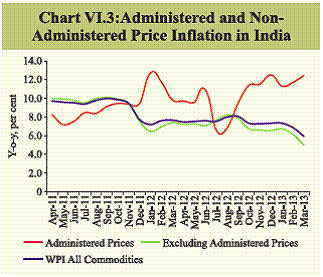
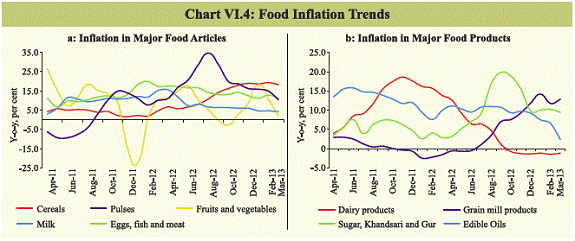
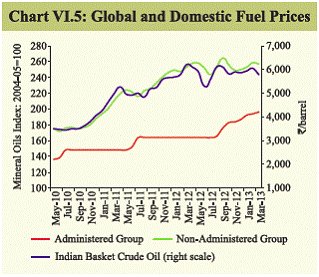
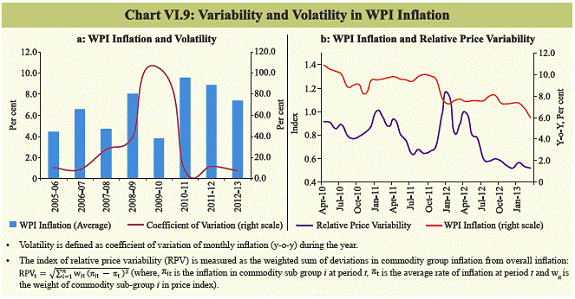
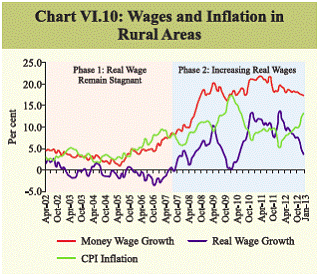
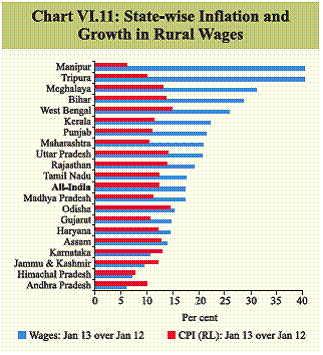
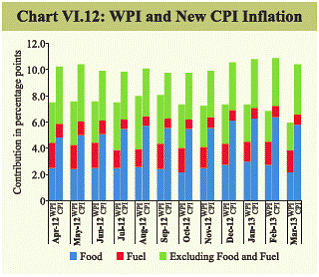
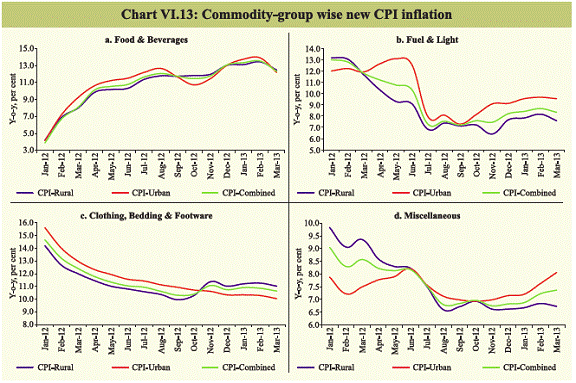
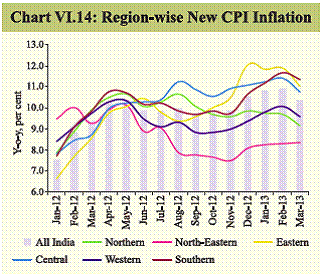
Domestic headline inflation moderated as generalised inflationary pressures eased VI.5 After remaining in the range of 7.5–8.1 per cent during H1 of 2012-13, wholesale price index (WPI) inflation (y-o-y) in India moderated gradually to 5.96 per cent, (provisional) in March 2013 (Chart VI.2). Moderation in headline inflation has been significant even as price pressures continued to persist from the food and fuel segments. This was facilitated by a decline in manufactured non-food products inflation, which came down sharply to 3.5 per cent (provisional) in March 2013, reaching its lowest level in the past three years. While subdued pressures from global commodity prices and the range-bound exchange rate helped the course of downward movement in the inflation trajectory, the decline in inflation also reflects the impact of growth moderation and the weak pricing power of firms as well as past monetary policy actions aimed at containing inflation and anchoring inflation expectations. The momentum of price changes, as indicated by 3-month moving average seasonally adjusted month-over-month changes, also moderated in H2 of 2012-13. VI.6 Moderation in inflation has not been commensurate with the slowdown in growth, in part because structural factors are keeping prices up, and in part because price softening was offset by revisions in administered prices, especially in the fuel group (Chart VI.3). To the extent that administered price increases keep headline inflation above market-determined prices, it reflects the lagged pass-through. Cereals and pulses emerge as major pressure points for food inflation VI.7 Food prices continued to increase during the Q4 of 2012-13. The contribution of different items to overall food inflation, however, changed during the year. After exhibiting moderate price increases in the previous year, the price increases in cereals and pulses became quite significant during the current year (Chart VI.4). The delayed and skewed south-west monsoon had a significant impact on the production of cereals and pulses, which triggered the initial price spurt. However, despite the presence of large buffer stocks, price increases continued to be persistent. It is observed that there has been a secular build-up in the stock of foodgrains in recent years that are much above the buffer norms (see Chapter I). VI.8 The minimum support prices (MSP) of most cereals and pulses have increased significantly in recent years, which has emerged as an additional source of pressure. This is particularly true in the case of paddy (Table VI.2). However, total rice production fell during 2012-13, due mainly to drought conditions in parts of Tamil Nadu, Maharashtra and other rice-producing states. VI.9 Apart from cereals, volatility in prices of vegetables and fruits added to domestic price pressures. Also, inflation in protein-rich food items continued to remain elevated since, apart from pulses, price increases have been significant for eggs, fish and meat. Inflation in milk, however, moderated over the course of the year. Manufactured food products inflation also tracked the trends in primary food inflation.
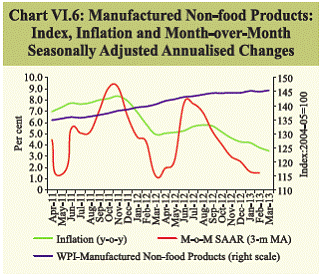
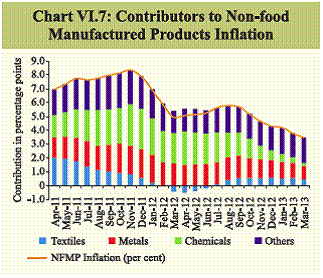
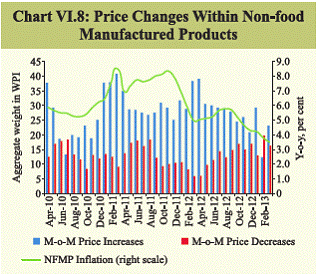
VI.10 Persistent increases in domestic food prices during 2012-13, despite range-bound global food prices, calls for a relook at the overall agriculture price policy, where MSPs and large buffer stocks are the two major policy tools. While food security is of paramount importance in a country such as India, recent experience suggests that large buffer stocks have not been effective in dampening prices, even as the system is bearing large carrying costs and storage losses. Also, significant increases in the cost of production in agriculture, driven largely by the increase in wage costs, added to pressure on food prices. As has been highlighted in the past, the changing pattern of consumption in favour of protein-rich items has not been matched by supply elasticities, which added pressure from the demand side. Addressing these issues by augmenting supply capacities could be critical in achieving the goal of stable food prices. Administered price revisions keep fuel inflation high and persistent VI.11 Revision in administered prices largely shaped the course of fuel inflation during the year. Given the unsustainable level of subsidy burden arising from administered prices, the price of diesel was raised by `5 per litre in September 2012. Also the number of subsidised LPG cylinders per consumer was capped at six (which was later raised to nine). In January 2013, the government allowed OMCs to raise the retail price of diesel in a staggered manner and to charge bulk consumers the market price of diesel. VI.12 Although the revisions in administered fuel prices led to some decline in the extent of suppressed inflation, the gap still persists (Chart VI.5). This has resulted in a substantial build-up in the under-recoveries of the oil marketing companies (OMCs) to the tune of `1.61 trillion during 2012-13, of which 57 per cent was on account of diesel. The decision to allow small, step-wise increases in diesel prices could result in some persistence of fuel inflation during 2013-14. However, a gradual and calibrated increase in price to align it with international prices is desirable, since large discrete price changes often have a distortionary impact on inflation expectations. VI.13 Although there was some moderation in international coal price, the gap between domestic and global prices persists. Of the total estimated domestic demand of about 770 MT during 2013-14, 21 per cent would have to be met through imports. Greater reliance on imports for bridging domestic demand-supply gap could lead to increase in costs which could reflect in prices. VI.14 The recent debt restructuring of most State Electricity Boards (SEBs) would lead to improved financial positions and, thereby, improve their sustainability. However, the debt restructuring is also conditional on significant increases in prices to make them financially viable. This is partly reflected in increases in electricity prices in June 2012, which exerted upward pressure on fuel Inflation. Further increases can be expected in the near term. However, if the improved financial condition of the SEBs leads to better delivery, the reliance on more expensive sources of power such as gensets could decline, which could lead to a decline in the overall power cost for firms. Generalised inflationary pressures ease as output gap remains negative VI.15 The major development in Inflation dynamics in recent months was the marked decline in non-food manufactured products Inflation. The month-over-month seasonally adjusted annualised change (3-month moving average), which is an indicator of the momentum of price increases, also indicates significant moderation in price pressures in recent months (Chart VI.6). VI.16 The decline in the contribution of the metals and chemicals group has been the major driver of the moderation in Inflation within the non-food manufactured products group (Chart VI.7). As prices moderated in the international commodity markets and the rupee remained range-bound, the benefits got passed on to domestic Inflation. This reaffirms the fact that in the absence of offsetting pressures, generalised Inflation does moderate with a negative output gap. Pattern of price changes points to significant moderation VI.17 A look at the distribution of price changes within non-food manufactured products indicates that during 2012-13, the share of items exhibiting month-overmonth increases in prices has gradually declined, while the share of items reporting price decreases has increased (Chart VI.8). This points to the presence of a strong disInflationary momentum, which further corroborates the weak pricing power. The PMI input and output price indices in recent months exhibited moderation, further pointing towards moderation of Inflation pressures. VI.18 During the three-year period of high Inflation (2010-11 to 2012-13), the month-to-month volatility of all-commodities WPI Inflation declined, reflecting its persistence. During 2012-13, the declining volatility reflects gradual moderation in overall Inflation. The relative price variability across commodities, which was high in 2011-12, also declined during 2012-13, suggesting that softening of Inflation has occurred in a generalised manner Chart VI.9 (a & b). Wage growth pressures persist, although with some moderation VI.19 Persistent pressure from wages remains a major risk to Inflation moderation. Although the pace of increase of rural wages moderated, it continues to be in double digits. However, the sharp increase in Inflation in rural areas in recent months led to significant moderation in real wage growth (Chart VI.10). State-specific factors continue to play a major role in wage-price dynamics, with significant variation in Inflation and wage growth being observed across the major states (Chart VI.11). VI.20 In the private corporate sector, the increase in staff costs remained significant, indicating persistent pressure from wage costs (see Chapter II). The results of the Annual Survey of Industries (available up to 2010-11) also show double-digit growth in wages in the factory sector, pointing towards pressure on industry from high wages. Divergence between WPI and CPI inflation widened VI.21 Since December 2012, Inflation as measured by the all-India new Consumer Price Index (CPI-combined: rural + urban) remained in double digits even as WPI Inflation moderated, leading to a widening of the gap between the two (10.4 per cent and 6.0 per cent in new CPI and WPI, respectively, in March 2013) (Chart VI.12). This divergence is on account of several factors. Both the higher weight of food in the new CPI (47.6 per cent) compared with the WPI (24.3 per cent), and higher food Inflation in new CPI at 12.4 per cent compared with 8.1 per cent in WPI for March 2013 contributed to the divergence. In particular, new CPI Inflation for vegetables, oils & fat, milk, sugar and eggs, fish & meat was higher than that in the WPI possibly reflecting trade and transport margins and other supply chain inefficiencies. Also, housing, which is only part of the new CPI, exhibited double-digit Inflation. Consumer price inflation in some commodities diverges between rural and urban areas VI.22 There were large divergences in Inflation by commodity groups in rural and urban areas (Chart VI.13). The fuel & light group witnessed higher Inflation in urban areas. Inflation in clothing, bedding and footwear was higher in rural areas in recent months. While overall food Inflation remained more or less the same between rural and urban areas. However, within food groups there was significant divergence in Inflation trends. Inflation was higher in cereals, pulses, ‘eggs, fish and meat’ and prepared meals in urban areas, while ‘milk & milk products’, ‘condiments & spices’, sugar and edible oils recorded higher Inflation in rural areas. These divergence in Inflation may also in part reflect supply chain inefficiencies across various regions but it needs a thorough examination. Regional variation in inflation remains significant VI.23 Though starting at around the similar rate of 10 per cent in May 2012, CPI Inflation across various regions of the country exhibited significant divergence in recent months. Notably, the north-eastern region witnessed lower Inflation than the rest of the country (Chart VI.14). Inflation differential across regions could be due to region-specific factors, such as the composition of the consumption basket and transport costs. State-specific government policies, such as the availability of fair price shops and restrictions on interstate movement of goods could also lead to the differences in Inflation. VI.24 Recent trends in the prices of selected food articles collected across various regions by the Reserve Bank indicate further firming up of the prices of cereals, both in the wholesale and retail markets, while prices of pulses showed some moderation. The average markup in the prices between retail and wholesale markets during Q4 of 2012-13 were sustained in the range of 7–20 per cent for cereals and pulses, and it varied in the range of 22–45 per cent for perishable items, including vegetables, fruits and fish. Headline inflation is expected to remain range-bound during 2013-14 VI.25 Going forward, the growth slowdown and the lagged impact of past monetary policy actions are expected to keep Inflation moderate from the demand side. The recent fall in global commodity prices and subdued demand conditions may result in some further moderation in headline Inflation in the coming months, but overall Inflation is likely to stay range-bound. From the supply side, price adjustments in diesel, coal and electricity, when effected, may offset the Inflation moderation due to slack demand. Moreover, food Inflation remains a major pressure point accentuated by continuing supply bottlenecks. A sustained moderation in food Inflation would entail greater emphasis on removing supply bottlenecks and raising agricultural productivity. The near-term path of food Inflation, however, is also contingent upon the performance of the monsoon. The global environment remains uncertain, and despite the recent moderation, possible upswings in fuel prices or depreciation of the exchange rate pose further upside risks. Risks also stem from the possible wage-price spiral and high Inflation expectations. In view of these factors, the monetary policy has to continue its close vigil on the Inflation front while continuing to facilitate growth recovery. | |||||||||||||||||||||||||||||||||||||||||||||||||||||||||||||||||||||||||||||||||||||||||||||||||||||||||||||||||||||||||||||||||||||||||||||||||||||||||||||||||||||||||||||||||||||||||||||||||||||||
ପେଜ୍ ଅନ୍ତିମ ଅପଡେଟ୍ ହୋଇଛି:


