 IST,
IST,


VIII. Financial Stability (Part 2 of 2)
II. FINANCIAL STABILITY: THE INDIAN APPROACH
8.39 The Indian economy has witnessed a gradual opening up since the 1990s. Significant and far-reaching reforms were effected in the various sectors of the Indian economy. Consequent to these reforms, the financial system has been transformed from a planned and administered regime to a market-oriented financial system. The external sector has been progressively opened up. Reflecting the policy framework with stress upon attracting non-debt creating stable flows, capital flows to India have been largely stable. At the same time, episodes of volatility have been witnessed with attendant consequences for exchange rate movements. Moreover, the financial sector liberalisation and deregulation has led to emergence of financial conglomerates in the Indian economy with implications for contagion and systemic risks. Finally, in the context of the shift to a system whereby monetary impulses are transmitted through modulations in short-term interest rates, it is important that policy signals are quickly passed onto the market rates of interest such as lending interest rates. The efficacy of this transmission channel depends upon the strength of the balance sheet of financial sector. Consequently, for all these reasons, the issue of financial stability has become much more important than in the erstwhile administered regime.
8.40 Before the onset of reforms in the early 1990s, the Indian financial sector was a Government-dominated system with limited efficiency and too much stability through rigidity. This would suggest that financial stability in India has to be viewed contextually, more so when the sector is graduating towards a market-oriented one, with focus on efficiency and avoiding instabilities. Accordingly, financial stability in India would mean (a) ensuring uninterrupted financial transactions, (b) maintenance of a level of confidence in the financial system amongst all the participants and stakeholders and (c) absence of excess volatility that unduly and adversely affects real economic activity (Reddy, 2004a). Such financial stability has to be particularly ensured when the financial system is undergoing structural changes to promote efficiency.
8.41 Thus, at present, the Reserve Bank simultaneously pursues the objectives of price stability and provision of adequate credit for growth. In addition, financial stability has gradually emerged as a key consideration in the conduct of monetary policy. The Reserve Bank has followed a three-pronged strategy to maintain financial stability (Jadhav, 2003):
- Maintaining the overall macroeconomic balance, especially through the twin objectives of price stability and growth;
- Enhancing the macro-prudential functioning of institutions and markets; and,
- Strengthening micro-prudential institutional soundness through regulation and supervision.
8.42 Against this brief overview, this Section dwells upon the various initiatives by the Reserve Bank to ensure financial stability in India. The Section starts with the role of monetary policy per se in contributing to financial stability in India - contribution to price stability and ensuring orderly conditions in financial markets. This is followed by a discussion of various regulatory and supervisory initiatives to achieve financial stability. In order to place these regulatory and supervisory initiatives in a proper context, a brief overview of the Indian financial sector is followed by the policy framework to promote stability of the financial system. Finally, an evaluation of the performance of various segments of the financial sector is undertaken, especially of the banking sector.
8.43 As discussed in Section I, monetary stability and financial stability complement each other in the long-run. Monetary stability is an important precondition for financial stability and, therefore, the most significant contribution that monetary policy can make to financial stability is through maintaining low and stable inflation. Looking at the Indian experience, this pre-condition seems to be in place. In India, price stability has been an abiding objective of monetary policy since Independence. Compared to many other developing economies, the inflation record of India can be considered quite satisfactory although, as discussed in Chapters III and V, the degree of success has varied over time, in line with the evolving monetary-fiscal interface. More recently, since the second half of the 1990s, inflation has been brought down to an average of five per cent per annum compared to an average of around 8-9 per cent per annum in the preceding two and a half decades. The reduction in inflation since the early 1990s has also enabled to stabilise inflation expectations. There is virtually a national consensus that high inflation is not good and that it should be brought down (Reddy, 2004c). Low and stable inflation expectations increase confidence in the domestic financial system and, thereby contribute in an important way to stability of the domestic financial system. By achieving a reasonable degree of monetary stability, the Reserve Bank has created the necessary enabling environment for financial stability. Inflation expectations, inter alia, depend upon fiscal prudence. The recently enacted Fiscal Responsibility and Budget Management Act with its envisaged reduction in key deficit indicators is expected to reduce the fiscal dominance over time and, in turn, provide the Reserve Bank further flexibility so as to maintain low and stable inflation. Adherence to these fiscal rules will stabilise inflation expectations and thus contribute to efforts of price stability.
8.44 Second, with the ongoing financial liberalisation, a number of measures have been taken to widen, deepen and integrate various segments of the financial markets. These measures have imparted efficiency to the financial system and are an important pre-requisite for transmission of monetary policy signals to the real sector. At the same time, financial markets are often characterised by herd behaviour and contagion which can be destabilising and lead to overshooting. Indian policy makers have been conscious of the fact that international financial markets act in a strongly pro-cyclical manner in the case of EMEs. The capacity of economic agents in developing economies to manage volatility in all prices, goods or foreign exchange is highly constrained and there is a legitimate role for non-volatility as a public good (Reddy, 2004a). Maintaining orderly conditions in various financial markets is, therefore, important for financial stability. Accordingly, ensuring orderly conditions in the financial markets is an important aspect of the Reserve Bank's approach towards maintaining financial stability. Operating procedures and instruments of monetary policy have evolved over time to meet these objectives. As regards money markets, the liquidity adjustment facility (LAF) has emerged as the main instrument to modulate liquidity in the system. In the context of large capital flows, LAF operations coupled with open market sales played a key role in absorbing liquidity in order to ensure macroeconomic and financial stability. With persistent capital flows, a new facility in the form of Market Stabilisation Bills/Bonds (MSBs) was put in place effective April 2004 (see Chapter IV). The MSS has provided the Reserve Bank greater flexibility in its market operations. A key message of the Indian experience is that a central bank constantly needs to innovate in terms of instruments in order to meet its policy objectives. India's exchange rate policy of focusing on managing volatility with no fixed rate target, while allowing the underlying demand and supply conditions to determine the exchange rate movements over a period in an orderly way has stood the test of time. Monetary measures supported with market operations in the foreign exchange markets and administrative measures have been employed to maintain stable conditions in the forex markets. A key lesson of the Indian approach is that flexibility and pragmatism are required in the management of exchange rate in developing countries, rather than adherence to strict theoretical rules. Of course, prudent external sector management with a cautious approach to capital account liberalisation has been an important component of macroeconomic policies to ensure financial stability. Safeguards developed over a period of time to limit the contagion include: low current account deficit; comfortable foreign exchange reserves; low level of short-term debt; and absence of asset price inflation or credit boom. These positive features were the result of prudent policies pursued over the years notably, cap on external commercial borrowings with restrictions on end-use, low exposure of banks to real estate and stock market, insulation from large intermediation of overseas capital by the banking sector, close monitoring of off-balance sheet items and tight legislative, regulatory and prudential control over non-bank entities (RBI, 2004).
8.45 Overall, the Reserve Bank's approach is to minimise volatility in the financial markets and, in public policy, minimise knee-jerk reactions, while focusing on price stability and the underlying inflation (Reddy, 2004b). The objective has been to ensure that there are no avoidable uncertainties in policy, while mitigating undue pressures on the functioning of markets without undermining market efficiency. These issues have come to the forefront during 2004 with the upturn in the interest rate cycle. As interest rates fell consistently in recent years, market participants were not fully prepared for the inevitable turn in the interest rate cycle. With the gradual increase in market yields since early 2004, market participants have now begun to get a feel of this interest rate cycle for the first time, even as the Reserve Bank had been continuously highlighting this possibility in its policy pronouncements. Against these developments, the Reserve Bank's endeavour has been to facilitate adaptation to the new environment by working together with the banking system to ensure that the appropriate systems to withstand interest rate cycles are built more consciously.
8.46 The stability of the Indian financial system has been tested on certain occasions, the most recent being in May 2004. A brief discussion of the policy response would be apposite. On May 17, 2004, the stock market witnessed turbulent conditions, caused mainly by political uncertainty after the general elections. External factors such as rising oil prices and apprehensions of rise in international interest rates also contributed to the sudden reversal of market sentiment. In response to these market developments, the Reserve Bank initially intervened in the forex market and once it was realised that there were no spillovers into other markets, maintaining the integrity of the payment and settlement system assumed prominence. Accordingly, the Reserve Bank operated at three different levels. First, settlement banks were informed that in case of liquidity problems, they could access the 'backstop facility' under LAF from the Reserve Bank. Second, a statement was made informing market participants that there was no shortage of liquidity in the system, either in domestic or foreign currency. Finally, this was followed by a statement that carried credibility for the system at large. A Task Force was also constituted for providing clarifications and liquidity assistance. Certain prudential relaxations were provided for a temporary period to market players in the light of market conditions and the same was subsequently restored to normal levels once markets returned to normal functioning. The idea inherent in the Reserve Bank’s strategy during this period was to ensure no transmission of panic from equity markets to other markets. Thus, stability in the financial markets was maintained even as the Reserve Bank did not take any view on the equity markets (Reddy, 2004d).
8.47 To sum up, by maintaining relatively low inflation and stabilising inflation expectations, in particular, monetary policy in India has created a conducive environment for financial stability. Second, given the limited capacity of economic agents to manage volatility in developing economies like India, a central bank has a key role to play in maintaining stability in financial markets. In the Indian context, the Reserve Bank has been able to maintain stability in the financial markets through a judicious use of instruments - both existing as well as by developing innovative instruments. The central bank acts as a shock absorber to ensure stability as it manages volatility in the system.
Regulatory and Supervisory Initiatives
8.48 As indicated above, in the pursuit of financial stability, monetary policies need to be supported by proactive regulatory and supervisory initiatives in regard to the financial sector. In what follows, a brief overview of the Indian financial system is presented followed by a discussion of the various initiatives and an assessment of the health of the financial sector. The financial sector in India is sufficiently deep (Table 8.11). Financial savings have grown steadily in line with developments and liberalisation of the financial sector, reflecting high savings rate (24.2 per cent in 2002-03) and prudent management that has fostered macroeconomic stability.
8.49 The financial sector, which was closed and tightly regulated till the early 1990s, has become open and competitive. The approach towards financial sector reforms has been based on pancha sutra or five principles (Reddy, 1998): (a) cautious and appropriate sequencing of reform measures; (b) introduction of norms that are mutually reinforcing; (c) introduction of complementary reforms across sectors (most importantly, monetary, fiscal and external sector); (d) development of financial institutions; and, (e) development of financial markets. The reforms have aimed at enhancing productivity and efficiency of the financial sector, improving the transparency of operations and ensuring that it is capable of withstanding idiosyncratic shocks. Interest rates were gradually liberalised, directed credit allocations were expanded to encompass an extended range of activities, competition was increased in the banking sector and the insurance sector was opened up to private competition. At the same time, the regulatory and supervisory apparatus was strengthened. Salient features of the Indian financial system are briefly discussed below: l Commercial banks are the most important financial intermediaries, accounting for about 66 per cent of total assets and public sector banks (PSBs) dominate the sector, comprising nearly 47 per cent of the banking system assets. New private and foreign banks, whose activities were limited until the onset of reforms, represent a rising share of the sector, promoting new financial products with strong technological backup2.
- A large network of regional rural banks (RRBs) and cooperative banks (rural and urban) serves borrowers in rural and urban areas. The RRBs were established under an Act of Parliament with the Central Government, State Governments and sponsor PSBs all taking holdings in them to improve credit delivery in rural areas. The cooperative banks cater to the credit needs of specific communities or groups of people in a region and comprise both rural and urban entities.
- The ter m-lending institutions are mostly gover nment-owned and have been the traditional providers of long-term project loans. Accounting for approximately six per cent of total assets, these institutions raise funds in capital markets as well as through retail sales of savings instruments. Over the past few years, two such institutions have since transformed into a bank.
- Investment institutions are currently largely in public domain, although the sector has since been opened up to private participation. The Life Insurance Corporation of India has a dominant position in the public sector category.
- Non-life insurance providers - the General Insurance Corporation of India and its four erstwhile subsidiaries - account for two per cent of total financial sector assets.
- State-level institutions - the State Financial Corporations registered under the State Financial Corporations Act, 1951 and the State Industrial Development Corporations (SIDCs) - purvey credit to industries/sectors in different states and account for about 0.8 per cent of total assets3.
- There are also the Deposit Insurance and Credit Guarantee Corporation (DICGC), a wholly-owned subsidiary of the Reserve Bank providing insurance for deposits with commercial and cooperative banks and the Expor t Credit
2 In March 2004, the Government of India issued notification while raising foreign direct investment limit in private sector banks up to a maximum of 74 per cent under the automatic route, including the investments made by foreign institutional investors. According to the Government’s notification, foreign banks are permitted to have either branches or subsidiaries only. They may operate in India through one of the three channels, viz., (i) branch/es; (ii) wholly-owned subsidiary; or (iii) a subsidiary with aggregate foreign investment up to a maximum of 74 per cent in a private bank.
3 Other institutions established to meet specific financing needs include Power Finance Corporation (PFC) and Rural Electrification Corporation (REC) (financial assistance to the power sector) and Indian Railway Finance Corporation (IRFC), which is the capital market financing arm of Indian Railways. These institutions have been notified as Public Financial Institutions (PFIs) under the Companies Act, 1956. In addition, at the state-level, there exist the North Eastern Development Finance Corporation (extending credit to industry/agricultural concerns in the North Eastern region) and Technical Consultancy Organisations (providing technical inputs for feasibility studies on viability of projects).
|
Table 8.11: Structure of Indian Financial System, end-March 2004 |
||||
|
(Amount in Rupees crore) |
||||
|
Institution |
No. of |
Outstanding |
Asset |
|
|
Institutions |
Asset |
(% to total) |
||
|
1 |
2 |
3 |
4 |
|
|
Financial Sector (A+B) |
3,124,427 |
100 |
||
|
A. Banking Sector (1+2) |
2,347,337 |
75.1 |
||
|
1. Commercial banks (a+b) |
291 |
2,045,948 |
65.5 |
|
|
(a) Scheduled commercial banks |
286 |
2,045,748 |
65.5 |
|
|
Public sector banks |
27 |
1,471,428 |
47.1 |
|
|
State Bank group |
8 |
5,49,257 |
17.6 |
|
|
Nationalised banks |
19 |
9,22,171 |
29.5 |
|
|
Private sector banks |
30 |
3,67,276 |
11.8 |
|
|
Old private banks |
20 |
1,20,700 |
3.9 |
|
|
New private banks |
10 |
2,46,576 |
7.9 |
|
|
Foreign banks |
33 |
1,36,316 |
4.4 |
|
|
Regional rural banks |
196 |
70,728 |
2.3 |
|
|
(b) Non-scheduled commercial banks |
5 |
200 |
0.01 |
|
|
2. Cooperative banks (a+b) |
3111 |
3,01,589 |
9.7 |
|
|
(a) Rural cooperative banks |
1185 |
1,78,984 |
5.7 |
|
|
Short-term structure* |
397 |
1,72,595 |
5.5 |
|
|
Long-term structure |
788 |
6,389 |
** |
0.2 |
|
(b) Urban cooperative banks |
1926 |
1,22,605 |
** |
3.9 |
|
of which: Scheduled |
55 |
56,256 |
1.8 |
|
|
B. The Broader Financial Sector (3 to 7) |
7,77,090 |
24.9 |
||
|
3. Term lending institutions |
8 |
2,00,089 |
6.4 |
|
|
IDBI |
1 |
66,921 |
2.1 |
|
|
IFCI |
1 |
20,293 |
0.6 |
|
|
EXIM Bank |
1 |
15,552 |
0.5 |
|
|
NABARD |
1 |
55,889 |
1.8 |
|
|
NHB |
1 |
13,108 |
0.4 |
|
|
IIBI |
1 |
3,073 |
0.1 |
|
|
SIDBI |
1 |
19,327 |
0.6 |
|
|
IDFC |
1 |
5,926 |
0.2 |
|
|
4. Investment institutions |
7 |
4,66,306 |
14.9 |
|
|
UTI4 |
1 |
57,946 |
1.9 |
|
|
LIC |
1 |
3,46,119 |
11.1 |
|
|
GIC |
1 |
16,441 |
0.5 |
|
|
Former subsidiaries of GIC # |
4 |
45,800 |
1.5 |
|
|
5. State-level Institutions |
46 |
25,012 |
0.8 |
|
|
SFCs |
18 |
12,712 |
0.4 |
|
|
SIDCs |
28 |
12,300 |
0.4 |
|
|
6. Other Institutions |
2 |
10,477 |
0.3 |
|
|
DICGC |
1 |
8,740 |
&* |
0.28 |
|
ECGC |
1 |
1,737 |
0.06 |
|
|
7. Non-banking financial companies |
892 |
75,206 |
2.4 |
|
|
NBFC $ |
870 |
37,709 |
1.2 |
|
|
RNBC |
5 |
20,362 |
0.7 |
|
|
Primary Dealers |
17 |
17,135 |
0.5 |
|
|
Memo |
||||
|
C. Capital Markets (8 to 9) |
1,340,823 |
100 |
||
|
8. Equity |
1,201,207 |
#* |
89 |
|
|
9. Mutual Funds |
1,39,616 |
11 |
||
|
Public |
34,624 |
3 |
||
|
Private |
1,04,992 |
8 |
||
|
Note : Data for rural cooperative banks
pertain to end-March 2003; Data on SFCs, |
||||
Guarantee Corporation (ECGC), providing guarantee cover to exports. Their share of total financial sector assets approximates 0.3 per cent.
- Non-bank financial companies provide a gamut of services and account for roughly two per cent of financial sector assets. This sector witnessed a rapid growth in the mid 1990s, but consequent upon the introduction of new norms for their registration and functioning, growth has since slowed down and the Reserve Bank has authorised 584 NBFCs to accept/hold public deposits.
- Primary dealers are active players in the Government securities market. Numbering 17, they account for 0.5 per cent of assets. The majority of them are promoted by banks, which largely continue to retain majority stakes in their sponsored primary dealers. In 2003-04, they accounted for 25 per cent of the outright market turnover.
- There are 23 stock exchanges in India, dominated by the two large exchanges: National Stock Exchange of India (NSE) and the Stock Exchange, Mumbai (BSE). The functioning of the stock exchanges has witnessed significant developments after the initiation of reforms in the 1990s. At end-March 2004, market capitalisation was Rs.1,201,207 crore, while turnover aggregated Rs.5,02,620 crore at the BSE; turnover in equity derivatives was also significant at Rs.2,130,610 crore at the NSE.
Policy Measures and Performance Scheduled Commercial Banks: Policy Initiatives
8.50 The commercial banking sector occupies a central position in systemic stability because of its dominance in the financial system as well as through its crucial payment focus. Strengthening of prudential supervision coupled with the gamut of measures undertaken by the Government/Reserve Bank has significantly improved the health of the sector (Box VIII.4 and Table 8.12). The Reserve Bank's approach to the institution of prudential norms has been one of gradual convergence with international best practices with suitable country specific adaptations. As a result of improvements in the regulatory and supervisory framework, the degree of compliance with Basel Core Principles has generally been high, and observed areas of weaknesses, primarily with respect to country risk guidelines have been addressed. Consolidated accounting for banks has been introduced along with a system of risk-based supervision (RBS) for intensified monitoring of vulnerabilities. RBS will facilitate allocation of supervisory resources by focusing them on relatively vulnerable banks and in areas in which a bank is relatively more vulnerable. The RBS Manual, customising the international best practices to Indian conditions, has been finalised and the RBS scheme has been extended on a pilot basis to 23 banks. A scheme of Prompt Corrective Action (PCA) was introduced effective December 2002 to undertake 'structured' and 'discretionary' actions against banks exhibiting vulnerabilities in certain prudential/financial parameters.
4 In terms of Unit Trust of India (Transfer of Undertaking and Repeal) Act, 2002, the schemes of Unit Trust of India have been transferred and stand vested in two entities viz., the Administrator of the Specified Undertaking of the Unit Trust of India and the UTI Mutual Fund with effect from February 2003. Consequently, UTI’s financial data pertain to the period July-January 2002-03.
Box VIII.4
Prudential Financial Sector Regulation
A number of regulatory bodies are involved in financial stability in India. The Reserve Bank of India (RBI), the Securities and Exchange Board of India (SEBI), the Insurance Regulatory and Development Authority (IRDA), the National Bank for Agriculture and Rural Development (NABARD), the National Housing Bank (NHB) and the Department of Company Affairs (DCA) along with the Ministry of Finance all have an overarching interest in the promotion of financial stability.
The preamble to the Reserve Bank of India, 1934 sets out the objectives of the Reserve Bank as 'to regulate the issue of bank notes and the keeping of reserves with a view to securing monetary stability in India and generally to operate the currency and credit system of the country to its advantage'. With respect to financial stability, the Reserve Bank is entrusted with the sole responsibility of regulation and supervision of commercial and urban cooperative banks under the Banking Regulation Act, 1949. In addition, the Reserve Bank also regulates and supervises nine select development finance institutions (eight since October 2004 subsequent upon the conversion of IDBI into a scheduled bank), non-banking financial companies and primary dealers. In addition, the Reserve Bank also contributes to financial stability by:
- promoting the sound development of the financial system and
- maintaining orderly conditions in financial markets via the promotion of prudent regulation, the development and adoption of new technology, prudential documentation and a robust legal framework.
In its supervisory role, the Reserve Bank carries out both on-site inspection and off-site surveillance and has in recent times, moved towards a risk-based supervisory framework. In 1994, a Board for Financial Supervision (BFS) was constituted under the aegis of the Reserve Bank to exercise 'undivided attention to supervision'. The RBI's supervisory responsibilities were expanded in 1995 to include select development finance institutions and in 1997 to include non-banking financial companies and thereafter in 2001 to include primary dealers. The BFS ensures an integrated approach to supervision of commercial banks, development finance institutions, non-banking financial companies, urban cooperative banks and primary dealers. Illustratively, the Department of Banking Operations and Development regulates the banking sector, while the responsibility of bank supervision rests with the Department of Banking Supervision. Select development finance institutions are regulated and supervised by the Financial Institutions Division. Rural Planning and Credit Department regulates regional rural banks (their supervision rests with the NABARD), the Urban Banks Department regulates and supervises urban cooperative banks, while non-banking financial companies are regulated and supervised by Department of Non-Banking Supervision. Finally, Primary Dealers are regulated and supervised by the Internal Debt Management Department. As part of the Reserve Bank's initiatives in adopting international best practices for monitoring stability of the financial system in India, the Bank has been compiling macroprudential indicators (MPIs) from March 2000 onwards.
In terms of the relationship among the three main regulatory agencies (i.e., Reserve Bank, SEBI and IRDA), earlier there existed no formal arrangement to this effect. In 1999, a High Level Co-ordination Committee on Financial and Capital Markets (HLCCFCM) was constituted, comprising the Governor, Reserve Bank, Chairman, SEBI and Chairman, IRDA along with the Finance Secretary, Government of India to iron out regulatory gaps and overlaps. More recently, the process of coordination among the regulatory agencies has been strengthened with the setting up of a special monitoring system for Systemically Important Financial Intermediaries (SIFIs), defined as (a) a group entity coming under the jurisdiction of specified regulators and having a significant presence (defined in terms of its position in the top 70 per cent of asset /deposit base or turnover) in the respective financial market segment and (b) having operations in at least one more financial market segment. The process has developed (a) a reporting system for SIFIs on financial matters of common interest to the Reserve Bank, SEBI and IRDA; (b) the reporting of intra-group transactions of SIFIs; and (c) the exchange of relevant information among Reserve Bank, SEBI and IRDA. The following actions have been initiated: (i) twenty four conglomerates have been identified and the first report based on the prescribed format is under compilation; (ii) a nodal cell has been established at the Reserve Bank for smooth implementation of the framework.
8.51 In view of banks being 'special', issues of ownership, size and governance have gained importance from the standpoint of financial stability. Banks are special in the sense that being financial intermediaries, they are critical for mobilising public
|
Table 8.12: Evolution of Prudential Norms for the Banking Sector |
||||||||
|
Variable |
1992-93 |
1995-96 |
1999-2000 |
2001-02 |
2002-03 |
2003-04 |
||
|
1 |
2 |
3 |
4 |
5 |
6 |
7 |
||
|
1. CRAR |
||||||||
|
(% of risk weighted asset) |
||||||||
|
Domestic banks with international |
4 |
8 |
9 |
9 |
9 |
9 |
||
|
business |
||||||||
|
Other domestic banks |
4 |
8 |
9 |
9 |
9 |
9 |
||
|
Foreign banks |
8 |
8 |
9 |
9 |
9 |
9 |
||
|
2. |
Non-performing asset |
|||||||
|
(period overdue in quarters) |
||||||||
|
Sub-standard assets |
4 |
2 |
2 |
2 |
2 |
1 |
||
|
Doubtful assets |
8 |
8 |
8 |
6 |
6 |
4* |
||
|
3. |
Provisioning requirements |
|||||||
|
(% of corresponding asset) |
||||||||
|
Standard asset ** |
0.25 |
0.25 |
0.25 |
0.25 |
||||
|
Sub-standard asset |
10 |
10 |
10 |
10 |
10 |
10 |
||
|
Doubtful asset |
||||||||
|
Secured portion |
20-50 |
20-50 |
20-50 |
20-50 |
20-50 |
20-50 |
||
|
Unsecured portion |
100 |
100 |
100 |
100 |
100 |
100 |
||
|
Loss asset |
100 |
100 |
100 |
100 |
100 |
100 |
||
|
4. |
Mark to market (%) |
30 |
40 |
75 |
$$ |
$$ |
$$ |
|
|
*Effective March 31, 2005; |
||||||||
savings and for deploying them to provide safety and return to the savers. For an emerging economy like India, there is also much less tolerance for downside risks among depositors many of whom place their entire savings in the banks. Hence, there is a more onerous responsibility on the regulator (Mohan, 2004b). Accordingly, in July 2004, the Reserve Bank issued draft guidelines on ownership for discussion and feedback, which are in consonance with the regulatory regimes in major countries. The objective of these guidelines is to have a regulatory road map for ownership and governance in private sector banks in the interest of depositors and financial stability. The draft guidelines envisage diversified ownership and restrictions on cross-holding of banks.
8.52 Safety and soundness in the banking system can be strengthened by market discipline through enhanced transparency in bank's disclosures to the public. Accordingly, the Reserve Bank has decided to disclose the penalties imposed by it on banks. Effective November 1, 2004, the Reserve Bank would issue a press release giving details of the circumstances under which the penalty is imposed on a bank and would also place the communication on the imposition of penalty to the bank in public domain.
8.53 With liberalisation, financial conglomerates are emerging. The Reserve Bank has, therefore, focused on consolidated supervision. Banks have been advised to prepare and disclose consolidated financial statements and prepare consolidated prudential reports. The inter-regulatory coordination has also been streamlined with the establishment of a monitoring system in respect of Systemically Important Financial Intermediaries (SIFIs), coupled with the establishment of three Standing Technical Committees constituted by the High Level Coordination Committee on Financial and Capital Markets (HLCCFCM) to provide a more focused inter-agency forum for sharing of information and intelligence. The reporting framework under SIFI would (a) capture intra-group transactions and exposures among group entities within the identified financial conglomerate and large exposures of the group; (b) track any unusual movement in respect of intra-group transactions manifested in major markets and (c) track any direct/ indirect cross-linkages amongst group entities. Individual group transactions beyond threshold levels (Rs.1 crore for fund based transactions and Rs.10 crore for others) would be incorporated in the reporting format.
8.54 In the context of financial stability, both crisis prevention and crisis management and resolution assume importance. In this respect, availability of the lender-of-last-resort facility can play an important role. In India, liquidity adjustment facility (LAF) has evolved as an effective mechanism for absorbing and/or injecting liquidity on a day-to-day basis in a more flexible manner. Nevertheless, in some very rare and unusual circumstances, a situation may arise when a bank faces a sudden and unforeseen liquidity problem particularly outside the normal LAF auction timings and on days on which such auctions are not held. In such exceptional and unforeseen circumstances, the Reserve Bank has indicated that, at its discretion, it may extend liquidity support to such a bank if the said bank is otherwise financially sound, and after taking into account other relevant factors. The liquidity support in such exceptional circumstances will be made available only for a minimum number of days required to overcome the unexpected liquidity pressure. Such liquidity support will be available against eligible securities with adequate margin and other conditions as the Reserve Bank may consider appropriate.
8.55 A related issue is approach towards treatment of insolvent banks. Rather than closing them down, policymakers in India have shown a preference to merge such banks with healthy public sector banks. As regards concerns that such an approach may give rise to a moral hazard problem, two issues need consideration. First, commercial banks are the most dominant and systemically important segment of the financial system. Second, over 70 per cent of the bank depositors in India are small depositors. Therefore, systemic concerns coupled with the necessity to safeguard the interest of such depositors have been paramount in the minds of policy makers while dealing with insolvent banks (Mohan, 2004c).
Scheduled Commercial Banks: Performance
8.56 Since the reforms began in the early 1990s, financial performance, especially of public sector banks, has gradually improved. Illustratively, the return on assets (RoA) of public sector banks has improved markedly over the last few years, to reach 1.1 per cent of total assets in 2003-04 (Table 8.13). Operating expenses have also been by and large contained. Most other bank groups also witnessed similar improvements, although provisioning levels for old private banks have declined. Since the initiation of reforms, the financial health as well as efficiency of the public sector banks has closely matched and for several such banks, even surpassed their private sector and foreign counterparts. The competitive pressures induced by the new private sector and foreign banks has re-energised the Indian banking sector as a whole: new technology is now the norm, new products are being introduced continuously, and new business practices have become common place (Mohan, 2004c).
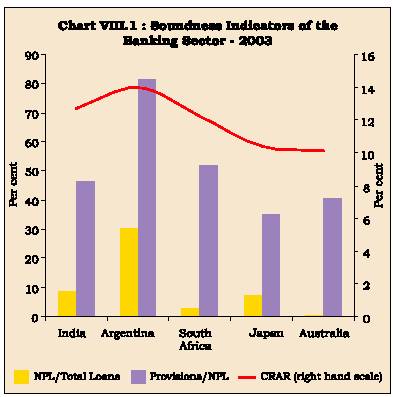
8.57 Regarding asset quality, the ratio of gross non-performing loans (NPL) to total loans which was at a high of 15.7 per cent for SCBs at end-March 1997 witnessed a marked decline to 7.2 per cent at end-March 2004. Net NPLs also witnessed a significant decline, driven by the improvements in loan loss provisioning, which comprises over half of the total provisions and contingencies. At the same time, in view of the impending Basel II with its focus on operational and market risks, in addition to credit risks, banks have improved their capital adequacy ratio. The overall capital adequacy ratio of SCBs at end-March 2004 was 12.9 per cent; for most banks, the ratio was higher than this figure, as against the regulatory requirement of nine per cent (Table 8.14). All banks (except one), including the systemically important banks, satisfy the regulatory
|
Table 8.13: Indicators of Financial Performance of the Banking Sector |
||||||||||||
|
(per cent to total asset) |
||||||||||||
|
Bank Group |
Operating Expenses |
Provisioning expenses |
Net interest margin |
Return on asset |
||||||||
|
2001- |
2002- |
2003- |
2001- |
2002- |
2003- |
2001- |
2002- |
2003- |
2001- |
2002- |
2003- |
|
|
02 |
03 |
04 |
02 |
03 |
04 |
02 |
03 |
04 |
02 |
03 |
04 |
|
|
1 |
2 |
3 |
4 |
5 |
6 |
7 |
8 |
9 |
10 |
11 |
12 |
13 |
|
Public sector banks |
2.29 |
2.25 |
2.20 |
1.16 |
1.36 |
1.56 |
2.73 |
2.91 |
2.97 |
0.72 |
0.96 |
1.12 |
|
Private sector banks |
1.44 |
1.99 |
2.02 |
1.07 |
1.44 |
1.29 |
1.58 |
1.97 |
2.18 |
0.66 |
1.00 |
0.95 |
|
Old private banks |
2.07 |
2.05 |
1.97 |
1.62 |
1.50 |
1.45 |
2.39 |
2.47 |
2.60 |
1.08 |
1.17 |
1.20 |
|
New private banks |
1.10 |
1.96 |
2.04 |
0.78 |
1.41 |
1.21 |
1.15 |
1.70 |
1.98 |
0.44 |
0.90 |
0.83 |
|
Foreign banks |
3.00 |
2.79 |
2.75 |
1.78 |
1.63 |
2.01 |
3.22 |
3.35 |
3.46 |
1.32 |
1.56 |
1.65 |
|
Scheduled commercial |
2.19 |
2.24 |
2.20 |
1.19 |
1.39 |
1.54 |
2.57 |
2.77 |
2.86 |
0.75 |
1.01 |
1.13 |
|
banks |
||||||||||||
|
Source : Reserve Bank of India. |
||||||||||||
|
Table 8.14: Soundness Indicators of the Banking Sector in India |
||||||||||||
|
(per cent) |
||||||||||||
|
Bank Group |
Capital Adequacy |
NPL/Total Loans |
Provisions/NPL |
Capital/Asset |
||||||||
|
Ratio |
||||||||||||
|
2001-02 |
2002-03 |
2003-04 |
2001-02 |
2002-03 |
2003-04 |
2001-02 |
2002-03 |
2003-04 |
2001-02 |
2002-03 |
2003-04 |
|
|
1 |
2 |
3 |
4 |
5 |
6 |
7 |
8 |
9 |
10 |
11 |
12 |
13 |
|
Public sector banks |
11.8 |
12.6 |
13.2 |
11.1 |
9.4 |
8.1 |
43.9 |
47.2 |
57.5 |
5.3 |
5.6 |
5.8 |
|
Private sector banks |
||||||||||||
|
Old private banks |
12.5 |
12.8 |
13.7 |
11.0 |
8.9 |
7.7 |
31.4 |
35.8 |
47.1 |
6.3 |
6.8 |
6.6 |
|
New private banks |
11.6 |
11.3 |
10.6 |
8.9 |
7.6 |
4.8 |
45.3 |
42.1 |
53.4 |
8.6 |
7.9 |
6.8 |
|
Foreign banks |
12.9 |
15.2 |
15.0 |
5.4 |
5.2 |
4.9 |
57.2 |
58.9 |
61.9 |
8.9 |
10.9 |
10.6 |
|
Scheduled |
||||||||||||
|
commercial banks |
11.9 |
12.7 |
12.9 |
10.4 |
8.8 |
7.3 |
43.7 |
46.4 |
56.6 |
6.0 |
6.3 |
6.3 |
|
Source : Reserve Bank of India (various years). |
||||||||||||
capital adequacy requirements5. Only one bank had capital adequacy ratio below the regulatory minimum at end-March 2004, but its share in total banking sector assets was less than 0.5 per cent. Notwithstanding definitional differences, the capital adequacy ratio of the Indian banks is broadly comparable with the international levels. However, emerging markets with a high quantum of NPL also tend to have higher provisions. Finally, the capital to asset ratio of banks is also in consonance with international levels (Table 8.15 and Chart VIII.1).
8.58 Since the 1980s, the Government has injected funds towards strengthening the capital base of nationalised banks. There appear to be three distinct phases of recapitalisation: phase I (regular and general) covering the period 1984-85 to 1992-93 when all nationalised banks were recapitalised without any preset norm; phase II (pre-designed under a recovery programme) covering the period 1993-1995, when financial sector reforms were given a big push and recapitalisation of all nationalised banks had to be accorded priority; and, phase III (case-by-case basis)
|
Table 8.15: Soundness Indicators of the Banking Sector - International Comparison |
||||||||||||
|
(per cent) |
||||||||||||
|
Year |
Capital Adequacy |
NPL/Total Loans |
Provisions/NPL |
Capital/asset |
||||||||
|
Ratio |
||||||||||||
|
2001-02 |
2002-03 |
2003-04 |
2001-02 |
2002-03 |
2003-04 |
2001-02 |
2002-03 |
2003-04 |
2001-02 |
2002-03 |
2003-04 |
|
|
1 |
2 |
3 |
4 |
5 |
6 |
7 |
8 |
9 |
10 |
11 |
12 |
13 |
|
Developed economies |
||||||||||||
|
US |
12.8 |
12.8 |
12.8 |
1.5 |
1.2 |
1.1 |
127.2 |
145.8 |
156.2 |
9.2 |
9.1 |
9.2 |
|
UK |
12.2 |
12.5 |
.. |
2.6 |
2.2 |
.. |
72.3 |
.. |
.. |
6.7 |
6.8 |
.. |
|
Japan |
10.9 |
10.4 |
.. |
8.9 |
7.2 |
.. |
31.6 |
34.9 |
.. |
3.0 |
.. |
.. |
|
Canada |
12.2 |
13.3 |
13.3 |
1.6 |
1.2 |
1.0 |
41.1 |
43.5 |
46.2 |
4.6 |
4.7 |
4.7 |
|
Australia |
9.9 |
10.1 |
10.1 |
0.6 |
0.4 |
0.4 |
36.5 |
40.8 |
39.7 |
6.3 |
5.8 |
5.9 |
|
Emerging economies |
||||||||||||
|
Argentina |
.. |
14.0 |
14.0 |
37.4 |
30.5 |
27.7 |
73.3 |
81.2 |
83.8 |
13.9 |
12.2 |
11.5 |
|
Brazil |
16.7 |
18.9 |
.. |
5.3 |
4.4 |
.. |
143.5 |
165.6 |
.. |
13.5 |
16.2 |
.. |
|
Mexico |
15.5 |
14.2 |
14.5 |
4.6 |
3.2 |
3.2 |
138.1 |
167.1 |
167.4 |
11.1 |
11.4 |
11.5 |
|
Korea |
10.5 |
10.5 |
.. |
1.9 |
2.6 |
.. |
109.4 |
.. |
.. |
4.0 |
4.1 |
.. |
|
India |
11.9 |
12.7 |
12.9 |
10.4 |
8.8 |
7.3 |
43.7 |
46.4 |
56.6 |
6.0 |
6.3 |
6.3 |
|
South Africa |
12.6 |
12.2 |
12.7 |
3.3 |
2.5 |
2.3 |
42.9 |
52.0 |
.. |
8.2 |
7.0 |
6.9 |
|
Source: RBI and Global Financial Stability Report, IMF (2004). |
||||||||||||
5 In order to ensure smooth transition to Basel II norms, the Annual Policy Statement 2004-05 proposed to phase the implementation of capital charge for market risk in respect of their trading book exposures (including derivatives) by March 31, 2005 and banks would be required to maintain capital charge in respect of the securities included under the ‘available for sale’ category by March 31, 2006.
The Banking Companies (Acquisition and Transfer of Undertakings) Act, 1970/1980 and the State Bank of India Act, 1955 were amended to allow banks to raise capital not exceeding 49 per cent of their equity. Equity sales in the market aggregating over Rs.8,000 crore have been made by the PSBs, with several banks approaching the market twice. Over the period 1993-2004, as many as 17 PSBs have accessed the capital market; their divestment presently ranges from 57 - 75 per cent.
8.59 An assessment of the key performance indicators suggests that there is still room for further improvement. First, there is headroom to improve the capital cushion in terms of Tier-I capital, in order to build up a cushion against market, operational and other non-measured risks. Second, notwithstanding improvement in credit quality, NPLs at Rs.64,786 crore remain high with gross NPL/gross advances at 7.2 per cent at end-March 20046. Third, most emerging markets with high quantum of sticky assets also have high 'coverage' (i.e., provisions/NPL). Despite the improvements in 'coverage' by Indian banks over the last few years, it remains low compared to international standards. Some significant recoveries have been effected under the SARFAESI Act, 2002 (Rs.1,748 crore at end-June 2004) and other accompanying measures (Rs.18,899 crore)7 .
8.60 On the positive side, first, loan classification norms in India are, at present, on par with international best practices, so that the decline in NPL has occurred despite the gradual switchover to more stringent norms.
|
Table 8.16: Recapitalisation and Return of Capital by Nationalised Banks |
||||||
|
(Rupees crore) |
||||||
|
Year |
Amount |
Amount |
Amount |
Amount raised |
Memo: |
|
|
recapitalised |
returned to |
written off |
from the |
Dividend paid |
||
|
the Government |
capital market |
to Government |
||||
|
1 |
2 |
3 |
4 |
5 |
6 |
|
|
Up to 1992-93 |
4,000 |
.. |
.. |
.. |
187# |
|
|
1993-94 to 1994-95 |
10,987* |
.. |
.. |
2,472 |
18 |
|
|
1995-96 to 2003-04 |
7,529 |
1,303 |
8,680 |
5,752 |
3,048** |
|
|
Total |
22,516 |
1,303 |
8,680 |
8,224 |
3,253 |
|
|
*including Rs.925 crore as part of Tier II capital. |
||||||
6 Using a dynamic panel framework to examine the determinants of problem loans in state-owned banks in India, Das and Ghosh (2003) find that at the macro level, GDP growth and at the micro level, real loan growth, operating expenses and bank size as the factors affecting problem loans.
7 These included selling of assets to Asset Reconstruction Company of India Ltd. (Rs.9,631 crore), recoveries under Debt Recovery Tribunal (Rs.7,845 crore) and recoveries under compromise settlement (Rs.1,095 crore) and Lok Adalats (Rs. 328 crore).
Second, the difference between gross and net NPL has gradually narrowed, reflecting the improved loan loss provisions by the banking sector, despite the differential provisioning levels across bank groups8. Third, profitability of the banking sector has improved in recent years, with return on assets trending at around one per cent, a figure comparable with international levels (Table 8.17). A part of this high profitability level was the result of high trading incomes in a soft interest regime. The significant improvement in non-interest income notwithstanding, its share in total income for PSBs is still around 20 per cent, compared with about 25 per cent for foreign banks.
8.61 Another notable feature has been that banks' exposure limits in India have gradually been brought on par with international standards. Effective March 31, 2002, the exposure ceiling is computed in relation to total capital as defined under capital adequacy standards (Tier-I plus Tier-II) and includes credit exposure (funded and non-funded credit limits) and investment exposure (underwriting and similar commitments). The exposure limits for single borrowers, at present, stand at 15 per cent and that for group borrowers at 40 per cent; the latter is extendible by an additional 10 per cent in case of financing infrastructure projects (Table 8.18).
|
Table 8.17: Return on Assets – Cross-Country Comparison |
|||
|
(per cent) |
|||
|
Country |
2001-02 |
2002-03 |
2003-04 |
|
1 |
2 |
3 |
4 |
|
Developed economies |
|||
|
US |
1.3 |
1.4 |
1.4 |
|
UK |
0.9 |
1.1 |
.. |
|
Japan |
-0.7 |
-0.6 |
.. |
|
Canada |
0.4 |
0.7 |
.. |
|
Australia |
1.2 |
1.1 |
.. |
|
Emerging economies |
|||
|
Argentina |
-9.7 |
-2.5 |
-3.2 |
|
Brazil |
1.9 |
1.6 |
.. |
|
Mexico |
-1.1 |
1.7 |
1.7 |
|
India |
0.8 |
1.0 |
1.1 |
|
Philippines |
0.8 |
1.1 |
1.1 |
|
Korea |
0.6 |
0.1 |
.. |
|
South Africa |
0.4 |
0.8 |
1.2 |
|
Source : RBI and Global Financial Stability Report (2004). |
|||
|
Table 8.18: Cross-Country Limits for Loan Exposure to Single Borrower |
|
|
Country |
Per cent of capital |
|
1 |
2 |
|
Chile |
5 |
|
China, Colombia, Mexico |
10 |
|
Argentina, India, Israel, Korea, United States |
15 |
|
Brazil, Hong Kong, Hungary, Japan, Malaysia, |
|
|
Philippines, Poland, Russia, Singapore, Thailand |
25 |
|
Australia |
30 |
|
For United States, 10-25% for state-chartered banks; For Thailand as per cent of tier-I capital. |
|
|
Source: Hawkins and Turner (1999) and Morris (2001). |
|
8.62 Banks foreign exchange exposure is limited by position limits, which in most cases, limit a bank's open position to 15 per cent of Tier I capital. Foreign exchange-related credit risk is limited and the magnitude of foreign currency lending is small (around 5 per cent of gross advances at end-March 2004).
8.63 Interest rate risk could be important in the event of a large shock. The 'gap' method estimates indicate that an increase of 200 basis points in interest rate is likely to have a positive impact of 4.9 per cent on banks' net interest income, with the largest impact being on PSBs (RBI, 2003). To safeguard banks’ investment portfolio against adverse movements in interest rate risk, the Reserve Bank advised banks to build up an Investment Fluctuation Reserve (IFR) of a minimum of five per cent of investments under ‘Available for Sale’ (AFS) and ‘Held for Trading’ (HFT) categories, within a period of five years (i.e., by end-March 2006) beginning end-March 2002. At end-March 2004, 20 PSBs had build up IFR of three per cent and above. Bank group-wise, the IFR ratio was the highest for PSBs (3.1 per cent) and the lowest for new private banks (2.3 per cent).
8.64 Banks exposure to sensitive sectors (capital market, real estate and commodities) remains low (Table 8.19). While public sector banks have negligible exposure to the equity market, it remains slightly higher for new private banks. The vulnerability on this count appears to be limited. The buoyancy in the housing market has increased banks' exposure to real estate: at 1.6 per cent of total loans in 2003-04, this, however, is within the overall cap of 5 per cent to sensitive sectors9. Nonetheless, banks need to be on guard against rise in loans to the housing sector. Cross-country evidence suggests that (a) housing
8 In June 2004, the Reserve Bank introduced graded higher provisioning on the secured portion of NPAs as on March 31, 2004, ranging from 60 per cent to 100 per cent over a period of three years in a phased manner, with effect from March 31, 2005. However, in respect of all advances classified as 'doubtful for more than three years' on or after April 1, 2004, the provisioning requirement would be 100 per cent. The provisioning requirement for unsecured portion of NPAs under the above category would be 100 per cent as hitherto.
9 As a temporary measure, the Reserve Bank has increased the risk weight on housing loans from 50 per cent to 75 per cent as a risk containment measure.
|
Table 8.19: Banks’ Exposure to Sensitive Sectors |
|||||||||
|
(Rupees crore) |
|||||||||
|
Bank Group |
2001-02 |
2002-03 |
2003-04 |
||||||
|
CM |
RE |
Comm. |
CM |
RE |
Comm. |
CM |
RE |
Comm. |
|
|
1 |
2 |
3 |
4 |
5 |
6 |
7 |
8 |
9 |
10 |
|
Public sector banks |
1,299 |
6,044 |
6,235 |
1,032 |
7,988 |
6,111 |
1,199 |
8,558 |
6,657 |
|
(0.3) |
(1.3) |
(1.3) |
(0.2) |
(1.5) |
(1.1) |
(0.2) |
(1.4) |
(1.1) |
|
|
Old private banks |
258 |
1,122 |
1,328 |
207 |
1,067 |
1,327 |
280 |
1,231 |
1,490 |
|
(0.6) |
(2.7) |
(3.1) |
(0.4) |
(2.2) |
(2.7) |
(0.5) |
(2.2) |
(2.7) |
|
|
New private banks |
1,026 |
1,208 |
900 |
660 |
2,702 |
1,062 |
823 |
3,270 |
1,593 |
|
(1.4) |
(1.6) |
(1.2) |
(0.7) |
(3.0) |
(1.2) |
(0.7) |
(2.8) |
(1.4) |
|
|
Foreign banks |
499 |
637 |
265 |
585 |
708 |
235 |
1,032 |
1,111 |
212 |
|
(1.0) |
(1.3) |
(0.6) |
(1.1) |
(1.4) |
(0.5) |
(1.7) |
(1.8) |
(0.4) |
|
|
Scheduled commercial banks |
3,082 |
9,012 |
8,727 |
2,484 |
12,464 |
8,735 |
3,334 |
14,170 |
9,952 |
|
(0.5) |
(1.4) |
(1.4) |
(0.3) |
(1.7) |
(1.2) |
(0.4) |
(1.6) |
(1.2) |
|
|
CM : Capital market; |
|||||||||
price peaks tend to follow equity price peaks with a lag of around one year, and (b) the feedback from property prices to credit growth is strongest in countries with a greater prevalence of variable rate mortgages. This indicates a possibility of mutually reinforcing imbalances in the real estate market and the financial sector, with implications for financial stability (Tsatsaronis and Zhu, 2004; Borio and McGuire, 2004).
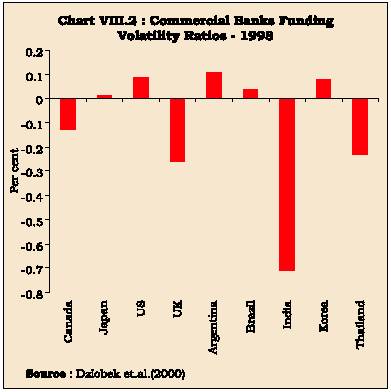
8.65 Banks have ample liquidity in view of their large holdings of Government securities - at around 41 per cent of their net demand and time liabilities at end-March 2004 - well in excess of the statutory requirement of 25 per cent - and predominance of stable deposits as a core source of funding. Among the major bank groups, foreign banks seem to rely more on borrowed funds than the other three groups. Funding volatility ratio10 suggests that the dependence of the Indian banking sector on volatile liabilities to finance their assets is relatively limited (Table 8.20 and Chart VIII.2).
Regional Rural Banks and Cooperative Banking Sector
8.66 Notwithstanding their low profitability and relatively high non-performing assets, the regional rural banks (RRBs) and cooperative banking segment appears to present minimal risk, owing to their small size (Tables 8.21). The Government had recapitalised 187 RRBs to the tune of Rs.2,188 crore to shore up their capital base. Several constraints, both at the institutional level (inappropriate implementation of policy programmes, governance structures) as well as at the field level
|
Table 8.20: Commercial Bank Funding Volatility Ratios |
||
|
Bank Group |
2002-03 |
2003-04 |
|
1 |
2 |
3 |
|
Public sector banks |
-0.13 |
-0.13 |
|
Private sector banks |
-0.16 |
-0.10 |
|
Old private banks |
-0.23 |
-0.25 |
|
New private banks |
-0.14 |
-0.08 |
|
Foreign banks |
-0.04 |
-0.02 |
|
Scheduled commercial banks |
-0.11 |
-0.09 |
|
Figures for 2002-03 and 2003-04 for India are calculated as per the following
formula: |
||
10 The funding volatility ratio (FVR) is calculated as the ratio of total borrowed funds net of liquid assets to total assets net of liquid assets. It measures the extent to which banks rely on volatile liabilities to finance their assets. A FVR<0 implies volatile liabilities are more than fully covered by liquid assets and reverse for FVR>0. A FVR=0 implies volatile liabilities are fully covered by liquid assets. The smaller the ratio, the better the liquidity profile (Dziobek et al., 2000).
|
Table 8.21: Performance Indicators of Regional |
||||
|
Rural Banks |
||||
|
(Amount in Rupees crore, ratios in per cent) |
||||
|
Year |
2000-01 |
2001-02 |
2002-03 |
2003-04 |
|
1 |
2 |
3 |
4 |
5 |
|
Profit-making RRBs |
||||
|
(No.) |
170 |
167 |
156 |
163 |
|
Net profit /total |
||||
|
asset (%) |
1.2 |
1.1 |
0.8 |
1.1 |
|
Non-performing loan/ |
||||
|
total loan (%) |
18.8 |
16.1 |
14.4 |
.. |
|
Recovery (%) |
70.6 |
71.5 |
73.5 |
.. |
|
Source: Reserve Bank of India and NABARD. |
||||
commercial banks for scheduled UCBs and nine per cent for non-scheduled UCBs, effective March 31, 2004), introducing a system of gradation of UCBs based on financial/prudential parameters for initiating prompt corrective action, 90-day norm for loan impairment (excluding gold loans and small loans) and enhanced disclosures in their balance sheets (effective March 31, 2003) for UCBs with at least Rs.100 crore of deposits. The rural cooperative banking is also plagued by low profitability and high non-performing loans (Table 8.22). As regards the long-term rural cooperative credit structure, which makes a major contribution to the capital formation in agriculture through investment credit, it lacks a sound appraisal system, effective monitoring
|
Table 8.22: Financial Position of Co-operative Banks |
||||||
|
(Amount in Rupees crore, ratios in per cent) |
||||||
|
Item |
2001-02 |
2002-03 |
2003-04 |
2001-02 |
2002-03 |
2003-04 |
|
1 |
2 |
3 |
4 |
5 |
6 |
7 |
|
Urban cooperative banks |
of which |
|||||
|
Scheduled urban cooperative banks |
||||||
|
Non-performing loans* |
13,706 (21.9) |
12,509 (19.0) |
11,922 (17.6) |
6,968 (29.9) |
6,927 (30.2) |
6,892 (28.8) |
|
Net profit/total asset (%) |
.. |
.. |
.. |
-0.9 |
-1.1 |
0.6 |
|
Rural cooperative banks (short-term structure) |
||||||
|
State cooperative banks |
District central cooperative banks |
|||||
|
2000-01 |
2001-02 |
2002-03 |
2000-01 |
2001-02 |
2002-03 |
|
|
Net profit/total asset (%) |
0.4 |
0.3 |
0.9 |
0.06 |
-0.03 |
-0.1 |
|
Non-performing loan/total loan (%) |
12.7 |
13.5 |
17.6 |
18.3 |
22.2 |
19.7 |
|
Recovery to Demand (%)** |
82 |
82 |
79 |
67 |
66 |
61 |
|
Rural cooperative banks (long-term structure) |
||||||
|
State cooperative agriculture and |
Primary cooperative agriculture and |
|||||
|
rural development banks |
rural development banks |
|||||
|
2000-01 |
2001-02 |
2002-03 |
2000-01 |
2001-02 |
2002-03 |
|
|
Net profit |
-39 |
-94 |
-102 |
-116 |
-247 |
-276 |
|
Non-performing loan/total loan (%) |
20.5 |
18.5 |
21.1 |
24.3 |
30.3 |
33.1 |
|
Recovery to Demand (%)** |
58 |
55 |
49 |
53 |
48 |
44 |
|
* Number of reporting banks varies from year to year. |
||||||
mechanism and proper loan policies and procedures (NABARD, 2004). The Union Budget 2004-05 proposed the appointment of a Task Force to examine the reforms required in the cooperative banking segment including the appropriate regulatory regime. Additionally, the Budget also provided an amount of Rs.800 crore as grants through NABARD for providing incentives to States and cooperative institutions to adopt reform measures for strengthening the cooperative credit structure (Government of India, 2004).
Development Finance Institutions
8.67 Development Finance Institutions (DFIs) were established in the 1950s with the objective of providing medium to long-term project finance to industry. The absence of a long-term debt market to provide risk capital to industry coupled with the short-term asset liability profile of banks meant that DFIs emerged as an ideal vehicle to fund long-term industrial projects. On the supply side, DFIs had recourse to cheap credit from the Reserve Bank and with limited competition from banks on project finance on the demand side, this ensured them a comfortable spread. Post-reforms, DFIs have been significantly impacted upon on both the supply and demand sides. The drying up of long-term concessional resources has meant that they had to access the market for resources at competitive rates, putting pressure on their margins. On the supply side likewise, the entry of banks into project financing has intensified the competition for DFIs. Over the past several years, DFIs have accumulated substantial NPLs. A rapid expansion of loans has been accompanied by a commensurate increase in net NPLs (Table 8.23). Additionally, since DFIs raise resources with short maturities to fund long gestation projects, their loan portfolio might also entail a term mismatch.
8.68 The concentrated portfolio of DFIs also exposes them to sector-specific vulnerabilities. In view of the slowdown in industrial performance during the last few years and the restructuring and repositioning of several industries, which weigh heavily in the portfolio of DFIs, their asset quality could come under pressure (Table 8.24).
|
Table 8.23: Loan Performance of Development Finance Institutions |
||||
|
Item |
1997-98 |
1999-2000 |
2002-03 |
2003-04 |
|
1 |
2 |
3 |
4 |
5 |
|
Net NPL |
||||
|
IDBI |
16.9 |
18.3 |
12.6 |
21.5 |
|
IFCI |
20.3 |
-3.0 |
54.5 |
-35.4 |
|
IIBI |
10.4 |
37.1 |
51.9 |
-2.3 |
|
SIDBI |
-14.1 |
2.1 |
23.8 |
-52.2 |
|
TFCI |
.. |
21.7 |
-3.2 |
-5.3 |
|
NPL/Net Loan (%) |
||||
|
IDBI |
10.9 |
13.4 |
15.8 |
21.1 |
|
IFCI |
13.9 |
20.7 |
34.8 |
32.3 |
|
IIBI |
19.3 |
16.7 |
40.3 |
38.0 |
|
EXIM Bank |
14.9 |
8.4 |
2.2 |
1.3 |
|
SIDBI |
2.5 |
1.3 |
3.8 |
2.4 |
|
TFCI |
0.9 |
3.5 |
20.5 |
21.1 |
|
Note :Figures
under net NPL are percentage growth over then previous year. |
||||
Non-banking Financial Companies
8.69 Another important segment of the financial segment is the NBFCs. After a period of rapid growth in the 1990s, the growth in this sector has slowed down, consequent upon the introduction of strict entry and prudential norms, rationalisation of interest rates offered by these entities and the process of providing a Cer tificate of Registration (CoR) to NBFCs accepting public deposits. As many as 584 NBFCs were authorised to accept/hold public deposits at end-June 2004. The number of NBFCs has stabilised since the introduction of CoR process and at end-March 2003, the total number of reporting NBFCs was 870 with total asset of Rs.37,709 crore and public deposits of Rs.5,035 crore (Table 8.25). The RNBC segment
|
Table 8.24: Sectoral Loan Performance and Exposure of DFIs |
|||||||||
|
(as per cent of capital funds) |
|||||||||
|
Exposure to |
2001-02 |
2002-03 |
2003-04 |
||||||
|
IDBI |
IFCI |
EXIM Bank |
IDBI |
IFCI |
EXIM Bank |
IDBI |
IFCI |
EXIM Bank |
|
|
1 |
2 |
3 |
4 |
5 |
6 |
7 |
8 |
9 |
10 |
|
Largest single borrower |
12.46 |
5.76 |
13.21 |
15.28 |
5.62 |
10.40 |
N.A. |
6.45 |
13.69 |
|
Largest borrower group |
19.92 |
8.00 |
13.21 |
24.30 |
9.08 |
12.04 |
N.A. |
10.60 |
25.36 |
|
Largest industrial sector |
4.14 |
24.14 |
10.87 |
18.81 |
9.08 |
10.31 |
N.A. |
10.60 |
11.57 |
|
For EXIM Bank, exposure to 'largest industrial sector' is as percent
to adjusted total credit exposure. |
|||||||||
|
IDBI has become a scheduled bank effective October 1, 2004. |
|||||||||
|
Table 8.25: Profile of NBFC/RNBC Segment |
||||||
|
(Amount in Rupees crore) |
||||||
|
Item |
NBFC |
RNBC |
||||
|
2000-01 |
2001-02 |
2002-03 |
2000-01 |
2001-02 |
2002-03 |
|
|
1 |
2 |
3 |
4 |
5 |
6 |
7 |
|
Reporting numbers |
974 |
905 |
870 |
7 |
5 |
5 |
|
Net owned funds (NOF) |
5,122 |
4,272 |
4,141 |
-179 |
111 |
809 |
|
Public deposits |
6,459 |
5,933 |
5,035 |
11,625 |
12,889 |
15,065 |
|
Public deposit/NOF |
1.3 |
1.4 |
1.2 |
Negative |
116.1 |
18.6 |
|
Total asset |
37,634 |
39,832 |
37,709 |
16,244 |
18,458 |
20,362 |
|
Source: RBI. |
||||||
accounts for a disproportionately high quantum of public deposits (over 60 per cent) with high public deposit to net owned funds (NOF) ratios. The Mid-term Review of Annual Policy 2004-05 announced several measures to focus on improvements in the functioning of RNBCs in order to ensure that the depositors are served appropriately and systemic risks are avoided. Additionally, the interest rate paid by NBFCs on their public deposits is high with a quarter of these deposits being of short (less than one year) maturity. This raises twin concerns: the risk-premium on NBFC deposits vis-à-vis banks and their long-term commercial viability (Table 8.26).
Corporate Balance Sheets and Financial Stability
8.70 The state of the balance sheet of non-financial firms is a critical factor for the stability of the financial system. If there is widespread deterioration of balance sheet among borrowers, it worsens both the adverse selection and moral hazard problems. Several possible channels can be discerned. First, if a firm has high net worth, then if it defaults on debt payments, the lender can take title of its net worth and use the proceeds to recoup some of the losses. A decline in net worth increases incentives for borrowers to engage in moral hazard, since the lenders are less protected against the consequences of adverse selection because the value of net assets is lower. This reduces lending and economic activity declines. Second, a rise in interest rates raises interest payments, decreases cash flows and engenders deterioration in their balance sheets. This exacerbates the adverse selection and moral hazard problems, resulting in a further decline in lending and economic activity. On account of all these reasons, it has, therefore, been argued that financial stability indicators need to incorporate corporate balance sheets (Davis and Stone, 2004).
8.71 In this context, it is important to make a distinction between public and private corporate firms. Using a balanced panel dataset of over 1,000 manufacturing and services firms over the period 1992-2002, Ghosh and Sensarma (2004) find that: (a) public firms are relatively more responsive to a monetary contraction vis-à-vis their private counterparts; (b) listed firms lower their long-term bank borrowings in favour of short-term borrowings, post monetary tightening, as compared with unlisted firms; and, (c) manufacturing firms are relatively more responsive to a monetary shock than services firms. The financial stability indicators in manufacturing suggest that public limited companies have considerably higher debt equity ratios than their private counterparts. Private companies have improved their profitability levels in 2003. On the other hand, current ratio (current assets/current liabilities) declined for public firms, while it remained same for private limited companies (Table 8.27). To sum up, this suggests that the risk to financial stability arising from non-financial corporations may have moderated.
|
Table 8.26: Public Deposits of NBFCs according to Interest Rate and Maturity |
|||||||
|
(Per cent) |
|||||||
|
Year |
Interest rate (per cent) |
Maturity period (years) |
Memo |
||||
|
Total deposit |
|||||||
|
Up to 10 |
10-12 |
Above 12 |
Less than 1 |
1-2 |
Exceeding 2 |
||
|
(Rs. crore) |
|||||||
|
2000-01 |
1.8 |
21.8 |
76.4 |
26.7 |
27.0 |
46.3 |
6459 |
|
2001-02 |
6.0 |
34.6 |
59.4 |
25.0 |
23.9 |
51.1 |
5933 |
|
2002-03 |
23.3 |
41.7 |
35.0 |
23.9 |
24.6 |
51.5 |
5035 |
|
Source: RBI. |
|||||||
|
Table 8.27: Indicators of Financial Stability in Manufacturing |
||||||
|
(Per cent) |
||||||
|
Year |
2000-01 |
2001-02 |
2002-03 |
|||
|
Public |
Private |
Public |
Private |
Public |
Private |
|
|
1 |
2 |
3 |
4 |
5 |
6 |
7 |
|
Debt-Equity Ratio |
68.3 |
32.5 |
70.5 |
28.6 |
64.7 |
N.A. |
|
Net worth /Total asset |
37.6 |
40.2 |
36.4 |
41.6 |
36.0 |
N.A. |
|
Total outside liabilities/net worth |
166.1 |
148.6 |
174.6 |
140.6 |
177.7 |
N.A. |
|
Memo: |
||||||
|
Gross profit/Sales |
9.8 |
6.5 |
10.2 |
6.2 |
10.3 |
11.3 |
|
Sales / Gross fixed asset |
110.7 |
192.1 |
100.6 |
189.7 |
103.3 |
N.A. |
|
Current asset/Current liabilities |
1.2 |
1.3 |
1.2 |
1.3 |
1.1 |
N.A. |
|
N.A. : Not available; Public : Public limited companies; Private : Private
limited companies |
||||||
8.72 Another important channel through which non-financial firms can be a source of possible financial instability is unanticipated exchange rate depreciation or devaluation. With debt contracts denominated in foreign currency, unanticipated exchange rate changes increase the debt burden of firms. Since assets are typically denominated in domestic currency, the resulting decline in net worth once again propagates instability and contraction in lending and output. In recognition of these concerns, the Reserve Bank has stressed upon the banks to monitor large unhedged foreign currency exposures of their corporate borrowers. Banks were advised to extend foreign currency loans above US $ 10 million (or such lower limits as may be deemed appropriate vis-a-vis the banks’ portfolios of such exposures), only on the basis of a well laid out policy with regard to hedging of such foreign currency loans.
Capital Market
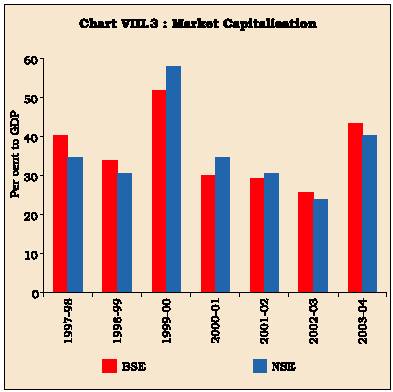
8.73 The growth and development of capital markets has strengthened the resilience of the financial system. Since the liberalisation of both domestic capital markets and portfolio flows from abroad, and the development of modern capital market infrastructure led by efforts to establish a national stock exchange system, the growth of capital market has been impressive (Table 8.28 and Chart VIII.3). While the infrastructure and operations of stock markets have improved substantially, liquidity is not evenly spread, with a large proportion of infrequently traded stocks.
8.74 There are signs of increased integration of the Indian capital markets with global markets. Using daily data for the years 1999-2000 and 2000-01, Hansda and
|
Table 8.28: Equity Market Growth 1991-2004 |
||||
|
(Amount in Rupees crore) |
||||
|
Year |
1990-91 |
1999-2000 |
2002-03 |
2003-04 |
|
1 |
2 |
3 |
4 |
5 |
|
No of stock exchanges |
22 |
23 |
23 |
23 |
|
No. of listed companies |
6,229 |
9,871 |
9,413 |
5,528* |
|
Market capitalisation |
1,102,790 |
11,926,300 |
6,319,212 |
1,201,207* |
|
Turnover |
36011** |
20,670,310 |
9,689,098 |
16,039,340 |
|
* BSE only. |
||||
|
Source: SEBI and NSE. |
||||
Ray (2002) find evidence that domestic IT indices have generally been a follower vis-à-vis the general or IT-related indices of the foreign bourses. Notwithstanding the turbulence in stock markets in several instances, no major disruption or failures of intermediaries has occurred. This suggests that Indian capital markets and their intermediaries are reasonably resilient to equity price shocks.
8.75 An impor tant facet of financial sector vulnerability, viz., pertaining to Unit Trust of India (UTI) has been addressed. The Unit Trust of India Act, 1963 was repealed through an Ordinance in October 2002 by splitting UTI into two parts: UTI-I (comprising US-64 and assured return schemes placed under a Government-appointed administrator) and UTI-II11 (consisting of NAV-based schemes, professionally managed and brought under the regulatory purview of SEBI). The Government has committed to small investors that it would meet all obligations for US-64 (estimated at Rs.6,000 crore) and other assured income schemes (estimated at Rs.8,561 crore). The Union Budget 2004-05 has made a provision of Rs.1,200 crore to meet the shortfall in assured returns schemes maturing in 2004-05 and related obligations (Government of India, 2004). This is in addition to Rs.6,500 crore provided in Union Budget 2003-04 to enable UTI to meet the shortfall between assured repurchase prices and NAV and to provide smooth transition to the NAV-based scheme12.
8.76 The growth in private placements raises some important informational and regulatory issues. According to available information, total private placements over the period 1999-2000 to 2002-03 accounted for, on average, around 90 per cent of total debt issues and over 85 per cent of the total resource mobilised (NSE, 2003). This raises the concern of the quality of such issues and the extent of transparency in such deals. Additionally, the lack of 'market discipline' inherent in such issues enhances risks and distorts the 'level playing field' vis-à-vis public issues, which might engender regulatory arbitrage.
Payment and Settlement Systems
8.77 A wide range of improvements in the payment and settlement systems has been undertaken over the past several years. Salient among these include Electronic Clearing Service (ECS - Debit and Credit), Electronic Funds Transfer (EFT), the Special EFT and card-based systems (credit, debit, ATM and smart cards). An impor tant feature of technological development in recent years has been the growth of large value payment systems (LVPS) (comprising inter-bank clearing, high-value clearing, negotiated dealing system and forex clearing). More recently, the Real Time Gross Settlement (RTGS) settlement has been operationalised since March 2004. The RTGS provides for an electronic based settlement of inter-bank and customer-based transactions with intra-day collateralised liquidity support from the Reserve Bank to the participants in the system. More than 75 per cent of the value of inter-bank transactions, which were earlier settled through the Deferred Net Settlement (DNS) system based inter-bank clearing, is since being settled under the RTGS. The status of conformity with the Core Principles for Systemically Important Payment Systems (CPSS) reveal a high degree of compliance (RBI, 2003). The ongoing initiatives of the Reserve Bank are intended to provide a safe, secure, efficient and integrated payment and settlement system in the country and thereby contribute to financial stability.
Electronic Money
8.78 In India, where cash transactions are high in number, the use of e-money can be beneficial in terms of reduced miscellaneous costs, viz., cost of printing and minting of smaller denomination notes and coins and transportation and storage costs. However, certain additional costs for setting up of network infrastructure to operate nationwide are also associated with it. The Reserve Bank has been partnering a multi-application smart card project -under the aegis of the Ministry of Communications and Information Technology, Government of India to run a pilot project on the use of multi-application smart cards in the country. Various issues relating to technology, security, regulatory and supervisory concerns and legal implications have been examined to make the use of smart cards a viable proposition after the conclusion of the pilot project. The project is aimed at combining applications relating to banking, insurance, postal services, identification, etc in a single card.
11 Renamed as UTI Mutual Fund.
12 Unit Scheme-64 (US-64) was converted to NAV basis as on January 1, 2002.
8.79 To examine the likely challenges that may emanate from the use of e-money, the Reserve Bank set up a Working Group on Electronic Money in 2002 (RBI, 2002). The Group examined various dimensions and implications of e-money for payments system, its potential use and suggested appropriate policies from a central bank's point of view. The Working Group recommended the introduction of a multi-purpose e-money by banks only against payment of full value of central bank money or against credit only by the banks. In order to preserve unit of account function of money and control money supply, the issuing authority of e-money must ensure its obligation to offer redemption of E-money liabilities net of service charges, if so required. Non-banks should not be permitted to issue multi-purpose money. Since there is scope for issuers of e-money (on credit) to assume a leveraged position, there is a need for continuous monitoring of the behaviour of issuing authorities for balanced growth of their assets and liabilities arising out of issuance of e-money.
8.80 Three banks have been given permission by the Reserve Bank to issue prepaid multi-purpose cards. A few banks allow withdrawal of cash from ATMs using the prepaid card. The fee structure has been left to the participants. In order to facilitate faster and more efficient service to customers, some banks in India have started providing services via the internet banks and are integrating the internet banking services being offered into the RBI Electronic Funds Transfer (RBI-EFT) system, facilitating transfers of funds across accounts with other banks (BIS, 2004a).
8.81 To conclude, the regulatory and supervisory setup in India has moved from micro management to prudential regulation. The Reserve Bank's approach to the institution of prudential norms has been one of gradual convergence with international standards and best practices with suitable country specific adaptations. One of the successes of the Indian financial sector reforms has been the maintenance of financial stability and no reversal of direction in the financial sector reform process over the last 15 years, in addition to the avoidance of any major financial crisis during the reform period (Mohan, 2004c). In recent years, emphasis has been laid on issues relating to governance and transparency. Notwithstanding a few areas of concern, the gamut of policies has been successful in imparting stability to the Indian financial sector, especially the systemically important banking sector. The Indian financial system on the whole is in sound health (Jadhav, 2003).
III. CONCLUDING OBSERVATIONS
8.82 This Chapter has discussed issues related to financial stability, with a focus on the role of central banks in maintaining financial stability. The conventional view is that price stability is a sufficient condition for financial stability. Developments during the 1990s suggest that this may not be the case, at least in the short-run. Ironically, price stability itself may lead to 'irrational exuberance' which could over time be reflected in financial imbalances. Thus, although central banks have always been concerned with maintenance of financial stability, recent developments have placed renewed emphasis on financial stability as a key consideration in the conduct of monetary policy. Apart from lengthening their monetary policy horizons beyond the usual two-year framework, central banks can contribute to financial stability through regulation and supervision ensuring that banks are well-capitalised and well-diversified. Encouraging greater transparency in accounting and disclosure practices can also contribute to financial stability.
8.83 In India, prudential norms have been gradually brought on par with international standards and best practices, with suitable country specific adaptations. More recently, the Reserve Bank has undertaken significant initiatives on graduating towards Basel II, keeping in view the country-specific requirements. These include, inter alia, ensuring the institution of suitable risk management framework by banks, introduction of risk-based supervision, encouraging banks to formalise their Capital Adequacy Assessment Programme (CAAP) in alignment with business plan and performance budgeting system and enhancing the area of disclosures. At the same time, several challenges such as encouraging ratings of issuers, assessing the level of additional capital requirement by banks, capital requirement for operational risk and addressing the systemic risk posed by large conglomerates would all need to be satisfactorily addressed before the transition to Basel II can occur (Udeshi, 2004).
8.84 The survey of the Indian financial sector undertaken in this Chapter suggests that India's approach to financial sector reforms has served the country well, in terms of aiding growth, avoiding crises, enhancing efficiency and imparting resilience to the system. The development of financial markets has been, by and large, healthy. The basic features of the Indian approach are gradualism; co-ordination with other economic policies; pragmatism rather than ideology; relevance to the context; consultative processes; dynamism and good sequencing so as to be able to meet the emerging domestic and international trends. In the banking system, diversified ownership of public sector banks has been promoted over the years and the performance of their listed stocks in the face of intense competition indicates improvements in the system. Since the initiation of reforms, financial health as well as efficiency of the banking sector has improved (Reddy, 2004e). From the vantage point of 2004, one of the successes of the Indian financial sector reform has been the maintenance of financial stability and avoidance of any major financial crisis during the reform period - a period that has been turbulent for the financial sector in most emerging market countries.
8.85 At the same time, there remains scope for improvements in the operational efficiency of the banking sector. Moreover, despite the decline in the stock of NPLs in the banking system, these figures remain high compared to international standards. The improved institutional and legal arrangements accompanied by concomitant strengthening of risk management practices by banks are likely to keep incremental NPLs low. Initiatives such as setting up of Asset Reconstruction Companies and greater emphasis on compromise settlements are likely to deal with the stock problem for NPLs. Banks may need to adopt a more pro-active approach in dealing with these issues. Enforcement of creditors rights will need continuous strengthening. The legal provisions and practice in bankruptcy of the real sector are still inadequate and need further reform (Mohan, 2004c).
8.86 To conclude, ensuring an acceptable degree of financial stability is a never-ending process. In an ideal world, there is often a smattering of small disturbances. The real world, however, is often far divorced from idealism: there are long periods of quiescence when virtually no financial disturbance takes place, creating a false sense of security which eventually leads to periods that contain several failures and the threat of many more. The task for all involved in ensuring financial stability is to remain alert and proactive during such tranquil periods, to identify and monitor newer risks, eschew harmful incentives and adjust the regulatory environment to keep abreast with fast-paced changes in the economic environment.

ଏହି ପେଜ୍ ଶେୟାର୍ କରନ୍ତୁ:


ରିଜର୍ଭ ବ୍ୟାଙ୍କ ଅଫ୍ ଇଣ୍ଡିଆ ମୋବାଇଲ୍ ଆପ୍ଲିକେସନ୍ ଇନଷ୍ଟଲ୍ କରନ୍ତୁ ଏବଂ ଲାଟେଷ୍ଟ ନିଉଜ୍ କୁ ଶୀଘ୍ର ଆକ୍ସେସ୍ ପାଆନ୍ତୁ!
ଆମର ଆପ୍ ଇନଷ୍ଟଲ୍ କରିବାକୁ QR କୋଡ୍ ସ୍କାନ୍ କରନ୍ତୁ


ପେଜ୍ ଅନ୍ତିମ ଅପଡେଟ୍ ହୋଇଛି:


