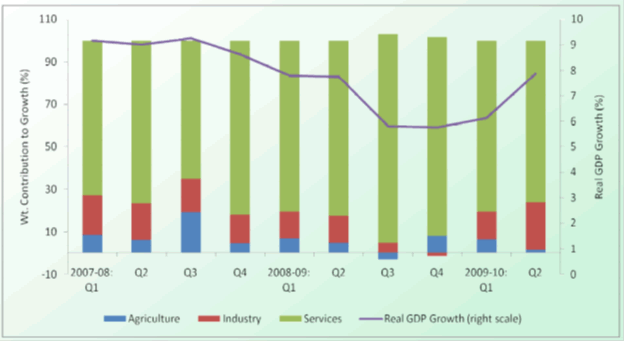
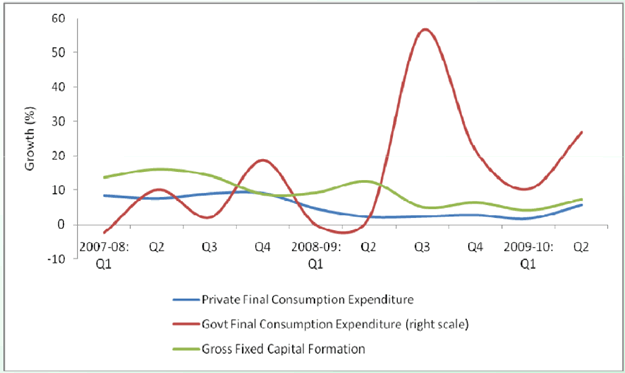
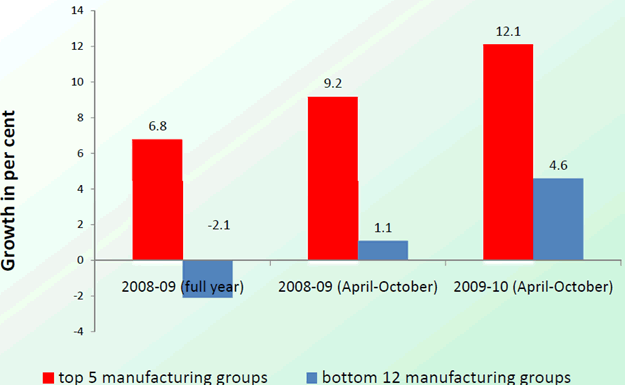
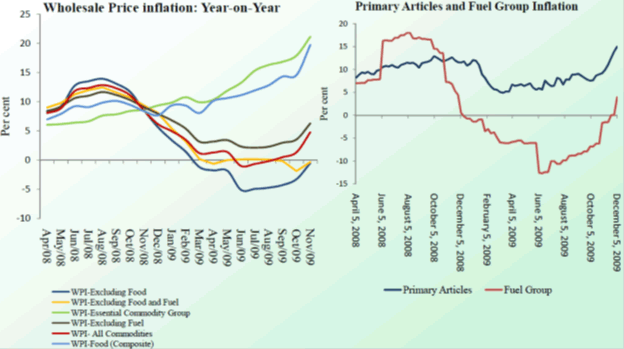
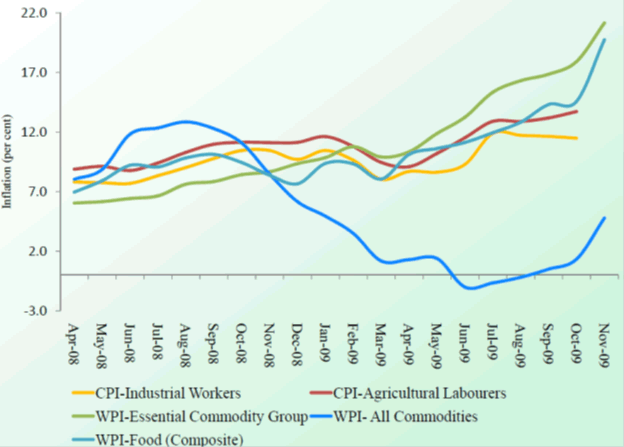
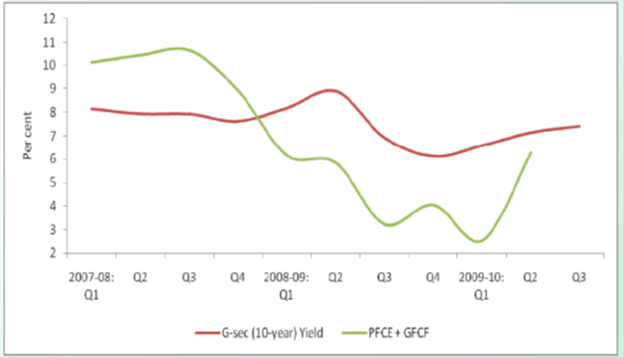
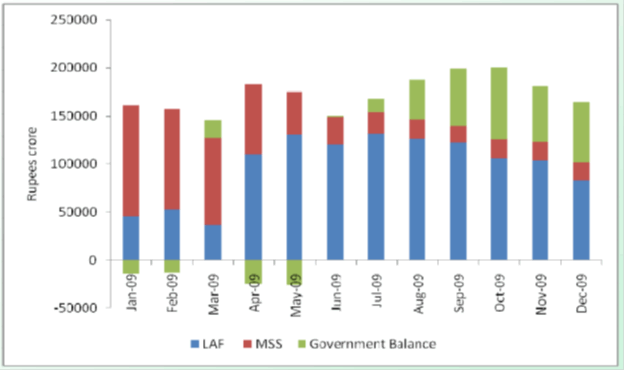
THE GLOBAL SCENARIO Global Growth: Modest signs of recovery (Growth in per cent) | | Jan-09 | Apr-09 | July-09 | Aug-09 | Oct-09 | Global | 2009 | 0.5 | -1.3 | -1.4 | -1.3 | -1.1 | 2010 | 3.0 | 1.9 | 2.5 | 2.9 | 3.1 | Advanced Economies | 2009 | -2.0 | -3.8 | -3.8 | -3.7 | -3.4 | 2010 | 1.1 | 0.0 | 0.6 | 1.0 | 1.3 | Emerging and Developing Economies | 2009 | 3.3 | 1.6 | 1.5 | 1.5 | 1.7 | 2010 | 5.0 | 4.0 | 4.7 | 5.0 | 5.1 | India | 2009 | 5.1 | 4.5 | 5.4 | 5.3 | 5.4 | 2010 | 6.5 | 5.6 | 6.5 | 6.5 | 6.4 | | Source: International Monetary Fund. | Global Inflation: Asymmetric patterns Y-o-Y Per cent | | Nov-08 | Mar-09 | Nov-09 | Developed Economies | US | 1.1 | -0.4 | 1.8 | UK | 4.1 | 2.9 | 1.9 | Euro Area | 2.1 | 0.6 | 0.5 | Japan^ | 1.7 | -0.3 | -2.5 | Canada^ | 2.6 | 1.2 | 0.1 | Australia | 5.0* | 2.5 | 1.3* | Developing Economies | China^ | 4.0 | -1.2 | -0.5 | Korea | 4.5 | 3.9 | 2.4 | Thailand | 2.2 | -0.2 | 1.9 | Malaysia^ | 7.6 | 3.5 | -1.6 | India (Industrial Workers)^ | 10.4 | 8.0 | 11.5 | India (Agricultural Labourers) | 11.1 | 9.5 | 15.7 | Indonesia | 11.7 | 7.9 | 2.4 | Philippines | 9.9 | 6.4 | 2.8 | Brazil | 6.4 | 5.6 | 4.2 | Israel^ | 5.5 | 3.6 | 2.9 | Russia | 12.2 | 14.0 | 9.1 | South Africa^ | 12.1 | 8.5 | 5.9 | ^: October* : Quarterly figures for Q3. | THE DOMESTIC SCENARIO Growth: Sectoral Contributions Reverting to “Normal” Growth: Govt. Expenditure dominates, but slight pick-up in private spending Industrial Production: Driven by Durables (Growth rate in per cent) | Sector | Weight in IIP | 2007-08 | 2008-09 | April-October | 2008-09 | 2009-10 | IIP | 100 | 8.5 | 2.7 | 4.3 | 7.1 | Basic Goods | 35.6 | 7.0 | 2.6 | 3.8 | 6.4 | Capital Goods | 9.3 | 18.0 | 7.3 | 9.7 | 6.3 | Intermediate Goods | 26.5 | 8.9 | -1.9 | -0.3 | 10.2 | Consumer Goods | 28.7 | 6.1 | 4.7 | 6.4 | 5.5 | i) Consumer Durables | 5.4 | -1.0 | 4.5 | 5.8 | 19.4 | ii) Consumer Non- | 23.3 | 8.5 | 4.8 | 6.6 | 0.8 | Industrial Production: Asymmetric recovery Inflation: Food-driven but signs of spread Inflation: Asymmetric impact on consumers Credit Growth: Recovering, but slowly | Sector/Industry | Outstanding October 2009 | Year-on-Year Variation | | (%) Oct-08 | Oct-09 | | (Rs. crore) | Per cent | Per cent | 1 | 2 | 4 | 6 | Non-Food Bank Credit (1 to 4) | 26,87,002 | 29.4 | 9.9 | 1.Agri. & Allied Activities | 3,37,416 | 23.4 | 19.9 | 2.Industry | 11,45,142 | 37.4 | 14.8 | 3.Personal Loans | 5,62,754 | 15.0 | -0.1 | of which: Housing | 2,88,770 | 11.0 | 6.2 | 4. Services | 6,41,690 | 35.5 | 6.3 | of which: Trade | 1,53,463 | 20.7 | 14.4 | Real Estate | 88,288 | 44.2 | 21.2 | NBFC | 1,04,658 | 60.5 | 20.8 | Interest Rates: Sticky despite sluggish pvt. spending Liquidity: Comfortable, at an aggregate level Drivers of Recovery: Monetary Policy Policy Measure | Change | Reverse repo rate | -275 bps | Repo rate | -425 bps | CRR | -400 bps | SLR SLR | 100 b -100 bps | | Actual/potential liquidity – CRR, MSS, special facilities | Rs.5617 billion (9% of GDP)(9% of GDP) | Other measures: | Relaxation in prudential norms, Restructuring,
Relaxation in ECB norms,
Higher ceilings for NRI deposits | Drivers of Recovery: Fiscal Policy | | % to GDP | Item | 2008-09 | 2009-10 | Tax reductions | 0.2 | 0.4 | Investment | 0.8 | 0.1 | Pay Commission Impact | 0.5 | 0.3 | Other Expenditure | 0.9 | 1.0 | Total | 2.4 | 1.8 | | Debt waiver | 0.3 | - | BoP: In Balance | | 2007-08 | 2008-09 | 2008-09 | 2009-10 | Item | US$ billion | (% to GDP) | US$ billion | (% to GDP) | April-June
(US$ billion) | Exports | 166 | 14.2 | 175 | 15.1 | 49 | 39 | Imports | 258 | 22.0 | 295 | 25.5 | 81 | 65 | Trade Balance | -92 | -7.8 | -119 | -10.3 | -31 | -26 | Invisibles | 75 | 6.4 | 90 | 7.7 | 22 | 20 | Current A/c | -17 | -1.5 | -30 | -2.6 | -9 | -6 | Capital A/c | 108 | 9.2 | 9 | 0.8 | 11 | 7 | Overall Balance * | 92 | 7.9 | -20 | -1.7 | 2 | 0 | *: Including errors and omissions. | Drivers, Risks and Policy Considerations Drivers Risks Growth pattern is skewed Food inflation racing ahead - As capacity constraints emerge, dangers of an expectations-induced spiral
High interest rates – restraining credit flows? Potential surge in capital inflows - Global liquidity and domestic recovery
Policy Considerations From “Managing Crisis” to “Managing Recovery” - Shift from predominant growth focus to balance between growth and inflation in Oct 2009 announcement
Inflation Risks - As growth accelerates, supply-side drivers could translate into wider pressures
Maintenance of Adequate Liquidity - Supporting the recovery by ensuring that liquidity does not become a constraint
Thank You |
 IST,
IST,


