The international investment position (IIP) is a statistical statement that shows at a point in time the value and composition of (a) financial assets of residents of an economy that are claims on non-residents and gold bullion held as reserve assets; and (b) liabilities of residents of an economy to non-residents. The difference between an economy's external financial assets and liabilities is the economy's net IIP, which may be positive or negative.
As per the Special Data Dissemination Standard (SDDS) of the International Monetary Fund (IMF), data on IIP are to be disseminated on annual basis (quarterly encouraged) with a time lag of two quarters. In India, since the quarter end-June 2006 onwards, the IIP was being disseminated on quarterly basis with a lag of less than two quarters. Further, successful efforts have been made to release the quarterly IIP data as at quarter end-June 2009 with a lag of one quarter, as per SDDS of IMF. The quarterly IIP as at end-June 2009 was released on the RBI website on September 30, 2009.
The IIP as at the quarter ended September 2009 has been compiled now and the major highlights are summarized below:
I. Overall International Investment Position
- Net claim of non-residents on India as reflected by the net IIP (International Assets – International Liabilities) as at end-September 2009, increased by US$ 11.7 billion to US$ 97.8 billion from US$ 86.1 billion as at end-June 2009 (Table I).
 |
-
The total external financial assets increased by US$ 21.0 billion to US$ 378.6 billion as at end-September 2009 over the previous quarter.
-
Among the components of external financial assets, Reserve Assets i.e. official reserves (foreign currency assets, IMF reserve position, SDRs, Gold) improved by US$ 16.1 billion over end-June 2009 and stood at US$ 281.3 billion at end-September 2009. The increase in Reserve Assets is also due to increase in SDRs holdings of US$ 5.2 billion over the previous quarter, which includes the SDRs allocation of US$ 4.8 billion under general allocation and US$ 0.3 billion under special allocation by IMF done on August 28, 2009 and September 9, 2009 respectively.
-
Direct Investment abroad moved up by US$ 4.2 billion over the previous quarter to US$ 74.1 billion as at end-September 2009.
-
Reserve Assets exceeded the total external debt (US$ 242.8 billion*) by US$ 38.5 billion as at end-September 2009.
Table I . Overall International Investment Position |
(US $ billion) |
Period |
Mar07 (R) |
Jun.07 (R) |
Sep.07
(R) |
Dec.07 (PR) |
Mar.08 (PR) |
Jun. 08 (PR) |
Sep.08 (PR) |
Dec.08 (PR) |
Mar.09 (PR) |
Jun.09 (PR) |
Sep.09 (P) |
Net IIP |
-62.5 |
-84.7 |
-79.5 |
-75.1 |
-49.6 |
-57.1 |
-77.7 |
-84.1 |
-62.9 |
-86.1 |
-97.8 |
A. Assets |
247.3 |
260.7 |
299.7 |
335.4 |
386.9 |
373.1 |
344.0 |
333.9 |
345.9 |
357.6 |
378.6 |
1. Direct Investment |
31.0 |
35.7 |
38.3 |
44.1 |
49.8 |
52.7 |
56.6 |
62.5 |
67.3 |
69.9 |
74.1 |
2. Portfolio Investment |
0.9 |
0.9 |
0.7 |
0.7 |
1.5 |
1.5 |
1.5 |
1.4 |
0.8 |
0.8 |
0.8 |
2.1 Equity Securities |
0.5 |
0.6 |
0.6 |
0.6 |
1.4 |
1.4 |
1.4 |
1.4 |
0.8 |
0.8 |
0.8 |
2.2 Debt Securities |
0.4 |
0.4 |
0.2 |
0.2 |
0.1 |
0.1 |
0.0 |
0.0 |
0.0 |
0.0 |
0.0 |
3. Other Investment |
16.2 |
10.8 |
12.9 |
15.3 |
25.9 |
6.9 |
-0.4 |
14.1 |
25.8 |
21.7 |
22.4 |
3.1 Trade Credits |
0.7 |
-3.8 |
-2.1 |
0.5 |
1.2 |
-8.5 |
-14.6 |
-5.0 |
2.7 |
2.7 |
3.0 |
3.2 Loans |
3.5 |
2.5 |
4.3 |
3.6 |
11.6 |
3.2 |
2.8 |
5.6 |
6.2 |
5.4 |
4.3 |
3.3 Currency & Deposits |
7.8 |
7.9 |
6.3 |
6.7 |
7.8 |
5.9 |
5.0 |
6.7 |
10.3 |
7.0 |
8.2 |
3.4 Other Assets |
4.2 |
4.2 |
4.4 |
4.6 |
5.3 |
6.2 |
6.4 |
6.8 |
6.6 |
6.7 |
7.0 |
4. Reserve Assets |
199.2 |
213.4 |
247.8 |
275.3 |
309.7 |
312.1 |
286.3 |
256.0 |
252.0 |
265.1 |
281.3 |
B. Liabilities |
309.7 |
345.4 |
379.1 |
410.6 |
436.5 |
430.2 |
421.6 |
418.0 |
408.8 |
443.7 |
476.4 |
1. Direct Investment |
77.0 |
89.8 |
97.0 |
105.8 |
118.8 |
122.3 |
121.8 |
123.3 |
125.2 |
142.8 |
153.8 |
2. Portfolio Investment |
79.4 |
93.9 |
108.6 |
122.6 |
117.9 |
106.1 |
100.1 |
91.5 |
83.1 |
95.8 |
106.0 |
2.1 Equity Securities |
63.3 |
75.3 |
88.3 |
101.7 |
96.5 |
85.8 |
78.2 |
69.0 |
63.1 |
75.6 |
85.1 |
2.2 Debt securities |
16.2 |
18.6 |
20.3 |
20.9 |
21.4 |
20.3 |
21.9 |
22.5 |
20.0 |
20.2 |
20.8 |
3. Other Investment |
153.3 |
161.7 |
173.5 |
182.2 |
199.8 |
201.8 |
199.8 |
203.2 |
200.5 |
205.1 |
216.6 |
3.1 Trade Credits |
27.7 |
29.7 |
34.6 |
37.9 |
44.0 |
48.4 |
48.7 |
44.7 |
42.0 |
40.5 |
41.4 |
3.2 Loans |
80.8 |
85.6 |
90.9 |
97.3 |
106.9 |
106.4 |
106.4 |
114.9 |
113.9 |
116.8 |
120.8 |
3.3 Currency & Deposits |
41.7 |
43.7 |
44.8 |
44.1 |
44.8 |
43.6 |
41.5 |
41.1 |
42.3 |
45.4 |
46.7 |
3.4 Other Liabilities |
3.0 |
2.7 |
3.2 |
2.8 |
4.2 |
3.5 |
3.2 |
2.6 |
2.3 |
2.5 |
7.7 |
Note- R: Revised; PR: Partially revised; P: Provisional; [figures in the Table have been compiled based on IIP estimates in terms of US $ Million] |
-
Total external financial liabilities increased significantly by US$ 32.7 billion over the previous quarter and stood at US$ 476.4 billion as at end-September 2009. Direct investment and Portfolio investment in India increased by US$ 11.0 billion and US$ 10.2 billion respectively over the previous quarter.
-
Among the Other Investment items, other liabilities, loan, and currency & deposits increased by US$ 5.2 billion, US$ 4.0 billion and US$ 1.3 billion respectively over the previous quarter. The increase in other liabilities is due to the inclusion of SDRs allocation of US$ 4.8 billion under general allocation and US$ 0.3 billion under special allocation by IMF done on August 28, 2009 and September 9, 2009 respectively.
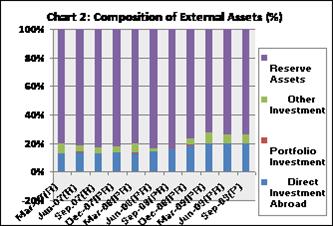
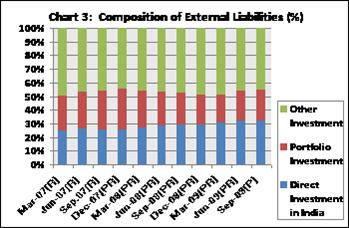
II. Composition of External Financial Assets and Liabilities
- The share of Reserve Assets in the total external financial assets was 74.3 per cent as at end-September 2009, whereas, Direct Investment and Other Investment accounted for 19.6 per cent and 5.9 per cent respectively (Table II).
- On the liability side, other investment in India, i.e. trade credits, loans, currency & deposits and other liabilities, accounted for 45.5 per cent of country’s external financial liabilities as at end-September 2009, of which loans component accounted for 25.4 per cent share in the total external financial liabilities. Direct Investment and Portfolio Investment contributed 32.3 per cent and 22.2 per cent share respectively in country’s external financial liabilities as at end-September 2009.
 |
|
Table II . Composition of External Financial Assets and Liabilities |
(per cent) |
Period |
Mar.07 (R) |
Jun.07 (R) |
Sep.07
(R) |
Dec. 07 (PR) |
Mar.08 (PR) |
Jun. 08 (PR) |
Sep. 08 (PR) |
Dec.08 (PR) |
Mar. 09 (PR) |
Jun. 09 (PR) |
Sep. 09 (P) |
A. Assets |
|
|
|
|
|
|
|
|
|
|
|
1. Direct Investment |
12.5 |
13.7 |
12.8 |
13.1 |
12.9 |
14.1 |
16.5 |
18.7 |
19.5 |
19.6 |
19.6 |
2.Portfolio Investment |
0.4 |
0.4 |
0.2 |
0.2 |
0.4 |
0.4 |
0.4 |
0.4 |
0.2 |
0.2 |
0.2 |
3. Other Investment |
6.6 |
4.1 |
4.3 |
4.6 |
6.7 |
1.8 |
-0.1 |
4.2 |
7.5 |
6.1 |
5.9 |
4. Reserve Assets |
80.6 |
81.8 |
82.7 |
82.1 |
80.1 |
83.6 |
83.2 |
76.7 |
72.9 |
74.1 |
74.3 |
Total |
100.0 |
100.0 |
100.0 |
100.0 |
100.0 |
100.0 |
100.0 |
100.0 |
100.0 |
100.0 |
100.0 |
B. Liabilities |
|
|
|
|
|
|
|
|
|
|
|
1. Direct Investment |
24.9 |
26.0 |
25.6 |
25.8 |
27.2 |
28.4 |
28.9 |
29.5 |
30.6 |
32.2 |
32.3 |
2. Portfolio Investment |
25.7 |
27.2 |
28.7 |
29.9 |
27.0 |
24.7 |
23.7 |
21.9 |
20.3 |
21.6 |
22.2 |
3. Other Investment |
49.5 |
46.8 |
45.8 |
44.4 |
45.8 |
46.9 |
47.4 |
48.6 |
49.1 |
46.2 |
45.5 |
Total |
100.0 |
100.0 |
100.0 |
100.0 |
100.0 |
100.0 |
100.0 |
100.0 |
100.0 |
100.0 |
100.0 |
Note- R: Revised; PR: Partially revised; P: Provisional; [figures in the Table have been compiled based on IIP estimates in terms of US$ Million] |
III. External Debt Liabilities vis-à-vis External Non-Debt Liabilities
- The share of non-debt liabilities to total external financial liabilities marginally increased by 0.8 per cent to 48.8 per cent at end-September 2009 over the previous quarter, due to increase in inflow of direct investment and Portfolio equity investment in India (Table III).
Table III . Share of External Debt and Non-Debt Liabilities |
(per cent) |
Period |
Mar.07 (R) |
Jun.07 (R) |
Sep.07
(R) |
Dec. 07 (PR) |
Mar.08 (PR) |
Jun. 08 (PR) |
Sep. 08 (PR) |
Dec.08 (PR) |
Mar. 09 (PR) |
Jun. 09 (PR) |
Sep. 09 (P) |
Non-Debt Liabilities |
44.1 |
46.7 |
47.8 |
49.5 |
48.3 |
47.3 |
46.4 |
44.8 |
44.9 |
48.0 |
48.8 |
Debt Liabilities |
55.9 |
53.4 |
52.2 |
50.5 |
51.7 |
52.7 |
53.6 |
55.2 |
55.2 |
52.0 |
51.2 |
Total |
100.0 |
100.0 |
100.0 |
100.0 |
100.0 |
100.0 |
100.0 |
100.0 |
100.0 |
100.0 |
100.0 |
Note- R: Revised; PR: Partially revised; P: Provisional; [figures in the Table have been compiled based on IIP estimates in terms of US$ Million] |
Ajit Prasad
Manager
Press Release : 2009-2010/917
* As published in External Debt Statistics of India, September 2009, MOF, GOI.
|
 IST,
IST,


