|
Today, the Reserve Bank released data on the performance of the private corporate sector during 2024-25 drawn from abridged financial results of 3,902 listed non-government non-financial (NGNF) companies. Corresponding data pertaining to 2023-24 are also presented in the tables to enable comparison. The data can be accessed at the web-link https://data.rbi.org.in/DBIE/#/dbie/reports/Statistics/Corporate%20Sector/Listed%20Non-Government%20Non-Financial%20Companies.
Highlights
Sales
- During 2024-25, sales growth of listed private non-financial companies improved to 7.2 per cent from a low of 4.7 per cent during the previous year (Tables 1A).
- Sales of manufacturing sector companies rose by 6.0 per cent during 2024-25 as compared to 3.5 per cent growth in the previous year, mainly led by automobiles, electrical machinery, food & beverages and pharmaceuticals industries. On the other hand, among the major industries, petroleum and iron & steel industries recorded contraction in their sales during 2024-25 (Tables 2A and 5A, Chart 1).
- Despite global headwinds, sales growth of IT companies improved to 7.1 per cent during 2024-25 from 5.5 per cent in the previous year. Non-IT services companies recorded double digit sales growth during 2024-25, led by healthy performance of telecommunication, transport & storage services and wholesale & retail trade industries.
Expenditure
- In line with acceleration in sales, manufacturing companies’ expenses on raw material rose by 6.6 per cent during 2024-25; raw material to sales ratio increased to 55.7 per cent in 2024-25 from 54.2 per cent a year ago, pointing to input cost pressure (Table 2A and 2B).
- Staff cost rose by 10.0 per cent, 4.4 per cent and 12.0 per cent during 2024-25 for manufacturing, IT and non-IT services companies, respectively; staff cost to sales ratio broadly remained stable for manufacturing companies while it moderated for services companies.
Pricing power
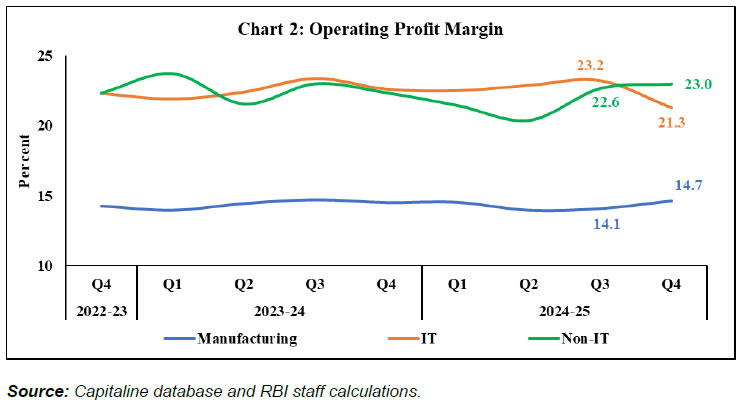
- With increase in the input costs, operating profit growth of manufacturing companies moderated to 6.0 per cent during 2024-25 from 12.4 per cent in the previous year; within services sector, profit growth moderated to 15.9 per cent in 2024-25 for the non-IT services companies, while it inched up to 6.1 per cent for IT companies (Table 2A).
- During 2024-25, operating profit margin moderated by 20 basis points (bps), 80 bps and 30 bps to 14.2 per cent, 21.9 per cent and 22.1 per cent, respectively, for manufacturing, IT and non-IT services companies (Table 2B, Chart 2).
Interest expenses
- The interest coverage ratio (ICR)1 improved across major sectors during 2024-25 from a year ago; ICR remained above the unity for the major industries during 2024-25 (Table 2B and 5B).
| List of Tables |
| Table No. |
Title |
| 1 |
A |
Performance of Listed Non – Government Non-Financial Companies |
Growth Rates |
| B |
Select Ratios |
| 2 |
A |
Performance of Listed Non-Government Non-Financial Companies - Sector – wise |
Growth Rates |
| B |
Select Ratios |
| 3 |
A |
Performance of Listed Non-Government Non-Financial Companies according to Size of Paid-up-Capital |
Growth Rates |
| B |
Select Ratios |
| 4 |
A |
Performance of Listed Non-Government Non-Financial Companies according to Size of Sales |
Growth Rates |
| B |
Select Ratios |
| 5 |
A |
Performance of Listed Non-Government Non-Financial Companies according to Industry |
Growth Rates |
| B |
Select Ratios |
| Explanatory Notes |
| Glossary of Terms |
Notes:
- Explanatory notes containing the methodology followed for compilation of data, and the glossary (including revised definitions and calculations that differ from previous releases) are appended.
(Puneet Pancholy)
Chief General Manager
Press Release: 2025-2026/596
|
 IST,
IST,