RbiSearchHeader

Press escape key to go back

Past Searches

Theme
Theme
Text Size
Text Size
S3

RbiAnnouncementWeb

RBI Announcements
RBI Announcements

Asset Publisher

135991686

Bank Lending Survey for Q3:2024-25

Today, the Reserve Bank released the results of 30th round of its quarterly Bank Lending Survey1, which captures qualitative assessment and expectations of major scheduled commercial banks on credit parameters (viz., loan demand as well as terms and conditions of loans) for major economic sectors2. The latest round of the survey, which was conducted during Q3:2024-25, collected senior loan officers’ assessment of credit parameters for Q3:2024-25 and their expectations for Q4 of 2024-25 and Q1 and Q2 of 2025-26.

Highlights:

A. Assessment for Q3:2024-25

  • Bankers assessed higher credit demand across all broad sectors except retail/personal loans, which recorded some growth moderation vis-à-vis the previous quarter (Chart 1 and Table 1).

  • Terms and conditions of loans to mining sector were assessed to have tightened but remained easy for the remaining sectors during Q3:2024-25 (Table 2).

B. Expectations for Q4:2024-25

  • Bankers expect some moderation on overall loan demand conditions during Q4:2024-25; the high optimism on demand for retail/personal loans tempered even as it improved or remained at previous quarter’s level for other sectors (Table 1).

  • Across sectors, easy loan terms and conditions are expected to prevail during Q4:2024-25 except the mining sector where some tightening is expected (Table 2).

C. Expectations for Q1:2025-26 and Q2:2025-26

  • Bankers expect seasonal moderation in loan growth across sectors during Q1:2025-26; it is expected to pick up in the subsequent quarter (Table 3).

  • Bankers’ expectation of terms and conditions during Q4:2024-25 extend to H1:2025-26.

Chart_1
 
Table 1: Sector-wise Loan Demand - Net Response3
(per cent)
Sector Assessment Period Expectations Period
Q2:2024-25 Q3:2024-25 Q3:2024-25 Q4:2024-25
All Sectors 42.3 46.3 46.2 44.4
Agriculture 38.3 40.0 36.7 40.0
Mining and Quarrying 10.0 11.7 15.0 15.0
Manufacturing 43.1 44.6 41.4 46.4
Infrastructure 26.7 36.7 38.3 38.3
Services 41.1 42.9 39.3 41.1
Retail/Personal 45.8 42.3 47.9 46.2
 
Table 2: Sector-wise Loan Terms and Conditions - Net Response
(per cent)
Sector Assessment Period Expectations Period
Q2:2024-25 Q3:2024-25 Q3:2024-25 Q4:2024-25
All Sectors 13.5 14.3 21.2 17.9
Agriculture 15.5 13.3 24.1 21.7
Mining and Quarrying -1.8 -5.4 1.8 -5.4
Manufacturing 19.6 20.4 17.9 18.5
Infrastructure 14.3 12.5 14.3 14.3
Services 18.5 16.7 16.7 16.7
Retail/Personal 17.4 24.0 17.4 24.0
 
Table 3: Sector-wise Expectations for Extended Period - Net Response
(per cent)
Sector Loan Demand Loan Terms and Conditions
Q1:2025-26 Q2:2025-26 Q1:2025-26 Q2:2025-26
All Sectors 38.9 40.7 20.4 20.4
Agriculture 32.8 39.7 19.0 20.7
Mining and Quarrying 12.5 16.1 -1.8 -3.6
Manufacturing 31.0 32.8 20.7 19.0
Infrastructure 33.9 35.7 14.3 14.3
Services 35.7 41.1 19.6 21.4
Retail/Personal 26.8 35.7 21.4 23.2

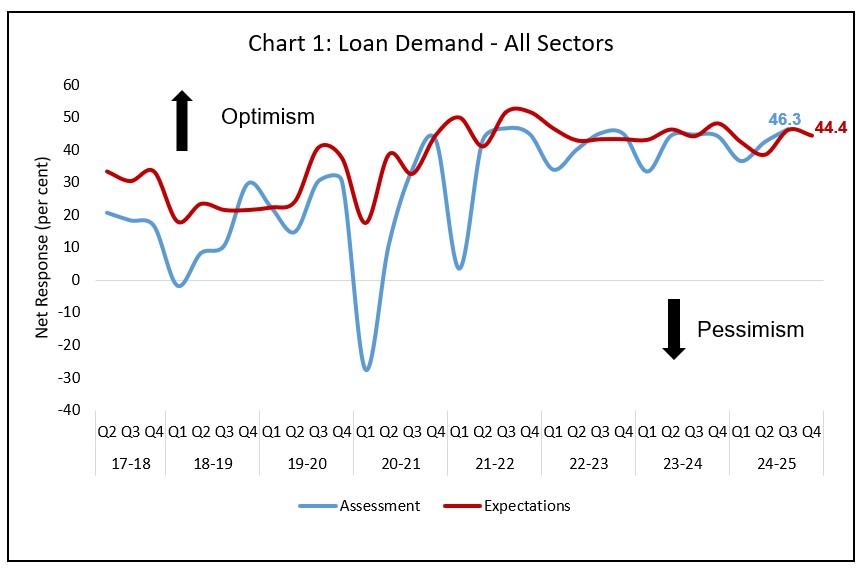
Note: Please see the attached excel file for detailed time series data.


1 The results of 29th round of the BLS with reference period as July-September 2024 were released on the RBI website on October 09, 2024. The survey results reflect the views of the respondents, which are not necessarily shared by the Reserve Bank.

2 The survey questionnaire is canvassed among major 30 SCBs, which together account for over 90 per cent of credit by SCBs in India.

3 Net Response (NR) is computed as the difference of percentage of banks reporting increase/optimism and those reporting decrease/pessimism in respective parameter. The weights of +1.0, 0.5, 0, -0.5 and -1.0 are assigned for computing NR from aggregate per cent responses on 5-point scale, i.e., substantial increase/ considerable easing, moderate increase/ somewhat easing, no change, moderate decrease/ somewhat tightening, substantial decrease/ considerable tightening for loan demand/loan terms and conditions parameters respectively. NR ranges between -100 to 100. Any value greater than zero indicates expansion/optimism and any value less than zero indicates contraction/pessimism. Increase in loan demand is considered optimism (Tables 1), while for loan terms and conditions, a positive value of net response indicates easy terms and conditions (Table 2).

RbiTtsCommonUtility

प्ले हो रहा है
ਸੁਣੋ

Related Assets

RBI-Install-RBI-Content-Global

RbiSocialMediaUtility

ਭਾਰਤੀ ਰਿਜ਼ਰਵ ਬੈਂਕ ਮੋਬਾਈਲ ਐਪਲੀਕੇਸ਼ਨ ਇੰਸਟਾਲ ਕਰੋ ਅਤੇ ਨਵੀਨਤਮ ਖਬਰਾਂ ਤੱਕ ਤੇਜ਼ ਐਕਸੈਸ ਪ੍ਰਾਪਤ ਕਰੋ!

Scan Your QR code to Install our app

RbiWasItHelpfulUtility

ਕੀ ਇਹ ਪੇਜ ਲਾਭਦਾਇਕ ਸੀ?