 IST,
IST,
I. Output
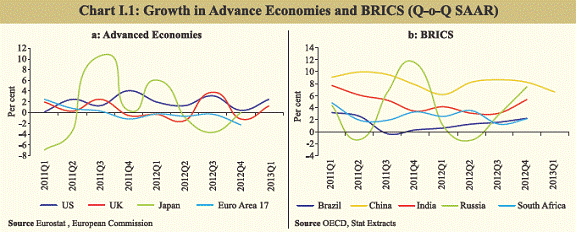
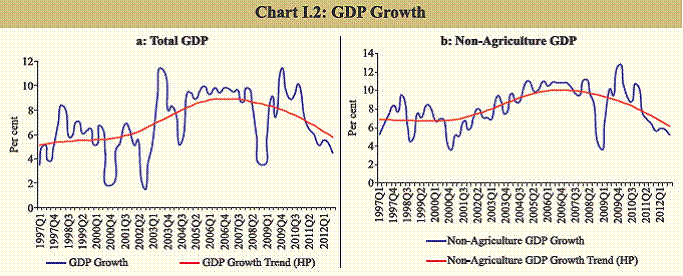
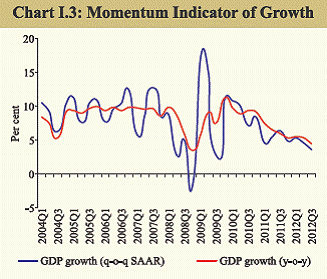
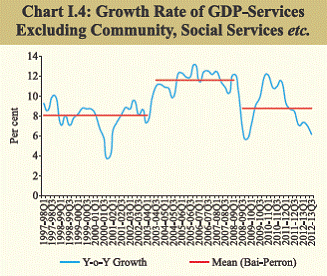
Growth decelerated further during Q3 of 2012-13, with the slowdown extending to services sector, which has been the mainstay of India’s high growth. Mining and manufacturing activity continued to stall while agriculture output was impacted by deficient rainfall during the monsoon season. Domestic policy uncertainties, sluggish external demand and the lagged impact of the earlier monetary tightening policy reduced growth. Global growth decelerated during 2012 and is expected to remain weak during 2013 also. As business sentiments remain weak and structural impediments still constrain activity levels, recovery during 2013-14 may be modest. Global growth likely to remain weak in 2013 I.1 Global growth turned weaker in 2012 with slack external demand in advanced economies (AEs) adversely impacting growth in emerging market and developing economies (EMDEs). Activity levels are expected to stay weak in 2013 as fiscal adjustments drag growth in AEs and, in turn, delay cyclical recovery in EMDEs. I.2 In its April 2013 World Economic Outlook (WEO), the IMF has forecasted global growth to stay subdued at 3.3 per cent in 2013, down by 0.2 percentage points from its January 2013 projections. The IMF expects global growth to pick up to 4.0 per cent in 2014 on the strength of the anticipated sharper recovery in the US. I.3 Recent information suggest that global growth has stayed subdued although with slight improvement during Q1 of 2013. The US growth accelerated to 2.5 per cent (seasonally adjusted annualised quarter-on-quarter growth rate, q-o-q saar) in Q1 of 2013 from 0.4 per cent in Q4 of 2012, but was below market expectation. Japan’s GDP remained flat in Q4 of 2012, after two quarters of contraction. The euro area remained in a contraction mode, with the pace of contraction increasing to 2.3 per cent (q-o-q, saar) in Q4 of 2012 from 0.3 per cent in Q3 (Chart I.1a). The UK narrowly avoided a triple dip recession in Q1 of 2013 by expanding at 1.2 per cent (q-o-q, saar) after contracting by the same rate in Q4 of 2012. I.4 The expected loss of growth and employment in the US due to its budget sequestration may prove to be a drag on global economic expansion during 2013. According to the US Congressional Budget Office (CBO), fiscal tightening will knock out about 1.5 percentage points from US GDP growth in 2013. 1.5 The US economy job gains have brought the unemployment rate to a four-year low of 7.6 per cent in March 2013, while euro area unemployment rate remained at a record level of 12 per cent in February 2013. I.6 With the Chinese economy slowing down risks to global recovery have increased. Growth in China was around 7.8 per cent in 2012 and has declined to 6.6 per cent (q-o-q, saar) in Q1 of 2013. Brazil and South Africa have shown some improvement in their GDP growth in Q4 of 2012 (Chart I.1b). I.7 Consequent to the slow global growth, world trade remained subdued for most of 2012 and in 2013 so far (see Chapter 3). Slowdown of Indian economy persists I.8 During 2012-13, the Indian economy continued to witness slowdown for the third quarter in succession (Table I.1). GDP growth in Q3 of 2012-13 at 4.5 per cent has been the lowest since Q4 of 2008-09 (3.5 per cent). The decline in the growth rate was seen in the agriculture and services sectors, while industrial growth remained listless. Overall, growth continued to remain below trend for the sixth consecutive quarter since Q2 of 2011-12 (Chart I.2). The momentum indicator corroborates the slowdown (Chart I.3). I.9 While the moderation of growth in agriculture was largely on account of the rainfall deficiency, the slowdown in industry and services reflected several factors including domestic policy uncertainties, lagged impact of earlier monetary tightening and slackening of external demand. The sharp deterioration in the services sector in Q3 of 2012-13 over Q3 of the previous year was mainly reflected under ‘trade, hotels, transport and communication’ and ‘financing, insurance, real estate and business services’. These sub-sectors slowed down in line with the slowdown of activity in industry and agriculture as also in the external sector. Sector-specific problems, such as those in communications, aggravated the slowdown. I.10 The extension of the slowdown to the services sector, the main driver of India’s high growth, merits close attention. The quarterly GDP of the services sector excluding community, social and personal services during the period 1997-98 to 2012-13 indicates two structural breaks in its growth series (Chart I.4). These breaks also indicate that current slowdown in the services sector starting since Q2 of 2008-09 has pulled down the sectors’ mean growth to about the level prior to Q2 of 2003-04. Trade, telecommunications, transport by means other than railways and construction activity have been particularly impacted in the current cycle. Deficient rainfall affects agricultural output I.11 Deficiency and uneven distribution of rainfall during July-August 2012 dented kharif sowing in 2012 and impacted the production of foodgrains and commercial crops. The recovery of rainfall from September onward helped maintain soil moisture during the rabi season. The production of rabi oilseeds and coarse cereals has improved and rabi pulses are poised for record production during 2012- 13. However, the production of wheat is expected to decline during 2012-13, mainly due to the smaller area covered under the crop. The decline in production of foodgrains during 2012-13 is estimated at only 3.5 per cent (Table I.2). I.12 The current stock of foodgrains (59.7 million tonnes at end-March 2013) is sufficient to meet the buffer norms and requirements under the various poverty alleviation schemes. In view of the pace at which food stocks are building up, i.e., around 27 per cent per annum in the past five years, there is a need for better management of the food stock in order to dampen cereal inflation.
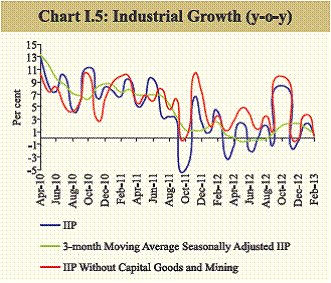
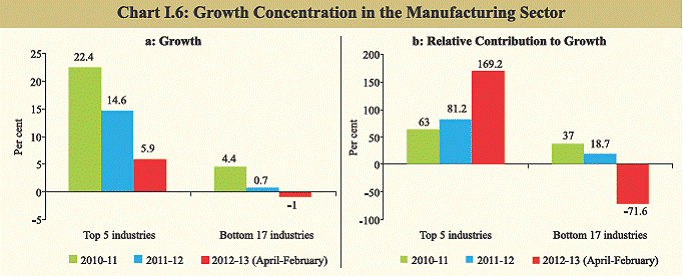
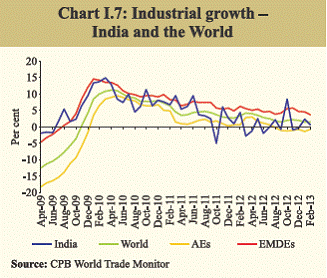
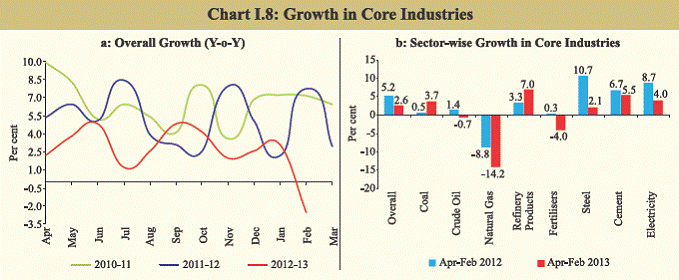
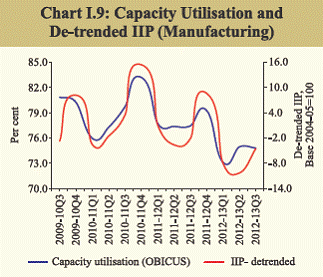
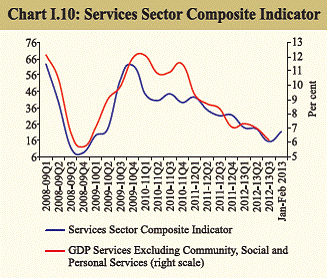
Industrial growth is stagnating, but could improve ahead I.13 Growth in the index of industrial production (IIP) witnessed a slowdown to 0.9 per cent during April-February 2012-13, largely due to infrastructure and input constraints, rising costs and moderation of external demand (Table I.3). Contraction in capital goods and the mining sector continue to affect the overall performance of the industrial sector (Chart I.5). Excluding the volatile items, the truncated IIP (96 per cent of IIP) growth in April-February 2012-13 is 1.5 per cent. I.14 The growth of the manufacturing sector remained highly concentrated. Of the 22-major industry groups, the fastest growing top five manufacturing industries had the largest contribution of about 169 per cent to the overall growth of the manufacturing sector during April-February 2012-13 (Chart 1.6). Bottom 17 industries had a negative contribution of 72 per cent. Major industries that registered contraction in output included motor vehicles, electrical machinery & apparatus, machinery & equipment and fabricated metal products. I.15 Shortage of power was a major constraining factor for the growth of the industrial sector. Growth in electricity generation decelerated during 2012-13 to 4.0 per cent from 8.2 per cent in the year before. The gap between requirement and availability of power increased to 8.7 per cent during the period. Shortages in coal supply, delays in capacity addition and a delayed and skewed monsoon have contributed to the slower growth of power generation. I.16 Capital goods output continued to contract, reflecting a subdued investment climate. The slowdown in economic activity and consumption demand has resulted in moderation in the growth of consumer goods. I.17 Apart from domestic constraints, weak global growth was also responsible for the domestic industrial slowdown given the strong co-movement between the domestic and global IIP, with a statistically significant correlation coefficient of 0.7 for the period April 2008 to February 2013 (Chart 1.7). Structural bottlenecks affect growth of core industries I.18 Core industries are faced with various supply constraints, such as shortage of coal and natural gas, stoppage of mining in some states and delays in commissioning of large projects. Consequently, the growth of eight core industries decelerated to 2.6 per cent during April- February 2012-13 compared to 5.2 per cent during the corresponding period last year. The production of electricity and steel recorded sharp deceleration (Chart I.8). The pick-up in the industrial sector is contingent upon a tangible turnaround in the performance of the core industries. Capacity Utilisation remained flat I.19 Capacity utilisation, as measured by the 20th Round of the Order Books, Inventories and Capacity Utilisation Survey (OBICUS) of the Reserve Bank, remained around the previous quarter’s level during Q3 of 2012-13 (/en/web/rbi/-/publications/quarterly-order-books-inventories-and-capacity-utilisation-survey-obicus-october-december-2012-20th-round-14972). There is broad co-movement between capacity utilisation and the de-trended IIP – Manufacturing (Chart I.9). After sequential lowering in the previous two quarters, new orders picked up marginally in Q3 of 2012-13; however, its growth remained lower than in the corresponding quarter of the previous year. The finished goods inventory to sales ratio reached its lowest level in the past five quarters, whereas the raw material inventory to sales ratio surged further to reach its highest level in five quarters. Services sector witnesses moderation in growth I.20 Weak global growth coupled with the slowdown in domestic consumption has adversely affected the performance of the services sector. Several indicators of the services sector activity show a slowdown in their activity during April-February 2012-13 (Table I.4). The Reserve Bank’s services sector composite indicator based on growth in indicators of construction, trade and transport and finance, showed a continuation of the downturn in services in Q3 of 2012-13, but indicated slight improvement during January- February of 2013 (Chart I.10). Employment scenario remained weak during April-December 2012-13 I.21 The weak employment scenario that started from Q4 of 2011-12 still continues. As per the Labour Bureau survey, employment creation in the eight key sectors during 2012-13 (April-December) declined by 68 per cent over the corresponding period of the previous year, largely due to the IT/BPO sector, which is one of the main contributors to employment generation in the organised sector. Except for textiles and leather, all other sectors have also shown a decline in the rate of employment generation (Table I.5).
Growth likely to have stayed low in Q4 of 2012-13, recovery in 2013-14 contingent on addressing supply bottlenecks I.22 Given the continued dismal performance of industry and evidence of a slowdown in services, growth is likely to have remained subdued in Q4 of 2012-13. Going forward, sustained efforts by the government to expediting environmental clearances and land acquisition are needed to turnaround growth in core industries. I.23 Constraints facing the infrastructure sector need to be addressed. The Reserve Bank, on its part, has also recently relaxed the norms for external commercial borrowings for infrastructural finance companies and has eased the norms for treating bank loans to public private partnership (PPP) projects as secured finance subject to conditions. On the global front, a meaningful recovery in euro area is likely to take somewhat longer. In this environment, growth in India is excepted to remain below potential for the third year in succession during 2013-14. |
||||||||||||||||||||||||||||||||||||||||||||||||||||||||||||||||||||||||||||||||||||||||||||||||||||||||||||||||||||||||||||||||||||||||||||||||||||||||||||||||||||||||||||||||||||||||||||||
ਪੇਜ ਅੰਤਿਮ ਅੱਪਡੇਟ ਦੀ ਤਾਰੀਖ:


