 IST,
IST,


II Recent Economic Developments (Part 1 of 2)
Real Sector
Public Finances
Monetary Developments
Introduction
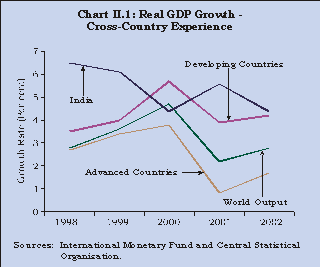
2.1 India continued to remain among the fastest growing economies in the world in 2002 in an international environment characterised by a hesitant recovery of global output and trade, adverse external factors and heightened risk aversion in financial markets. The international outlook continues to be uncertain especially in view of the delay in economic recovery in the face of persistent weak activity in advanced countries and the ramifications of the military action in Iraq which is still unfolding. According to the International Monetary Fund’s World Economic Outlook, September 2002, world output is projected to grow by 2.8 per cent during 2002 and 3.7 per cent during 2003 (Chart II.1).
2.2 Notwithstanding the uncertainties in the global economy, the macroeconomic conditions remain favourable in India. Despite the drought situation in many parts of the country due to a weak and uneven monsoon after 13 years, foodgrain stocks remain comfortable. The industrial sector is continuously showing signs of broad-based recovery, led by all the three major constituents – mining, manufacturing and electricity. Significantly, the production of the infrastructure industries and capital goods has also revived. The services sector continues to sustain the Gross Domestic Product (GDP) with support from knowledge-based services such as professional and technical services. The inflation situation remains benign. Conditions in the financial markets were stable during the year with ample liquidity creating a favourable interest rate environment for investment. Bank credit continued to pick up. In the external sector, a robust performance of exports and invisible earnings, despite an adverse global scenario, was reflected in a modest surplus in the current account, which facilitated a record accretion to foreign exchange reserves. Thus, the macroeconomic situation remains comfortable although the decline in agricultural production, concerns relating to the fiscal position and international political unrest remain downside risks that could constrain growth. Seen in the context of these uncertainties, the performance of the Indian economy during 2002-03 so far demonstrates its intrinsic resilience to shocks.
I. MACROECONOMIC DEVELOPMENTS: 2002-03
2.3 The real GDP growth rate is estimated to be 4.4 per cent in 2002-03 as per the Advance Estimates of the Central Statistical Organisation (CSO), somewhat lower than 5.6 per cent (Quick Estimates) in 2001-02 (Table 2.1). The expected slowdown in GDP growth in 2002-03 is mainly because of a sharp fall in agricultural GDP. Quarterly estimates of agricultural GDP indicated a growth rate of 4.4 per cent and zero per cent in the first and second quarters of 2002-03, respectively, over the corresponding period of 2001-02. Poor rains in the sowing month of July 2002 during the South-West monsoon season have led to an estimated decline of 21.3 million tonnes in kharif production to 90.3 million tonnes.
Table 2.1 : Macroeconomic Indicators | |||||||||||||||||||||||||||||||||||||||
(Per cent) | |||||||||||||||||||||||||||||||||||||||
2001-02 | 2002-03 | 2001-02 | |||||||||||||||||||||||||||||||||||||
Variable | so far | (corresponding | |||||||||||||||||||||||||||||||||||||
period last year) | |||||||||||||||||||||||||||||||||||||||
1 | 2 | 3 | |||||||||||||||||||||||||||||||||||||
Real GDP | 5.6 | 4.4 $ | – | ||||||||||||||||||||||||||||||||||||
Agriculture and Allied Activities | 5.7 | -3.1 $ | – | ||||||||||||||||||||||||||||||||||||
Industry | 3.2 | 5.8 $ | – | ||||||||||||||||||||||||||||||||||||
Services | 6.5 | 7.1 $ | – | ||||||||||||||||||||||||||||||||||||
Index of Industrial Production (IIP) | 2.8 | 5.5 | 2.6 | ||||||||||||||||||||||||||||||||||||
(up to January) | (up to January) | ||||||||||||||||||||||||||||||||||||||
Foodgrains Production (mt) | 212.0 | 183.2 | 212.0 | ||||||||||||||||||||||||||||||||||||
Food Stocks (mt) (end-March) | 51.0 | 40.1 | 56.4 | ||||||||||||||||||||||||||||||||||||
(end-January) | (end-January) | ||||||||||||||||||||||||||||||||||||||
GFD / GDP (ratio) | 6.1 | 5.9 (R.E.) | – | ||||||||||||||||||||||||||||||||||||
Broad Money (M3) | 14.2 | 14.3 (11.4 &) | 13.0 | ||||||||||||||||||||||||||||||||||||
(up to March 7) | (up to March 8) | ||||||||||||||||||||||||||||||||||||||
Net Bank Credit to the Government | 14.6 | 13.0 | 14.0 | ||||||||||||||||||||||||||||||||||||
(up to March 7) | (up to March 8) | ||||||||||||||||||||||||||||||||||||||
Scheduled Commercial Banks’ Non- | 12.7 | 22.9 (15.7 &) | 9.9 | ||||||||||||||||||||||||||||||||||||
Food Credit (adj. for non-SLR Investments) | (up to March 7) | (up to March 8) | |||||||||||||||||||||||||||||||||||||
WPI Inflation (Point-to-point) | 1.6 | 4.7# | 2.0# | ||||||||||||||||||||||||||||||||||||
(March 1) | (March 2) | ||||||||||||||||||||||||||||||||||||||
Call Money Borrowing Rate (Weighted average) | 6.97 | 5.90 | 7.18 | ||||||||||||||||||||||||||||||||||||
(February) | (February) | ||||||||||||||||||||||||||||||||||||||
Yield on 10-Year Government Securities ## | 7.36 | 6.34 | 7.34 | ||||||||||||||||||||||||||||||||||||
(end-February) | (end-February) | ||||||||||||||||||||||||||||||||||||||
BSE Sensex (Average) | 3331.95 | 3210.67 | 3311.21 | ||||||||||||||||||||||||||||||||||||
(up to February) | (up to February) | ||||||||||||||||||||||||||||||||||||||
Exchange Rate (Rupees/US $) | 48.80 | 47.66 | 48.72 | ||||||||||||||||||||||||||||||||||||
(as on end- March) | (as on March 13) | (as on March 13) | |||||||||||||||||||||||||||||||||||||
Export Growth Rate (US $ terms) | -1.6 | 17.3 | -0.3 | ||||||||||||||||||||||||||||||||||||
(up to January) | (up to January) | ||||||||||||||||||||||||||||||||||||||
Import Growth Rate (US $ terms) | 1.7 | 15.9 | 0.2 | ||||||||||||||||||||||||||||||||||||
(up to January) | (up to January) | ||||||||||||||||||||||||||||||||||||||
Current Account Balance (US $ billion) | 1.3 | 2.5 | -1.3 | ||||||||||||||||||||||||||||||||||||
(up to November) | (up to November) | ||||||||||||||||||||||||||||||||||||||
Foreign Investment Inflow (US $ million) | 5,925 | 2,642 | 4,055 | ||||||||||||||||||||||||||||||||||||
(up to December) | (up to December) | ||||||||||||||||||||||||||||||||||||||
Non-Resident Deposit Inflow (US $ million) | 2,728 | 2,283 | 2,254 | ||||||||||||||||||||||||||||||||||||
(up to December) | (up to December) | ||||||||||||||||||||||||||||||||||||||
Foreign Exchange Reserves* (US $ million) | 54,106 | 73,918 | 52,189 | ||||||||||||||||||||||||||||||||||||
(March 13) | (March 15) | ||||||||||||||||||||||||||||||||||||||
* | As at the end of & the period. | & | Excludes the impact of mergers since May 3, 2002. | ||||||||||||||||||||||||||||||||||||
# | On a year-on-year basis. | $ | Advance Estimates from CSO. | ||||||||||||||||||||||||||||||||||||
## | On residual maturity basis. | ||||||||||||||||||||||||||||||||||||||
2.4 On the other hand, the CSO Advance Estimates show that the industrial and services sectors are expected to grow at an accelerated pace during 2002-03. The growth rate in the industrial sector is estimated to recover to 5.8 per cent in 2002-03, much higher than 3.2 per cent in the previous year. The expected growth rate would be higher in all the constituent sectors – ‘manufacturing’, ‘mining and quarrying’ and ‘electricity, gas and water supply’. The industrial recovery is clearly evident in the quarterly industrial GDP, which grew by 4.1 per cent and 6.1 per cent in the first and second quarters of 2002-03 as compared with 2.5 per cent and 2.7 per cent, respectively, during the same quarters of 2001-02. Furthermore, the index of industrial production (IIP) registered an upward trend during 2002-03 (up to January) with the IIP growing by 5.5 per cent as compared with 2.6 per cent during the same period of the previous year. The capital goods sector grew by 10.6 per cent during 2002-03 (up to January), while the infrastructure industries also witnessed a higher growth of 5.2 per cent during 2002-03 (up to February). The services sector is expected to continue to provide strong support to GDP, with its share increasing to 56.0 per cent in 2002-03 from 54.6 per cent in 2001-02 in line with long-term trends. All the sectors, except ‘trade, hotels, restaurants, transport and communication’ are expected to grow at a higher rate in 2002-03. The robust performance during the first two quarters of 2002-03 demonstrates the strength of the services sector in sustaining output against the backdrop of a significant fall in agricultural GDP.
2.5 The deterioration on the fiscal front continues to be a matter of concern. The gross fiscal deficit (GFD) at 5.9 per cent of GDP in the revised estimates for 2002-03 exceeded the budget estimate of 5.3 per cent. The rising fiscal deficit inevitably constrains augmenting outlays on the much needed social and physical infrastructure and poverty alleviation programmes. Recognising these issues, the Union Budget 2003-04 accorded priority to fiscal consolidation while addressing the basic objectives of eradication of poverty, giving a major boost to infrastructure and laying the foundations for balanced and accelerated growth of agriculture and industry. The Union Budget for 2003-04 envisages a reduction in the GFD to 5.6 per cent of GDP.
2.6 Monetary conditions remained stable with ample liquidity creating a favourable interest rate environment conducive for investment during 2002-03. Abundant liquidity conditions enabled a smooth absorption of the Centre’s market borrowing as well as a softening of interest rates. Large and persistent capital inflows were sterilised by timely open market (including repo) operations. Consequently, base money expansion remained moderate at 7.5 per cent during 2002-03 (up to March 14, 2003) as compared with 8.8 per cent during the corresponding period of the previous year. Net of merger effects, broad money (M3) growth was below the projections made by the Monetary and Credit Policy for 2002-03. On an year- grew by 12.7 per cent (net of the on-year basis, M3 impact of the mergers) as on March 7, 2003 as compared with 13.9 per cent a year ago. The growth in net bank credit to the Government slowed down to 13.0 per cent during 2002-03 (up to March 7, 2003) from 14.0 per cent during the corresponding period of the previous year. Bank credit to the commercial sector increased by 11.3 per cent (net of the merger impact) as compared with 9.2 per cent during the comparable period of 2001-02. The revival in non-food bank credit, which took root in the last quarter of 2001-02, firmed up throughout 2002-03 reflecting the improvement in the industrial climate. Inflation remained moderate throughout 2002-03 notwithstanding the shortfall in agricultural production and the volatility in oil prices with war risk perceptions. Headline inflation, measured by point-to-point annual changes in the WPI, edged up to 4.7 per cent on March 1, 2003 due to a hardening of international oil prices and base effects. On an annual average basis, the inflation rate decelerated to 3.0 per cent as on March 1, 2003 from 3.9 per cent in the corresponding period of the previous year.
2.7 Financial markets remained generally stable during 2002-03. The co-existence of adequate liquidity conditions and moderation of inflation expectations enabled a softening of interest rates. The Bank Rate, in particular, at 6.25 per cent, is now at a 30-year low. The reduction in interest rates in recent times has taken place across maturities despite a high fiscal deficit. This, combined with a benign inflationary environment, is a welcome development which augurs well for industrial recovery. While at the short-end, the overnight average call money rates moved down by 126 basis points guided primarily by repo rate cuts, the 10-year and the 25-year secondary market yields of government securities softened by 103 basis points and 77 basis points, respectively, during 2002-03 (up to February). The call money market remained stable, with call rates hovering around the repo rate. The government securities market witnessed a continued rally in the prices of government securities during the larger part of 2002-03. Yields have, however, been firming up since mid-January 2003, in the face of international uncertainties and inching up of domestic inflation rates. The foreign exchange market exhibited orderly conditions during 2002-03, with the exchange rate of the rupee trading in a narrow range. The stock markets were affected by a number of adverse factors such as border tensions, unsatisfactory monsoons and subdued trends in international markets.
2.8 The external sector of the Indian economy posted significant gains. Driven by the robust merchandise export performance and the highest ever net invisible earnings in any year, the current account balance recorded a larger surplus than in 2001-02, despite a reasonably well-distributed pick up in imports.Net capital flows remained stable, particularly foreign direct investment (FDI) and non-resident deposits. These salutary developments resulted in a record accretion of around US $ 20 billion to foreign exchange reserves during 2002-03 (up to March 13, 2003). The foreign exchange reserves stood at US $ 73.9 billion as on March 13, 2003, the seventh largest in the world. On the other hand, the strength of capital flows resulted in a modest appreciation of the exchange rate of the Rupee vis-a-vis the US dollar. Besides, the improvement in external-debt indicators now places India in the 'less-indebted' country category.
2.9 Real GDP is likely to grow by 4.4 per cent (Advance Estimates) in 2002-03 as compared with an average growth rate of 5.5 per cent during the Ninth Five Year Plan Period (1997-98 to 2001-02) (Table 2.2). The estimated fall in the GDP growth rate during 2002-03, as already noted, is mainly because of the drought conditions witnessed in several parts of the country. The States which were severely affected by the deficiency of rains during the South-West monsoon 2002 were Haryana, Rajasthan, Punjab, Uttar Pradesh, Orissa, Madhya Pradesh, Gujarat, Tamil Nadu and parts of Karnataka and Kerala. It is expected that the industrial recovery would get more entrenched during 2002-03, while the services sector would continue to act as a cushion to higher GDP growth.
Table 2.2 : Sectoral Growth Rates of Gross Domestic Product | |||||||||||||||||||||||||||||||||||||||
(at 1993-94 prices) | |||||||||||||||||||||||||||||||||||||||
(Per cent) | |||||||||||||||||||||||||||||||||||||||
Sector | Growth Rate | ||||||||||||||||||||||||||||||||||||||
1997- | 1998- | 1999- | 2000- | 2001- | Ninth Plan | 2002- | |||||||||||||||||||||||||||||||||
98 | 99 | 2000 | 01@ | 02* | Average | 03# | |||||||||||||||||||||||||||||||||
(1997-98 to | |||||||||||||||||||||||||||||||||||||||
2001-02) | |||||||||||||||||||||||||||||||||||||||
1 | 2 | 3 | 4 | 5 | 6 | 7 | |||||||||||||||||||||||||||||||||
1. | Agriculture and Allied Activities | -2.4 | 6.2 | 0.3 | -0.4 | 5.7 | 1.9 | -3.1 | |||||||||||||||||||||||||||||||
1.1 | Agriculture | -2.8 | 6.9 | -0.1 | -0.6 | 5.7 | 1.8 | .. | |||||||||||||||||||||||||||||||
2. | Industry | 3.0 | 3.2 | 4.1 | 6.5 | 3.2 | 4.0 | 5.8 | |||||||||||||||||||||||||||||||
2.1 | Mining and Quarrying | 9.8 | 2.8 | 3.3 | 2.4 | 1.0 | 3.9 | 4.8 | |||||||||||||||||||||||||||||||
2.2 | Manufacturing | 1.5 | 2.7 | 4.0 | 7.3 | 3.4 | 3.8 | 6.1 | |||||||||||||||||||||||||||||||
2.3 | Electricity, Gas and Water Supply | 7.9 | 7.0 | 5.2 | 5.0 | 4.3 | 5.9 | 5.2 | |||||||||||||||||||||||||||||||
3. | Services | 9.8 | 8.1 | 9.9 | 5.8 | 6.5 | 8.0 | 7.1 | |||||||||||||||||||||||||||||||
3.1 | Construction | 10.2 | 6.2 | 8.0 | 6.9 | 3.7 | 7.0 | 7.1 | |||||||||||||||||||||||||||||||
3.2 | Trade, Hotels, Restaurants, | 7.7 | 7.7 | 8.6 | 6.9 | 8.7 | 7.9 | 7.8 | |||||||||||||||||||||||||||||||
Transport and Communication | |||||||||||||||||||||||||||||||||||||||
3.3 | Financing, Insurance, Real Estate and | 11.6 | 7.4 | 10.6 | 3.5 | 4.5 | 7.5 | 6.5 | |||||||||||||||||||||||||||||||
Business Services | |||||||||||||||||||||||||||||||||||||||
3.4 | Community, Social and Personal Services | 11.7 | 10.4 | 12.2 | 5.6 | 5.6 | 9.1 | 6.4 | |||||||||||||||||||||||||||||||
4. | GDP at factor cost | 4.8 | 6.5 | 6.1 | 4.4 | 5.6 | 5.5 | 4.4 | |||||||||||||||||||||||||||||||
@ | Provisional Estimates. | * | Quick Estimates. | # | Advance Estimates. | ||||||||||||||||||||||||||||||||||
Source : | Central Statistical Organisation. | ||||||||||||||||||||||||||||||||||||||
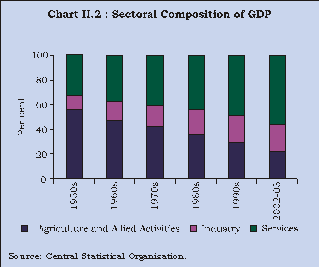
2.10 During 2002-03, the share of services rose significantly to 56.0 per cent, while its relative contribution to the overall growth of 4.4 per cent worked out to 88.3 per cent. The contributions from the industrial and agricultural sectors were 28.8 per cent and (-) 17.1 per cent, respectively, during 2002-03. The trend sectoral composition of GDP indicates a continuous fall in the share of agriculture from an average of 36.4 per cent in the 1980s to 29.1 per cent in the 1990s. The share of agriculture in the overall GDP fell further to 22.2 per cent in 2002-03. On the other hand, the share of industry in the overall GDP rose from an average of 19.5 per cent in the 1980s to 21.9 per cent in the 1990s, and remained almost at the same level in 2002-03. The services sector witnessed a sharp rise in its share in GDP from an average of 44.0 per cent in the 1980s to 49.0 per cent in the 1990s (Chart II.2).
2.11 The available data on the quarterly growth rates of real GDP so far indicate that the growth rate of real GDP is higher in the first and second quarters of 2002-03 as compared with the corresponding quarters of the previous year (Chart II.3). The increase in the growth rate of real GDP in the second quarter of 2002-03 was mainly driven by the industry and services sectors (Table 2.3). The industrial expansion has come about mainly from ‘manufacturing’ and ‘mining and quarrying’.
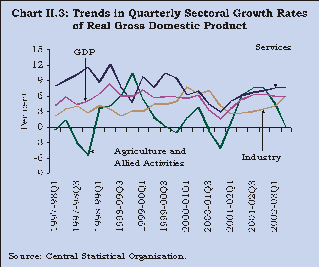
Table 2.3 : Quarterly Sectoral Growth Rates of Gross Domestic Product | |||||||||||||||||||||||||||||||||||||||
(at 1993-94 prices) | |||||||||||||||||||||||||||||||||||||||
(Per cent) | |||||||||||||||||||||||||||||||||||||||
Sector | 2000-01 | 2001-02 | 2002-03 | ||||||||||||||||||||||||||||||||||||
Q1 | Q2 | Q3 | Q4 | Q1 | Q2 | Q3 | Q4 | Q1 | Q2 | ||||||||||||||||||||||||||||||
1 | 2 | 3 | 4 | 5 | 6 | 7 | 8 | 9 | 10 | ||||||||||||||||||||||||||||||
1. | Agriculture and Allied Activities | 1.8 | 3.9 | -0.8 | -4.0 | 1.1 | 6.3 | 7.6 | 7.6 | 4.4 | 0.0 | ||||||||||||||||||||||||||||
2. | Industry | 7.6 | 6.4 | 7.0 | 4.1 | 2.5 | 2.7 | 3.0 | 3.4 | 4.1 | 6.1 | ||||||||||||||||||||||||||||
2.1 | Mining and Quarrying | 4.8 | 3.6 | 4.3 | 0.9 | -0.3 | 0.7 | 3.1 | 3.5 | 5.3 | 5.1 | ||||||||||||||||||||||||||||
2.2 | Manufacturing | 8.1 | 7.1 | 7.1 | 4.6 | 2.7 | 2.6 | 2.9 | 3.1 | 3.8 | 6.4 | ||||||||||||||||||||||||||||
2.3 | Electricity, Gas and | 7.1 | 4.5 | 9.3 | 4.0 | 3.9 | 5.4 | 3.8 | 5.4 | 5.3 | 4.9 | ||||||||||||||||||||||||||||
Water Supply | |||||||||||||||||||||||||||||||||||||||
3. | Services | 6.3 | 6.9 | 4.4 | 2.9 | 5.1 | 6.0 | 6.6 | 7.0 | 7.5 | 7.6 | ||||||||||||||||||||||||||||
3.1 | Construction | 12.4 | 10.0 | 7.2 | -1.2 | -0.2 | 2.7 | 4.4 | 7.5 | 6.3 | 7.2 | ||||||||||||||||||||||||||||
3.2 | Trade, Hotels, Restaurants, | 8.1 | 6.3 | 4.8 | 2.4 | 4.5 | 6.3 | 6.6 | 7.2 | 7.4 | 8.0 | ||||||||||||||||||||||||||||
Transport and | |||||||||||||||||||||||||||||||||||||||
Communication | |||||||||||||||||||||||||||||||||||||||
3.3 | Financing, Insurance, | 3.7 | 3.9 | 2.1 | 2.0 | 7.0 | 7.6 | 8.1 | 8.3 | 9.7 | 8.9 | ||||||||||||||||||||||||||||
Real Estate and | |||||||||||||||||||||||||||||||||||||||
Business Services | |||||||||||||||||||||||||||||||||||||||
3.4 | Community, Social and | 3.2 | 9.8 | 5.0 | 5.8 | 6.5 | 5.4 | 6.2 | 5.6 | 5.7 | 5.7 | ||||||||||||||||||||||||||||
Personal Services | |||||||||||||||||||||||||||||||||||||||
4. | Gross Domestic Product at factor cost | 5.4 | 6.2 | 3.4 | 1.5 | 3.5 | 5.3 | 6.2 | 6.4 | 6.0 | 5.8 | ||||||||||||||||||||||||||||
Source : | Central Statistical Organisation. | ||||||||||||||||||||||||||||||||||||||
Saving and Investment
2.12 The rate of gross domestic saving improved marginally to 24.0 per cent in 2001-02 from 23.4 per cent in 2000-01, mainly on account of an increase in the rate of household saving. This reflected increased holdings of both financial and physical assets by households. The rate of saving of the private corporate sector declined marginally in 2001-02. The rate of public sector dis-saving deteriorated further to 2.5 per cent in 2001-02 from 2.3 per cent in 2000-01 and 0.9 per cent in 1999-2000 (Chart II.4 and Table 2.4).
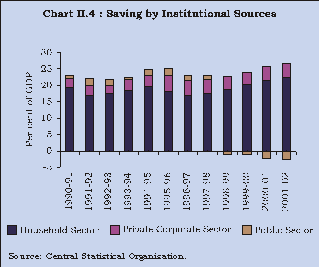
Table 2.4 : Gross Domestic Saving and Investment | |||||||||||||||||||||||||||||||||||||||
Variable | Per cent of GDP | ||||||||||||||||||||||||||||||||||||||
(at current market prices) | |||||||||||||||||||||||||||||||||||||||
1998-99 | 1999-2000 | 2000-01@ | 2001-02* | ||||||||||||||||||||||||||||||||||||
1 | 2 | 3 | 4 | ||||||||||||||||||||||||||||||||||||
1. | Household Saving | 18.9 | 20.3 | 21.6 | 22.5 | ||||||||||||||||||||||||||||||||||
1.1. | Financial Assets | 10.5 | 10.8 | 10.4 | 11.2 | ||||||||||||||||||||||||||||||||||
1.2. | Physical Assets | 8.4 | 9.6 | 11.2 | 11.3 | ||||||||||||||||||||||||||||||||||
2. | Private corporate sector | 3.7 | 3.7 | 4.1 | 4.0 | ||||||||||||||||||||||||||||||||||
3. | Public sector | -1.0 | -0.9 | -2.3 | -2.5 | ||||||||||||||||||||||||||||||||||
4. | Gross Domestic | 21.7 | 23.2 | 23.4 | 24.0 | ||||||||||||||||||||||||||||||||||
Saving (GDS) (1+2+3) | |||||||||||||||||||||||||||||||||||||||
5. | Saving-Investment Gap | -1.0 | -1.1 | -0.6 | 0.2 | ||||||||||||||||||||||||||||||||||
6. | Gross Domestic Capital | 22.7 | 24.3 | 24.0 | 23.7 | ||||||||||||||||||||||||||||||||||
Formation (GDCF) # | |||||||||||||||||||||||||||||||||||||||
7. | Gross Capital | 21.4 | 23.3 | 22.5 | 22.4 | ||||||||||||||||||||||||||||||||||
Formation (8+9+10) | |||||||||||||||||||||||||||||||||||||||
8. | Public sector | 6.6 | 7.1 | 6.4 | 6.3 | ||||||||||||||||||||||||||||||||||
9. | Private corporate sector | 6.4 | 6.5 | 4.9 | 4.8 | ||||||||||||||||||||||||||||||||||
10. | Household sector | 8.4 | 9.6 | 11.2 | 11.3 | ||||||||||||||||||||||||||||||||||
# | Adjusted for errors and omissions. | ||||||||||||||||||||||||||||||||||||||
@ | Provisional Estimates. | ||||||||||||||||||||||||||||||||||||||
* | Quick Estimates. | ||||||||||||||||||||||||||||||||||||||
Source : | Central Statistical Organisation. | ||||||
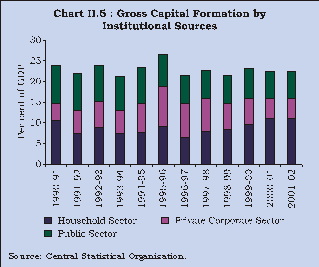
2.13 The investment rate declined to 23.7 per cent in 2001-02 from 24.0 per cent in 2000-01. As a result, the overall saving-investment gap recorded a surplus at 0.2 per cent of GDP in 2001-02 from (-) 0.6 per cent of GDP in 2000-01 (Table 2.4). In line with the trend observed during the second half of the 1990s, the rate of capital formation in the private corporate sector declined further in 2001-02 (Chart II.5).
Agriculture
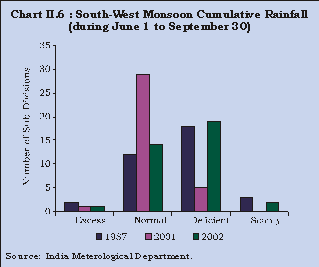
2.14 The prospects for Indian agriculture were adversely affected by deficient monsoons after 13 continuous years of normal rainfall, reflecting the continued rain-dependency of Indian agriculture. The country, as a whole, received about 81 per cent of the long period average (LPA) rainfall during the SouthWest monsoon season in 2002 as compared with 90 per cent in 2001. As a result, 21 meteorological subdivisions out of 36 received either deficient or scanty rainfall in comparison with 5 sub-divisions in the previous monsoon. According to the India Meteorological Department (IMD), the shortfall in rainfall during the 2002 South-West monsoon season led to drought in as much as 29 per cent of the land with 19 per cent being declared as moderate drought and 10 per cent as severe drought areas. Furthermore, the scale and intensity of the drought in 2002 has been comparable with that in 1987-88 when 21 sub-divisions received deficient/scanty rainfall and 14 sub-divisions received excess/normal rainfall (Chart II.6).

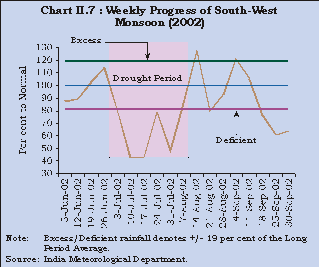
2.15 The impact of deficient rainfall was the most acute during July 2002, when the deviation of the actual from the normal crossed 60 per cent for 2-3 weeks, adversely affecting the sowing and agricultural production (Chart II.7). There was, however, a turnaround during August and September 2002 with some rains, which provided respite from the moisture stress for late sown crops. Besides, it also replenished water in the reservoirs. Of the 70 reservoirs monitored by the Central Water Commission, while as many as 51 reservoirs recorded storage below or up to 30 per cent of the Full Reservoir Level (FRL) by end-July, the number fell to 19 by end-September 2002.
2.16 As a result of drought conditions, the real GDP originating from ‘agriculture and allied activities’ is estimated to have declined by 3.1 per cent in 2002-03 in contrast to a rise of 5.7 per cent in 2001-02. Quarterly estimates indicate a growth rate of 4.4 per cent and zero per cent in the first and second quarters of 2002-03, respectively, over the corresponding quarters of 2001-02. The damage to agricultural production was, however, controlled to some extent on account of the implementation of a contingency plan for crop production (Box II.1).
Box II.1
|
Kharif 2002
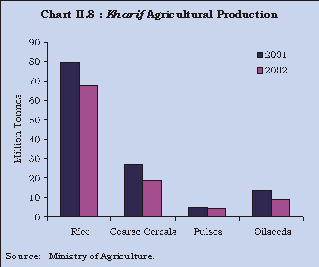
2.17 The Second Advance Estimates of Agricultural Production by the Union Ministry of Agriculture placed kharif foodgrains production in 2002 at 90.3 million tonnes indicating a fall of 21.3 million tonnes from the level attained in kharif 2001 (Table 2.5). Further, there has been a slippage in production performance in kharif 2002 vis-a-vis the targets as well (Chart II.8).
Table 2.5 : Season-wise Agricultural Production | |||||||||||||||||||||||||||||||||||||||
(Million Tonnes) | |||||||||||||||||||||||||||||||||||||||
Kharif | Rabi | ||||||||||||||||||||||||||||||||||||||
Crop | 2001-2002 | 2002-2003 | 2001-2002 | 2002-2003 | |||||||||||||||||||||||||||||||||||
A | T | A.E. | A | T | A.E. | ||||||||||||||||||||||||||||||||||
1 | 2 | 3 | 4 | 5 | 6 | ||||||||||||||||||||||||||||||||||
Rice | 79.76 | 78.64 | 67.41 | 13.32 | 14.36 | 10.31 | |||||||||||||||||||||||||||||||||
Wheat | N.A | N.A | N.A | 71.81 | 78.00 | 68.89 | |||||||||||||||||||||||||||||||||
Coarse cereals | 26.93 | 25.84 | 18.86 | 7.02 | 7.16 | 6.24 | |||||||||||||||||||||||||||||||||
Pulses | 4.87 | 6.00 | 3.99 | 8.32 | 10.00 | 7.47 | |||||||||||||||||||||||||||||||||
Total Foodgrains | 111.56 | 110.48 | 90.26 | 100.47 | 109.52 | 92.91 | |||||||||||||||||||||||||||||||||
Oilseeds | 12.90 | 15.90 | 8.45 | 7.53 | 11.10 | 6.99 | |||||||||||||||||||||||||||||||||
Sugarcane | 300.10 | 320.00 | 285.36 | N.A | N.A | N.A | |||||||||||||||||||||||||||||||||
Cotton* | 10.09 | 15.00 | 8.94 | N.A | N.A | N.A | |||||||||||||||||||||||||||||||||
Jute & Mesta $ | 11.64 | 12.00 | 11.50 | N.A | N.A | N.A | |||||||||||||||||||||||||||||||||
T. | Target | A | Achievement. | ||||||||||||||||||||||||||||||||||||
AE | Advance Estimates as on February 10, 2003. | * | In million bales of 170 kilograms each. | ||||||||||||||||||||||||||||||||||||
** | In million bales of 180 kilograms each. | ||||||||||||||||||||||||||||||||||||||
Source : | Ministry of Agriculture, Government of India. | |||||||||
2.18 The progress of the North-East monsoon season (October-December 2002) has also been below the last year’s levels. The cumulative rainfall was excess to normal in 10 subdivisions and deficient/ scanty in the remaining 26 sub-divisions (Chart II.9).
Rabi 2002-03
2.19 According to the Second Advance Estimates of Agricultural Production, rabi foodgrains production in 2002-03 is projected to decline by 7.6 million tonnes to 92.9 million tonnes as compared with 100.5 million tonnes in the previous year (Table 2.5). The decline is more for rice than in wheat.
2.20 The overall performance of agriculture production has been affected adversely by the severe drought in 2002. Production of foodgrains in 2002-03 is estimated to decline sharply to 183.2 million tonnes from the record production of 212.0 million tonnes in the previous year (Table 2.6). The wholesale price index of foodgrains, in general, and that of cereals, in particular, remained stable during the post-South-West monsoon season, which was affected by drought. This trend notwithstanding, the severe weather aberrations and its adverse impact on production, reflects the comfortable availability of foodgrains.
Table 2.6 : Crop-wise Targets/Achievements | |||||||||||||||||||||||||||||||||||||||
(Million Tonnes) | |||||||||||||||||||||||||||||||||||||||
Crop | 2000-01 | 2001-02 | 2002-03 | ||||||||||||||||||||||||||||||||||||
T | A | T | A | T | AE | ||||||||||||||||||||||||||||||||||
1 | 2 | 3 | 4 | 5 | 6 | ||||||||||||||||||||||||||||||||||
Rice | 90.00 | 87.70 | 92.00 | 93.08 | 93.00 | 77.72 | |||||||||||||||||||||||||||||||||
Wheat | 74.00 | 69.68 | 78.00 | 71.81 | 78.00 | 68.89 | |||||||||||||||||||||||||||||||||
Coarse Cereals | 33.00 | 31.08 | 33.00 | 33.94 | 33.00 | 25.10 | |||||||||||||||||||||||||||||||||
Pulses | 15.00 | 10.87 | 15.00 | 13.19 | 16.00 | 11.46 | |||||||||||||||||||||||||||||||||
Total Foodgrains | 212.00 | 199.33 | 218.00 | 212.02 | 220.00 | 183.17 | |||||||||||||||||||||||||||||||||
Nine Oilseeds | 28.00 | 18.44 | 28.00 | 20.73 | 27.00 | 15.44 | |||||||||||||||||||||||||||||||||
Sugarcane | 325.00 | 295.96 | 325.00 | 292.21 | 320.00 | 285.36 | |||||||||||||||||||||||||||||||||
Cotton* | 14.50 | 9.52 | 14.50 | 11.69 | 15.00 | 8.94 | |||||||||||||||||||||||||||||||||
Jute & Mesta** | 10.00 | 10.56 | 11.00 | 10.79 | 12.00 | 11.50 | |||||||||||||||||||||||||||||||||
T. | Target | A | Achievement. | ||||||||||||||||||||||||||||||||||||
AE | Advance Estimates as on February 10, 2003. | * | In million bales of 170 kilograms each. | ||||||||||||||||||||||||||||||||||||
** | In million bales of 180 kilograms each. | ||||||||||||||||||||||||||||||||||||||
Source : | Ministry of Agriculture, Government of India. | |||||||||
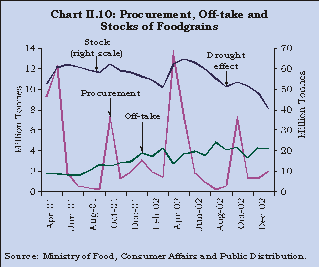
Procurement, Off-take and Stock of Foodgrains
2.21 Despite a sharp fall in production by 28.9 million tonnes, the procurement of foodgrains during 2002-03 (up to February 28, 2003) declined only by 3.2 million tonnes to 37.1 million tonnes as compared with 40.3 million tonnes for the corresponding period of the previous year. The off-take, on the other hand, rose to 39.0 million tonnes during 2002-03 (up to January 2003) as compared with 23.5 million tonnes in the corresponding period last year. This pick up mainly reflected increased off-take under Other Welfare Schemes (OWS) followed by Open Market Sales (OMS), exports and Targeted Public Distribution System (TPDS). The off-take under TPDS rose following a downward revision of the Central Issue Prices (CIP) for the Above Poverty Line (APL) consumers. The higher off-take under other welfare schemes is attributed to the higher allocation made under various programmes, such as Annapurna and the Food for Work Programme, as part of the drought relief measures. Consequent to the increased offtake, foodgrains stock registered a significant decline to 40.1 million tonnes as at end-January 2003 from the peak of 64.8 million tonnes in May 2002. At this level, the stocks are a little less than two and a half times the end-December norm of 16.8 million tonnes (Chart II.10).

Industry
2.22 The recovery of industrial activity during 2002-03 augurs well for the overall growth and investment climate in India despite the hesitant recovery abroad. The industrial sector is estimated to have recovered to 5.8 per cent in 2002-03 from 3.2 per cent in the previous year. The industrial recovery was witnessed in all the constituent sub-sectors, particularly the manufacturing sector, which rose by 6.1 per cent in 2002-03 from 3.4 per cent in 2001-02 (Chart II.11).
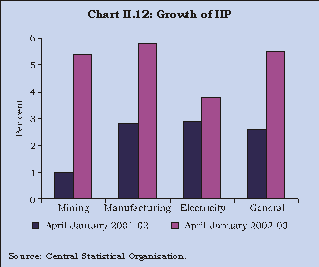
2.23 The index of industrial production (IIP) accelerated to 5.5 per cent during 2002-03 (up to January 2003) from 2.6 per cent recorded during the comparable period of the previous year. All the sub-sectors recorded a higher growth during 2002-03 (up to January) as compared with the corresponding period of 2001-02 (Chart II.12 and Table 2.7).
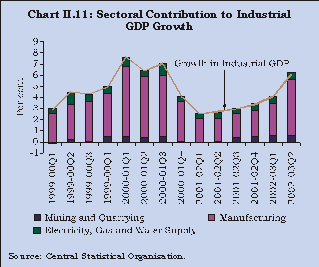
Table 2.7 : Sector-wise Growth of IIP | |||||||||||||||||||||||||||||||||||||||
(Per cent) | |||||||||||||||||||||||||||||||||||||||
Month | General | Electricity | Mining & Quarrying | Manufacturing | |||||||||||||||||||||||||||||||||||
(100.00) | (10.17) | (10.47) | (79.36) | ||||||||||||||||||||||||||||||||||||
2001-02 | 2002-03 | 2001-02 | 2002-03 | 2001-02 | 2002-03 | 2001-02 | 2002-03 | ||||||||||||||||||||||||||||||||
1 | 2 | 3 | 4 | 5 | 6 | 7 | 8 | ||||||||||||||||||||||||||||||||
April | 2.5 | 4.1 | 1.5 | 5.2 | 1.6 | 3.6 | 2.7 | 4.0 | |||||||||||||||||||||||||||||||
May | 1.6 | 4.1 | 3.0 | 2.2 | -1.9 | 7.9 | 1.8 | 4.0 | |||||||||||||||||||||||||||||||
June | 2.6 | 4.5 | 2.1 | 3.8 | -4.1 | 9.0 | 3.4 | 4.2 | |||||||||||||||||||||||||||||||
July | 2.6 | 7.1 | 4.7 | 6.1 | -2.6 | 12.1 | 2.9 | 6.7 | |||||||||||||||||||||||||||||||
August | 3.0 | 6.2 | 2.7 | 4.1 | 0.6 | 5.7 | 3.3 | 6.5 | |||||||||||||||||||||||||||||||
September | 2.0 | 6.2 | 4.6 | -0.4 | 4.4 | 1.0 | 1.4 | 7.6 | |||||||||||||||||||||||||||||||
October | 3.2 | 7.0 | -0.2 | 7.1 | 3.8 | 4.2 | 3.5 | 7.3 | |||||||||||||||||||||||||||||||
November | 2.4 | 3.7 | 2.4 | 3.5 | 3.7 | 3.4 | 2.3 | 3.8 | |||||||||||||||||||||||||||||||
December | 3.0 | 5.7 | 4.2 | 2.8 | 1.8 | 5.5 | 3.0 | 6.1 | |||||||||||||||||||||||||||||||
January | 3.8 | 6.4 | 4.0 | 4.0 | 2.3 | 2.7 | 4.1 | 6.9 | |||||||||||||||||||||||||||||||
April -January | 2.6 | 5.5 | 2.9 | 3.8 | 1.0 | 5.4 | 2.8 | 5.8 | |||||||||||||||||||||||||||||||
Notes : | 1. | Data for 2002-03 are provisional. | |||||||||||||||||||||||||||||||||||||
2. | Figures in bracket are weights in IIP. | ||||||||||||||||||||||||||||||||||||||
Source : | Central Statistical Organisation. | ||||||||||||||||||||||||||||||||||||||
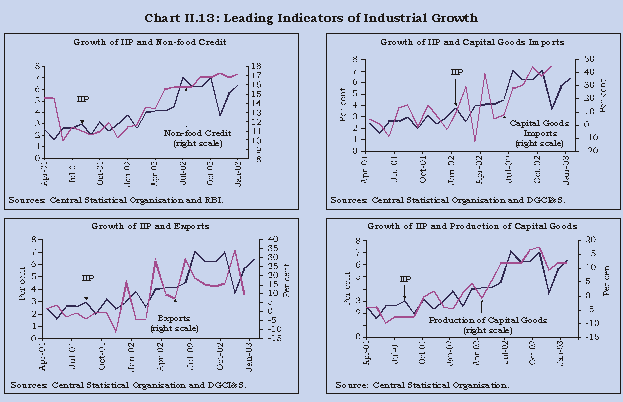
2.24 The incipient industrial recovery during 2002-03 essentially emanated from a confluence of favourable impulses, which are both macroeconomic and industry-specific. The revival of industrial activity, therefore, could be partly attributed to a revival of export demand, rising business confidence, softening of interest rates and a slight increase in manufacturing inflation. Besides, the sharp expansion in construction activity also had a favourable impact on industrial demand through its backward linkages, e.g., cement and steel industries, and forward linkages. Moreover, consumer non-durables have emerged as a source of growth for industry suggesting a revival of consumer demand. The leading indicators of industrial production such as non-food credit off-take, exports, capital goods imports and production of capital goods, have all recorded increases, suggesting that the revival of industrial activity is likely to be sustained during the year (Chart II.13). However, there is also a possibility that the delayed monsoon and its subsequent impact on agricultural production could dampen the rural demand for both durable and non-durable consumer goods.
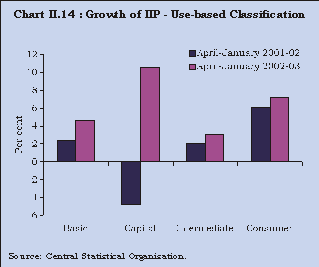
2.25 According to the use-based classification, all the sectors except consumer durables showed an accelerated growth (Chart II.14). Significantly, the capital goods sector registered a positive growth of 10.6 per cent during 2002-03 (up to January 2003).
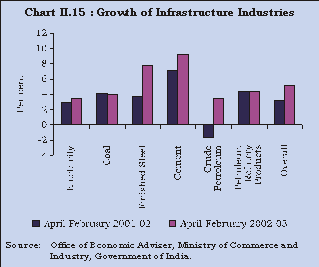
2.26 During 2002-03 (up to February 2003), the overall growth of infrastructure industries worked out substantially higher at 5.2 per cent as compared with a growth of 3.2 per cent during the corresponding period of the previous year (Chart II.15). All infrastructure industries except coal and petroleum refining products recorded a higher growth during 2002-03 (up to February 2003).
Services Sector
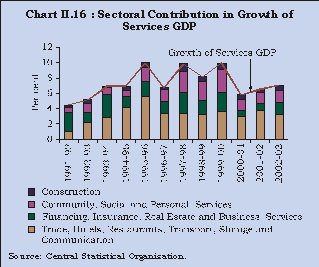
2.27 The buoyancy in the services sector continued to strengthen during 2002-03 as it is expected to grow by 7.1 per cent as against 6.5 per cent in 2001-02 and 5.8 per cent in 2000-01. Among the sub-sectors of services, only the growth rate in ‘trade, hotels, restaurants, transport and communication’ would be lower at 7.8 per cent during 2002-03 as compared with 8.7 per cent in the preceding year. Despite the lower growth rate, ‘trade, hotels, restaurants, transport and communication’ with a maximum share in the services GDP, would contribute 3.3 percentage points (46.5 per cent) in the overall growth rate of 7.1 per cent in services GDP during 2002-03 (Table 2.8 and Chart II.16).
Table 2.8 : Growth in Services Sector | |||||||||||||||||||||||||||||||||||||||
(Per cent) | |||||||||||||||||||||||||||||||||||||||
Sector | 2001-02 | 2002-03 | |||||||||||||||||||||||||||||||||||||
1 | 2 | ||||||||||||||||||||||||||||||||||||||
Construction | 3.7 | 7.1 | |||||||||||||||||||||||||||||||||||||
(0.4) | (0.7) | ||||||||||||||||||||||||||||||||||||||
Trade, Hotels, Restaurants, | 8.7 | 7.8 | |||||||||||||||||||||||||||||||||||||
Transport and Communication | (3.7) | (3.3) | |||||||||||||||||||||||||||||||||||||
Financing, Insurance, | 4.5 | 6.5 | |||||||||||||||||||||||||||||||||||||
Real Estate and Business Services | (1.0) | (1.5) | |||||||||||||||||||||||||||||||||||||
Community, Social and | 5.6 | 6.4 | |||||||||||||||||||||||||||||||||||||
Personal Services | (1.4) | (1.6) | |||||||||||||||||||||||||||||||||||||
Services Sector Growth | 6.5 | 7.1 | |||||||||||||||||||||||||||||||||||||
Note | : | Figures in bracket represent contribution to services growth rate in terms of percentage points. | |||||||||||||||||||||||||||||||||||||
Source | : | Central Statistical Organisation. | |||||||||||||||||||||||||||||||||||||
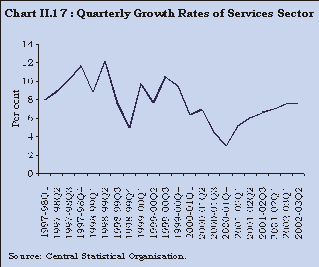
2.28 The quarterly estimates of GDP also indicate that the services sector with a growth at 7.5 per cent and 7.6 per cent, respectively, in the first and second quarters of 2002-03 is sustaining the GDP growth rate (Chart II.17). The growth rates of almost all the components of services are higher during the first two quarters of 2002-03 over the corresponding quarters of 2001-02.
2.29 Of late, the information technology (IT) and software services have emerged as one of the most dynamic service-providing sub-sectors in the services sector, with an annual average growth rate of 50.0 per cent during the second half of the 1990s. Reflective of this, the share of IT and software services increased to 2.9 per cent of GDP in 2001-02 from 2.8 per cent in 2000-01, with revenue earnings rising to Rs.48,000 crore in 2001-02 from Rs.37,760 crore in 2000-01. Exports have emerged as the major driver of the IT and software sector, accounting for 76.7 per cent of the total revenue earned in the sector during 2001-02.
2.30 The issue of fiscal consolidation continues to be at the centre of public finances, with a commitment to fiscal adjustment at both the Central and State levels. The budgets for fiscal year 2002-03 placed the combined GFD of the Centre and States at 9.5 per cent of the GDP lower than 10.3 per cent in the revised estimates for 2001-02. The combined gross primary deficit and revenue deficit were also placed lower at 3.1 per cent and 6.2 per cent of GDP, respectively, as compared with 4.0 per cent and 7.0 per cent in the revised estimates for 2001-02. The reduction in the deficits was sought to be achieved through higher revenue mobilisation and moderation in aggregate expenditure.
Central Government Finances
2.31 The Union Budget for 2002-03 envisaged ongoing fiscal consolidation, higher growth in revenue collections, enhanced realisation from disinvestment and compression in the growth of aggregate expenditure. All the fiscal deficit indicators were budgeted at lower levels than the previous year’s levels. The GFD, revenue deficit, and primary deficit were placed at 5.3 per cent, 3.8 per cent, and 0.7 per cent of GDP, respectively. The process of fiscal consolidation was envisaged through maintaining a higher growth in revenue (15.3 per cent) and a relatively moderate growth in aggregate expenditure (12.6 per cent). In the revised estimates for 2002-03, all the key deficit indicators were placed higher than their budgeted levels (Table 2.9). The deterioration witnessed in the revised estimates vis-à-vis budgeted levels, despite a decline in the overall expenditure, was mainly due to a larger shortfall in the realisation of revenue as well as disinvestment receipts.
Table 2.9 : Deficit Indicators of the Centre | |||||||||||||||||||||||||||||||||||||||
(Rupees crore) | |||||||||||||||||||||||||||||||||||||||
Indicator | 2001-02 | 2002-03(BE) | 2002-03(RE) | 2003-04(BE) | Variation (3 over 2) | ||||||||||||||||||||||||||||||||||
Rupees Crore | Per cent | ||||||||||||||||||||||||||||||||||||||
1 | 2 | 3 | 4 | 5 | 6 | ||||||||||||||||||||||||||||||||||
Gross Fiscal Deficit | 1,40,955 | 1,35,524 | 1,45,466 | 1,53,637 | 9,942 | 7.3 | |||||||||||||||||||||||||||||||||
(6.1) | (5.3) | (5.9) | (5.6) | ||||||||||||||||||||||||||||||||||||
Revenue Deficit | 1,00,162 | 95,377 | 1,04,712 | 1,12,292 | 9,335 | 9.8 | |||||||||||||||||||||||||||||||||
(4.3) | (3.8) | (4.3) | (4.1) | ||||||||||||||||||||||||||||||||||||
Gross Primary Deficit | 33,495 | 18,134 | 29,803 | 30,414 | 11,669 | 64.3 | |||||||||||||||||||||||||||||||||
(1.5) | (0.7) | (1.2) | (1.1) | ||||||||||||||||||||||||||||||||||||
Note : Figures in bracket represent per cent to GDP. | |||||||||||||||||||||||||||||||||||||||
2.32 Revenue receipts declined by 3.3 per cent in the revised estimates for 2002-03 over the budgeted level due to a shortfall of 5.1 per cent in tax collection, while non-tax revenue registered a marginal increase over the budget estimates (Table 2.10). The gross tax collections were lower (5.9 per cent) than the budget estimates. Barring customs duties, all the major taxes suffered a decline over the budget estimates. On the capital receipts side, disinvestment receipts, in the revised estimates, were lower by Rs. 8,640 crore than the budgeted target of Rs.12,000 crore. Non-debt capital receipts (disinvestment and recoveries) accounted for 12.9 per cent of the capital receipts while the rest was contributed by debt receipts.
Table 2.10 : Total Receipts and Aggregate Expenditure of the Centre | |||||||||||||||||||||||||||||||||||||||
(Rupees crore) | |||||||||||||||||||||||||||||||||||||||
Indicator | 2001-02 | 2002-03 (BE) | 2002-03 (RE) | 2003-04 (BE) | Variation (3 over 2) | ||||||||||||||||||||||||||||||||||
| Rupees crore | Per cent | ||||||||||||||||||||||||||||||||||||||
1 | 2 | 3 | 4 | 5 | 6 | ||||||||||||||||||||||||||||||||||
Total Receipts | 3,62,453 | 4,10,309 | 4,04,013 | 4,38,795 | -6,296 | -1.5 | |||||||||||||||||||||||||||||||||
(15.8) | (16.0) | (16.4) | (16.0) | ||||||||||||||||||||||||||||||||||||
Revenue Receipts | 2,01,449 | 2,45,105 | 2,36,936 | 2,53,935 | -8,169 | -3.3 | |||||||||||||||||||||||||||||||||
(8.8) | (9.6) | (9.6) | (9.3) | ||||||||||||||||||||||||||||||||||||
Tax Revenue (Net) | 1,33,662 | 1,72,965 | 1,64,177 | 1,84,169 | -8,788 | -5.1 | |||||||||||||||||||||||||||||||||
(5.8) | (6.8) | (6.7) | (6.7) | ||||||||||||||||||||||||||||||||||||
Non-Tax Revenue | 67,787 | 72,140 | 72,759 | 69,766 | 619 | 0.9 | |||||||||||||||||||||||||||||||||
(3.0) | (2.8) | (3.0) | (2.5) | ||||||||||||||||||||||||||||||||||||
Capital Receipts | 1,61,004 | 1,65,204 | 1,67,077 | 1,84,860 | 1,873 | 1.1 | |||||||||||||||||||||||||||||||||
(7.0) | (6.5) | (6.8) | (6.7) | ||||||||||||||||||||||||||||||||||||
Total Expenditure | 3,62,453 | 4,10,309 | 4,04,013 | 4,38,795 | -6,296 | -1.5 | |||||||||||||||||||||||||||||||||
(1+2=3+4) | (15.8) | (16.0) | (16.4) | (16.0) | |||||||||||||||||||||||||||||||||||
1. Non-Plan Expenditure | 2,61,259 | 2,96,809 | 2,89,924 | 3,17,821 | -6,885 | -2.3 | |||||||||||||||||||||||||||||||||
(11.4) | (11.6) | (11.8) | (11.6) | ||||||||||||||||||||||||||||||||||||
2. Plan Expenditure | 1,01,194 | 1,13,500 | 1,14,089 | 1,20,974 | 589 | 0.5 | |||||||||||||||||||||||||||||||||
(4.4) | (4.4) | (4.6) | (4.4) | ||||||||||||||||||||||||||||||||||||
3. Revenue Expenditure | 3,01,611 | 3,40,482 | 3,41,648 | 3,66,227 | 1,166 | 0.3 | |||||||||||||||||||||||||||||||||
(13.1) | (13.3) | (13.9) | (13.3) | ||||||||||||||||||||||||||||||||||||
4. Capital Expenditure | 60,842 | 69,827 | 62,365 | 72,568 | -7,462 | -10.7 | |||||||||||||||||||||||||||||||||
(2.6) | (2.7) | (2.5) | (2.6) | ||||||||||||||||||||||||||||||||||||
Note : Figures in bracket are per cent to GDP. | |||||||||||||||||||||||||||||||||||||||
2.33 The aggregate expenditure in the revised estimates for 2002-03 was lower by 1.5 per cent from the budget estimates. The expenditure reduction was solely in the non-Plan expenditure while the Plan expenditure showed a marginal rise. The reduction in the non-Plan expenditure was on account of reduced grants and loans to States and Union Territories (UTs) due to non-utilisation of funds under the Fiscal Incentive Fund (Rs.2,184 crore), defence (Rs.9,000 crore) on account of lower capital expenditure, interest payments (Rs.1,727 crore) due to reductions in interest rates on Government securities and pensions (Rs.804 crore). However, the expenditure on subsidies increased by Rs.4,817 crore over the budget estimates with almost 83 per cent of the rise accounted for by food and indigenous fertiliser subsidies.
Union Budget for 2003-04
2.34 The Union Budget for 2003-04 accorded priority to fiscal consolidation and debt restructuring as it is essential for sustainable growth. The fiscal policy measures proposed in the Union Budget underscore the Government’s commitment to totally eliminate budgetary drags and achieve fiscal consolidation through revenue enhancement under a modern tax administration and expenditure rationalisation. An important element in tax reforms is the switching over to a Value Added Tax (VAT) by States with effect from April 1, 2003; others include strengthening of tax administration through greater application of IT and rationalisation of the tax structure with a view to improving the competitiveness of Indian industry in international markets. The expenditure management envisaged in the Union Budget mainly focuses on better cash management and debt restructuring taking advantage of comfortable foreign exchange reserves and lower domestic interest rates. As part of debt restructuring, a buy back of a large proportion of the banks’ holding of Central Government domestic debt contracted under the high interest regime is expected to improve banks’ balance sheets. The Government’s objective towards fiscal consolidation is, thus, endeavoured through expenditure reprioritisation and revenue augmentation.
2.35 The Union Budget for 2003-04 projects moderate growth rates of 7.2 per cent in revenue receipts and 8.6 per cent in aggregate expenditure. With a relatively higher growth in expenditure, all the major deficit indicators would show increases in absolute terms during 2003-04 from the levels in the revised estimates for 2002-03. However, in terms of GDP, all the deficit indicators would be lower during 2003-04 than the levels in the revised estimates for 2002-03. As proportion of GDP, the GFD for 2003-04 is placed lower at 5.6 per cent than 5.9 per cent in the revised estimates for 2002-03.
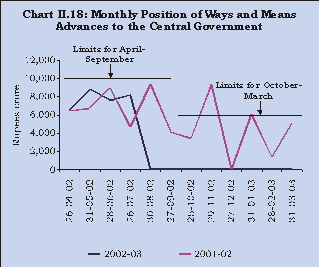
2.36 The Centre’s ways and means advances (WMA) from the Reserve Bank for the first and second halves of 2002-03 were fixed at Rs.10,000 crore (April-September) and Rs.6,000 crore (October-March), the same as in the previous year. The average utilisation of WMA, at Rs 4,433 crore during 2002-03 (up to March 14, 2003), was lower than the previous year’s level. The net Reserve Bank credit to the Centre declined by Rs.24,098 crore during 2002-03 (up to March 14, 2003) reflecting active open market operations by the Reserve Bank (Chart II.18).
2.37 The gross market borrowings of the Central Government were budgeted at Rs.1,42,867 crore and net market borrowings at Rs.95,859 crore for 2002-03. The outcome in the revised estimates for 2002-03 placed the net borrowings at Rs. 1,12,865 crore which exceeded the budget estimates by 17.7 per cent. For 2003-04, the gross and net market borrowings are budgeted at Rs. 1,66,230 crore and Rs.1,07,194 crore, respectively. Net market borrowings would finance 69.8 per cent of GFD during 2003-04 as against 77.6 per cent in the revised estimates for 2002-03. At the same time, financing through other liabilities would decline to 27.9 per cent from 28.0 per cent and external finance would contribute 2.3 per cent as against a negative share of 9.3 per cent during 2002-03 (Chart II.19).1
2.38 The Reserve Bank continued to combine auction issues with private placements of dated securities of the Central Government consistent with market conditions. Devolvements/ private placement with the Reserve Bank amounted to Rs.36,175 crore, representing 28.9 per cent of the gross market borrowings of the Centre through dated securities during 2002-03 (up to March 21, 2003). The weighted average maturity of the Government of India dated securities issued so far during 2002-03 declined to 13.83 years from 14.26 years for 2001-02 as a whole. At the same time, the cost of market borrowings of the Central Government continued to fall due to a benign inflation rate and ample liquidity conditions. The weighted average yield of GOI dated securities declined to 7.34 per cent during 2002-03 (up to March 21, 2003) from 9.44 per cent during 2001-02 reflecting the general softening of the interest rate structure. The bid-cover ratio of the primary issuance of dated securities ranged between 0.64-3.8 during the current year so far. The interest rate on the primary issue of 10-year government securities declined from 6.85 per cent on April 5, 2002 to 6.72 per cent on July 18, 2002. The yield on 15-year securities declined from 7.49 per cent on April 16, 2002 to 7.37 per cent on October 17, 2002. Similarly, the yield on 25-year primary bonds declined from 8.62 per cent on May 30, 2002 to 7.48 per cent on November 7, 2002.
State Finances
2.39 The finances of State Governments during 2002-03 are budgeted to record an improvement over the previous year. In the budget estimates for 2002-03, the revenue deficit, as a percentage of GDP, is budgeted lower at 1.9 per cent as compared with 2.6 per cent in the revised estimates for 2001-02. With the compression in the revenue deficit, the GFD as a percentage of GDP is budgeted to decline from 4.6 per cent in 2001-02(RE) to 4.0 per cent in 2002-03. The primary deficit is also budgeted lower at 1.2 per cent of GDP in 2002-03 than 1.8 per cent in the previous year.
2.40 During 2002-03, revenue receipts are budgeted to rise by 13.3 per cent. States’ own revenue receipts are expected to finance 53.6 per cent of revenue expenditure and 44.2 per cent of the aggregate expenditure (49.7 per cent and 41.0 per cent, respectively, in 2001-02). The total expenditure of States is budgeted to grow by 7.3 per cent, as compared with the growth rate of 15.7 per cent in the previous year.
2.41 The States have continued to emphasise fiscal consolidation in their budgets for 2002-03 through expenditure management, revenue augmentation and reforms in public sector undertaking. The proposed measures include enhancement of revenue receipts through a revision of tax rates, broadening of the tax base and improved tax compliance. On the expenditure front, a number of States propose to contain revenue expenditure through a set of economy measures such as restrictions on fresh recruitment/ creation of new posts and controlling administrative expenditure. Some States have initiated measures to provide statutory backing to the fiscal reform process through enabling legislations. While Karnataka has already enacted fiscal responsibility legislation, Maharashtra and Punjab introduced similar bills in their respective legislatures. The Kerala Government proposes to introduce a Fiscal Accountability Bill. Several States have already finalised their Medium-Term Fiscal Reforms Programme (MTFRP). A number of States have also focused on restructuring of public sector undertakings, development of infrastructure, including encouragement to private investment in the infrastructure projects and promotion of growth enhancing sectors like information technology and agro-based industries, consolidated sinking fund, guarantee redemption fund and statutory limits on guarantees.
2.42 The likely fiscal outturn of the State Governments during 2002-03 is not yet evident. During April-July 2002, the outstanding WMA was generally higher than those in the comparable period of the previous year. From August 2002, these have generally remained lower than the outstanding WMA in the comparable period of the previous year. The outstanding WMA and overdrafts of State Governments amounted to Rs.4,060 crore as on March 14, 2003 which was lower by 38.7 per cent as compared with the outstanding amount of Rs.6,622 crore on March 15, 2002 (Chart II.20).

2.43 The gross and net market borrowings allocated to States for 2002-03 (including additional allocation of Rs.10,000 crore under a debt-swap scheme) amounted to Rs.30,933 crore and Rs.29,144 crore, respectively. During 2002-03 (up to March 20, 2003), the States have raised Rs.30,853 crore. Of this, Rs.27,880 crore (90.4 per cent) was raised through tap-issues at interest rates ranging between 6.6-7.8 per cent and Rs.2,973 crore (9.6 per cent) through auctions at coupon rates ranging between 6.7 per cent and 8.0 per cent. The States that raised funds through the auction route were Andhra Pradesh (Rs.545 crore), Gujarat (Rs.445 crore), Jammu and Kashmir (Rs.70 crore), Karnataka (Rs.200 crore), Kerala (Rs.445 crore), Madhya Pradesh (Rs.247 crore), Maharashtra (Rs.509 crore), Punjab (Rs.85 crore), Tamil Nadu (Rs.275 crore) and West Bengal (Rs.153 crore). The range of coupon rates, at 6.6-8.0 per cent during 2002-03 so far, worked out substantially lower than that of 7.8-10.5 per cent during 2001-02 and 10.5-12.0 per cent during 2000-01 as well as 11.5 per cent in case of loans from the Centre (Plan loans) and 10.5 per cent for loans arising from small saving collections. The decline in the interest rate on States’ market borrowings reflected the general softening of interest rates. The coupon rate for the tap tranche held in August 2002 was fixed 50 basis points over the then prevailing yield of Government of India 10-year security. However, in the tranche conducted in December 2002, the spread was lower at 37 basis points over the then prevailing yield of a Government of India ten-year security.
2.44 The high order of borrowings by the Central and State Governments continue to raise concerns about the sustainability of the public debt. The combined debt-GDP ratio of the Centre and States increased to 70.0 per cent in the revised estimates for 2001-02 and is budgeted to rise further to 71.6 per cent in 2002-03.
2.45 The monetary policy stance of the Reserve Bank during 2002-03 continued to focus on the provision of adequate liquidity to meet credit growth and support investment demand in the economy with a policy preference for soft interest rates while continuing a vigil on movements in the price level. The Reserve Bank also reiterated its commitment to impart greater flexibility to the interest rate structure in the medium term. In April 2002, the monetary and credit policy for 2002-03 was framed on the basis of a real GDP growth rate of 6.0-6.5 per cent and a rate of inflation of slightly lower than 4.0 per cent under the assumption of a normal monsoon. Consistent with the macroeconomic objectives, indicative projections of M3 growth and aggregate deposit growth of scheduled commercial banks were placed at 14.0 per cent each, with non-food credit growth (inclusive of non-SLR investments) projected at about 15.0-15.5 per cent. The Mid-Term Review of Monetary and Credit Policy (October 2002) lowered the projection of real GDP growth to 5.0-5.5 per cent in view of the drought conditions in several parts of the country.
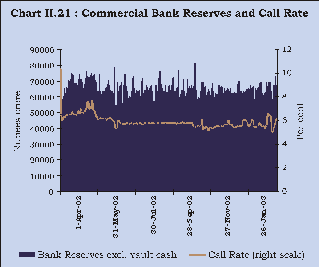
2.46 Monetary conditions remained stable during 2002-03. Notwithstanding a higher non-food credit off- take, easy liquidity conditions prevailed during the year on account of strong capital flows, CRR cuts and a decline in food credit. This enabled a smooth absorption of the Centre’s market borrowing as well as a softening of interest rates with varying sensitivity across the spectrum. The Reserve Bank continued to steer liquidity conditions by modulating market liquidity with an array of discretionary operations in the form of changes in reserve requirements, open market (including repo) operations and standing facilities, reinforced by interest rate signals, in the form of changes in the Bank Rate and the repo rate. In the backdrop of large and persistent capital inflows, the Reserve Bank absorbed excess liquidity through a policy mix of outright open market operations (OMO) sales and repos under the Liquidity Adjustment Facility (LAF) (Chart II.21 and Table 2.11). This enabled the Reserve Bank to contain primary money creation, on the one hand, and at the same time, ease interest rates by simultaneously cutting the price of discretionary liquidity, on the other.
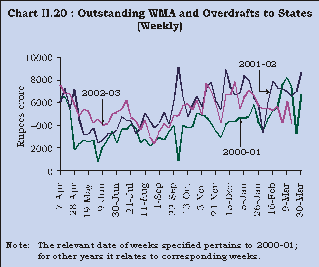
Table 2.11 : Reserve Bank’s Net Foreign Assets, Net Credit to Centre, Initial Subscriptions,Open Market Operations and LAF Repos : 2002-03 | |||||||||||||||||||||||||||||||||||||||
(Rupees crore) | |||||||||||||||||||||||||||||||||||||||
Month | RBI’s NFA | Net RBI | RBI’s Initial | RBI’s Net | Average Daily | ||||||||||||||||||||||||||||||||||
(net of | Credit to | Subscription | OMO Sales | Repo (LAF) | |||||||||||||||||||||||||||||||||||
revaluation) | Central | Outstanding | |||||||||||||||||||||||||||||||||||||
Government | |||||||||||||||||||||||||||||||||||||||
1 | 2 | 3 | 4 | 5 | |||||||||||||||||||||||||||||||||||
April | 3,076 | 11,976 | 0 | 5,307 | 8,119 | ||||||||||||||||||||||||||||||||||
May | 2,394 | 1,838 | 20,018 | 1,524 | 1,924 | ||||||||||||||||||||||||||||||||||
June | 3,739 | -12,359 | 2,000 | 189 | 9,640 | ||||||||||||||||||||||||||||||||||
July | 9,160 | 8,122 | 1,157 | 6,538 | 14,636 | ||||||||||||||||||||||||||||||||||
August | 7,370 | -19,083 | 0 | 7,025 | 11,825 | ||||||||||||||||||||||||||||||||||
September | 5,983 | -8,593 | 0 | 6,355 | 12,181 | ||||||||||||||||||||||||||||||||||
October | 8,350 | -8,075 | 0 | 71 | 14,656 | ||||||||||||||||||||||||||||||||||
November | 11,791 | -1,191 | 0 | 11,070 | 8,141 | ||||||||||||||||||||||||||||||||||
December | 11,297 | -8,616 | 0 | 4,552 | 6,855 | ||||||||||||||||||||||||||||||||||
January | 9,375 | -3,288 | 0 | 10,995 | 5,018 | ||||||||||||||||||||||||||||||||||
February | 11,062 | -6,206 | 0 | 88 | 3,786 | ||||||||||||||||||||||||||||||||||
Note : | Based on data pertaining to the last reporting Friday of the month. | ||||||||||||||||||||||||||||||||||||||
2.47 During 2002-03, monetary conditions remained easy facilitated by stable foreign exchange market conditions leading to a favourable interest rate environment conducive to investment. A temporary tightening of liquidity resulting from pressures of the government borrowing programme, seasonal cash demand and a revival of credit off-taken in end-May 2002 was mitigated by a policy mix of private placements and a CRR cut of 50 basis points effective fortnight beginning June 1, 2002. As call rates softened in response, the repo rate was cut by 25 basis points on June 27, 2002. This was reinforced by a further cut of 25 basis points each in the Bank Rate (to 6.25 per cent, the lowest since 1973), the repo rate (both effective October 30, 2002) and the CRR (effective November 16, 2002) as announced in the Mid-Term Review of Monetary and Credit Policy. At the same time, the Mid-Term Review stated that no useful purpose would be served by a further reduction in the Bank Rate in view of the prevailing easy liquidity conditions and the structural downward stickiness in interest rates, and the policy bias would be to keep it stable at least until the end of the financial year. The repo rate was cut by 50 basis points to 5.0 per cent by March 2003.
2.48 In order to tackle the problem of downward rigidities in the interest rate structure, the Reserve Bank encouraged banks to introduce a flexible interest rate system (together with the fixed rate option) for all fresh deposits. To increase the interest rate flexibility, banks were advised to review both their prime lending rates (PLRs) and spreads. The Reserve Bank initiated the process of deregulation of ceiling rates on export credit in rupee terms in a phased manner to encourage greater competition among banks and to extend such credit at lower rates to exporters with good track records.
2.49 The Liquidity Adjustment Facility (LAF) emerged as the principal operating instrument of monetary policy to adjust liquidity on a day-to-day basis as well as transmit interest rate signals especially through periodic fixed rate auctions during the year. Since the LAF was able to provide an effective cushion to the market and with a view to phasing out sector-specific standing facilities, other windows of liquidity support continued to be gradually withdrawn. The collateralised lending facility (CLF), for instance, was phased out effective October 5, 2002. In case of export credit refinance, which is now the only remaining standing facility, the apportionment of normal (at a rate linked to the Bank Rate) and backstop (at a rate linked to LAF operations or NSE-MIBOR) facilities was changed to one-half each effective November 16, 2002, from the earlier ratio of two-third and one-third.
2.50 The Reserve Bank continued with structural reforms with the objective of widening and deepening the financial markets. Non-bank participants are being gradually phased out of the call/notice money markets which is expected to facilitate the development of other segments, such as the repo market and the term-money market. Besides, with effect from November 16, 2002, banks were required to maintain a minimum of 80 per cent of the required CRR balances on a daily basis as against the earlier requirement of a minimum daily maintenance of 50 per cent of required CRR balances during the first week and 65 per cent during the second week of the reporting fortnight. Subsequently, with effect from December 28, 2002, the required minimum daily CRR balance was brought down to 70 per cent.
Reserve Money
2.51 Reserve money increased by 7.5 per cent during 2002-03 (up to March 14, 2003) as compared with 8.8 per cent during the corresponding period of last year, notwithstanding the steady accretion to the Reserve Bank’s foreign currency assets by Rs.75,730 crore (net of revaluation) during 2002-03 so far, as compared with Rs.45,740 crore last year. The net domestic assets (NDA) underwent a compensating decline of Rs.50,534 crore, as the Reserve Bank continued to counterbalance domestic and external sources of monetisation as well as neutralise the liquidity released by CRR cuts (Chart II.22).
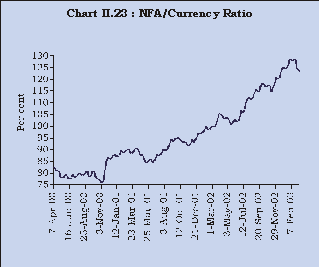
2.52 Due to a steady rise in net foreign assets led by capital inflows, the ratio of net foreign assets to currency climbed to 123.3 per cent by March 14, 2003, far in excess of 70 per cent as recommended by the Committee on Capital Account Convertibility (Chairman: S. S. Tarapore) (Chart II.23).

2.53 The Reserve Bank’s subscription to the Centre’s fresh dated securities, at Rs.36,175 crore (at face value, inclusive of Rs.13,000 crore towards pre-payment loans drawn from multi-lateral agencies) during 2002-03 so far, was swamped by net open market sales amounting to Rs.53,772 crore. Reflecting the increased market appetite for government paper in the wake sustained easy liquidity conditions emanating from capital flows and reductions in reserve requirements, the Reserve Bank was, thus, able to more than offset the monetary impact of deficit financing through secondary market operations (Chart II.24).
2.54 The net Reserve Bank credit to the Central Government declined by Rs.24,098 crore as compared with a decline of Rs.936 crore during the corresponding period of 2001-02 (Table 2.12). In view of the market demand for government paper, the Reserve Bank converted annuities in the form of 4.6 per cent special securities of Rs.40,000 crore into marketable securities This enhances the quality of the Reserve Bank’s balance sheet, not only by reducing the non-marketable portion of the public debt but also by valuing central bank assets at market-determined rates. Furthermore, commercial banks and PDs redeemed their refinance drawals in view of CRR cuts.
Table 2.12 : Net Reserve Bank Credit to the Centre: Quarterly Variations | |||||||||||||||||||||||||||||||||||||||
(Rupees crore) | |||||||||||||||||||||||||||||||||||||||
Variable | 2001-02 | 2002-03 | |||||||||||||||||||||||||||||||||||||
Q1 | Q2 | Q3 | Q4 | Q1 | Q2 | Q3 | Q4$ | ||||||||||||||||||||||||||||||||
1 | 2 | 3 | 4 | 5 | 6 | 7 | 8 | ||||||||||||||||||||||||||||||||
Net Reserve Bank Credit to the | 19,523 | -20,140 | -4,770 | 236 | 1,455 | -19,555 | -17,882 | 11,884 | |||||||||||||||||||||||||||||||
Centre (1+2+3+4-5) | (13.3) | (-12.1) | (-3.3) | (0.2) | (1.0) | (-13.7) | (-14.5) | (11.3) | |||||||||||||||||||||||||||||||
1. | Loans and Advances | 3,619 | -7,791 | -1,223 | 5,176 | 2,472 | -7,648 | 0 | 0 | ||||||||||||||||||||||||||||||
2. | Treasury Bills held by the | -3 | -480 | 0 | 18 | -18 | 0 | 0 | 0 | ||||||||||||||||||||||||||||||
Reserve Bank | |||||||||||||||||||||||||||||||||||||||
3. | Reserve Bank’s Holdings of | 13,150 | -11,907 | -3,529 | 63 | -6,107 | -11,761 | -17,979 | 11,979 | ||||||||||||||||||||||||||||||
Dated Securities | |||||||||||||||||||||||||||||||||||||||
4. | Reserve Bank’s Holdings of | 39 | 38 | -18 | 24 | 64 | -146 | 97 | -91 | ||||||||||||||||||||||||||||||
Rupee Coins | |||||||||||||||||||||||||||||||||||||||
5. | Central Government Deposits | -2,718 | 0 | -1 | 5,045 | -5,044 | 0 | 0 | 4 | ||||||||||||||||||||||||||||||
Memo Items* | |||||||||||||||||||||||||||||||||||||||
1. | Market Borrowings of | 46,000 | 31,000 | 24,000 | 13,213 | 49,000 | 35,000 | 23,000 | 18,000 | ||||||||||||||||||||||||||||||
Dated Securities by the Centre # | |||||||||||||||||||||||||||||||||||||||
2. | Reserve Bank’s Primary | 21,000 | 679 | 4,000 | 3,213 | 22,018 | 1,157 | 0 | 13,000 | ||||||||||||||||||||||||||||||
Subscription to Dated Securities | |||||||||||||||||||||||||||||||||||||||
3. | Repos (-) / Reverse Repos (+) | 1,355 | 1,410 | -1,160 | -4,605 | -20,355 | 8,845 | 10,371 | 4,994 | ||||||||||||||||||||||||||||||
(LAF), net position | |||||||||||||||||||||||||||||||||||||||
4. | Net Open Market Sales # | 10,929 | 13,985 | 5,273 | 148 | 7,020 | 19,918 | 15,693 | 11,141 | ||||||||||||||||||||||||||||||
5. | Primary Operations £ | 27,376 | -7,273 | 1,178 | 3,368 | 29,598 | -8,642 | -12,527 | 17,969 | ||||||||||||||||||||||||||||||
* | At face value. | £ | Adjusted for Centre’s surplus investment | $ | Up to March 14, 2003. | # | Excludes Treasury Bills. | ||||||||||||||||||||||||||||||||
Figures in parentheses constitute percentage variations. Data based on March 31 for Q4 and last reporting Fridays for other quarters. | |||||||||||||||||||||||||||||||||||||||
Monetary Survey
2.55 Broad money (M3) increased by 14.3 per cent (11.4 per cent, net of the impact of the mergers) during 2002-03 (up to March 7, 2003) as compared with 13.0 per cent during the comparable period of 2001-02 growth rate (Table 2.13). On an annual basis, the M3 worked out to 12.7 per cent (net of impact of mergers) as compared with 13.9 per cent last year. The average growth rate decelerated to 13.9 per year-on-year M3 cent (net of RIBs/IMDs/merger effects) as on March 7, 2003 from 15.3 per cent in the previous year. Currency with the public decelerated during 2002-03 (up to March 7, 2003), partly reflecting dampened agricultural activity. Aggregate deposit growth, at 11.1 per cent (net of the merger impact), was lower than that of the corresponding period of last year.
Table 2.13 : Monetary Indicators – Variations | |||||||||||||||||||||||||||||||||||||||
(Absolute variations in Rupees crore) | |||||||||||||||||||||||||||||||||||||||
Indicator | 2001-02 | 2002-03 | 2001-02 | ||||||||||||||||||||||||||||||||||||
(up to March 7, 2003) | (up to March 8, 2002) | ||||||||||||||||||||||||||||||||||||||
Point to | Monthly | Absolute | Per cent | Absolute | Per cent | ||||||||||||||||||||||||||||||||||
Point | Average | ||||||||||||||||||||||||||||||||||||||
(Per cent) | (Per cent) | ||||||||||||||||||||||||||||||||||||||
1 | 2 | 3 | 4 | 5 | 6 | ||||||||||||||||||||||||||||||||||
Reserve Money | 11.4 | 11.1 | 25,196 * | 7.5 * | 26,608 * | 8.8 * | |||||||||||||||||||||||||||||||||
Broad Money (M 3) | 14.2 | 16.2 | 2,14,249 | 14.3 | 1,70,536 | 13.0 | |||||||||||||||||||||||||||||||||
(1,71,657) | (11.4) | ||||||||||||||||||||||||||||||||||||||
Currency with the Public | 15.2 | 12.7 | 32,932 | 13.6 | 34,251 | 16.3 | |||||||||||||||||||||||||||||||||
Aggregate Deposits | 14.2 | 17.0 | 1,81,759 | 14.5 | 1,37,716 | 12.5 | |||||||||||||||||||||||||||||||||
Net Bank Credit to Government | 14.6 | 16.6 | 76,214 | 13.0 | 71,763 | 14.0 | |||||||||||||||||||||||||||||||||
Bank Credit to Commercial Sector | 11.3 | 12.8 | 1,29,803 | 17.2 | 62,763 | 9.2 | |||||||||||||||||||||||||||||||||
Net Foreign Exchange Assets of | 26.0 | 24.6 | 82,991 | 26.4 | 51,650 | 20.7 | |||||||||||||||||||||||||||||||||
the Banking Sector | |||||||||||||||||||||||||||||||||||||||
* Up to March 14, 2003 and the corresponding period of the previous year. | Data are provisional. | ||||||||||||||||||||||||||||||||||||||
Figures in parentheses are net of the impact of the mergers. | |||||||||||||||||||||||||||||||||||||||
1 As against net external assistance of Rs.770 crore budgeted in 2002-03, the revised estimates show that net external assistance would be negative at Rs.13,496 crore due to higher repayments of Rs.25,210 crore than the budgeted amount of Rs.10,563 crore.

ਇਸ ਪੇਜ ਨੂੰ ਸ਼ੇਅਰ ਕਰੋ:


ਭਾਰਤੀ ਰਿਜ਼ਰਵ ਬੈਂਕ ਮੋਬਾਈਲ ਐਪਲੀਕੇਸ਼ਨ ਇੰਸਟਾਲ ਕਰੋ ਅਤੇ ਨਵੀਨਤਮ ਖਬਰਾਂ ਤੱਕ ਤੇਜ਼ ਐਕਸੈਸ ਪ੍ਰਾਪਤ ਕਰੋ!
ਸਾਡੀ ਐਪ ਇੰਸਟਾਲ ਕਰਨ ਲਈ QR ਕੋਡ ਸਕੈਨ ਕਰੋ।


ਪੇਜ ਅੰਤਿਮ ਅੱਪਡੇਟ ਦੀ ਤਾਰੀਖ:


