 IST,
IST,


II. Fiscal Situation
|
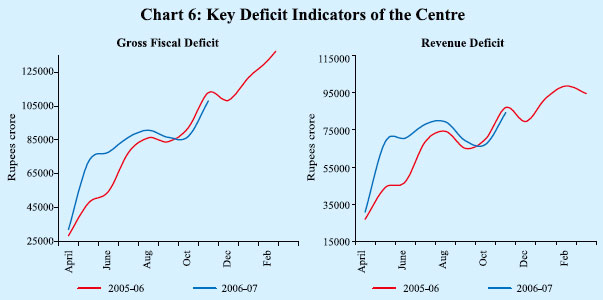
Combined Government Finances: 2006-07 With the resumption of fiscal consolidation process at the Centre in terms of the Fiscal Responsibility and Budget Management (FRBM) Rules, 2004 and enactment of fiscal responsibility legislations by most of the States, public finances are budgeted to show improvement during 2006-07. Key deficit indicators of the Centre and States taken together are budgeted to decline by 0.7-0.9 per cent of GDP in 2006-07 on the back of buoyancy in tax collections and reprioritisation of expenditure towards development expenditure (Table 13). Centre’s Fiscal Situation The Central Government finances for the first eight months (April-November) of the fiscal year 2006-07 show that fiscal deficit, as per cent of budget estimates (BE), was placed lower than that in the corresponding period of the previous year (Chart 6 and Table 14). Till September 2006, fiscal deficit (as per
cent to BE) was placed higher than a year ago. Revenue deficit during April-November 2006, as per cent of BE, however, continued to be higher than the previous year on account of increase in non-Plan expenditure which offset buoyant tax revenues. Contraction in non-defence capital outlay and loans and advances, however, moderated the impact on fiscal deficit.
During April-November 2006, tax revenues, as per cent of BE, were higher than a year ago on account of impressive growth in income tax, corporation tax, customs duties and services tax. Receipts from new taxes - fringe benefit tax, securities transaction tax and banking cash transaction tax - also remained buoyant in the first eight months of 2006-07. Union excise duties, however, continued to show subdued growth. Non tax-revenues, as per cent of BE, were higher than a year ago on account of higher dividends and profits. Aggregate expenditure, as per cent of BE, was higher on account of sustained increase in non-Plan expenditure, particularly interest payments, subsidies and grants to States. Plan expenditure, in terms of budget estimates, declined under both the revenue and capital accounts. Capital outlay in the first eight months showed a modest increase on account of a rise in defence capital outlay. Mid-Year Review by Government of India The Central Government finances during the first half of the year (April-September 2006) exhibited stress with the key deficit ndicators, as per cent of BE, being higher than their levels in the corresponding period of the previous year. The deficit indicators, viz., the revenue and fiscal deficit fell short of the half yearly FRBM targets. In the document Mid-Year Review for 2006-07, as required under the FRBM Act, 2003, the Central Government contended that the accelerated pace of expenditure partly reflected front-loading of expenditures, particularly in the first quarter, to smoothen intra-year asymmetry in spending and avoid bunching of expenditures and parking of funds in the last quarter. The stress in the finances was also attributed to the acceleration in non-Plan expenditures in the second quarter. The Government is confident of evening out the mismatch in expenditure and receipts during the second half of the year. Buoyant economic growth is also expected to contribute towards augmenting the Government’s revenue, thereby enabling it to meet the deficit targets set in the Budget. Financing of the Union Budget Net market borrowings (excluding allocations under the Market Stabilisation Scheme) of the Centre for 2006-07 are budgeted at Rs.1,13,778 crore, which would finance 76.5 per cent of the gross fiscal deficit in 2006-07 as compared with 69.2 per cent in the preceding year. Including repayment obligations of Rs.68,097 crore (as per Reserve Bank records), gross market borrowings of the Central Government work out to Rs.1,81,875 crore. During 2006-07 (up to January 22, 2007), the issuances of dated securities at Rs.1,25,000 crore were higher than the amount raised (Rs.1,15,000 crore) in the corresponding period of the preceding year (Table 15). Although the Central Government frontloaded its market borrowings by an additional Rs.4,000 crore on June 22, 2006, gross
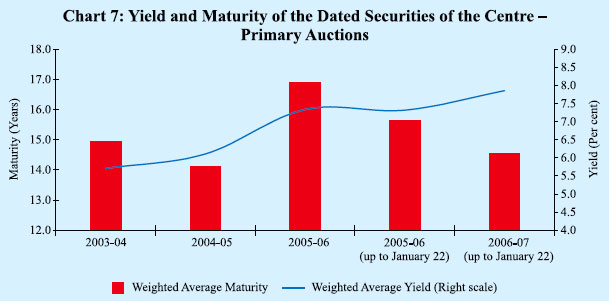
market borrowings during 2006-07 (up to January 22, 2007) were Rs.5,000 crore lower than the indicative issuance calendar reflecting (i) the reduction in the notified amounts from Rs.6,000 crore and Rs.4,000 crore (as per issuance auction calendar) to Rs.5,000 crore and Rs.2,000 crore, respectively, in the auctions held on July 11, 2006 and from Rs.5,000 crore to Rs.4,000 crore on July 27, 2006 and (ii) cancellation of the auction of Rs 5,000 crore scheduled for January 5-12, 2007 on a review of the Government’s borrowing requirements. Furthermore, in the auction held on December 8, 2006, the notified amount of short tenor security was reduced by Rs.1,000 crore, while that of the longer tenor security was increased by Rs.1,000 crore. During the year so far, 28 securities have been issued. While 25 securities were reissues, three new securities of 10-year, 15-year and 30-year maturity were issued to provide benchmarks in the respective segments. Gross and net market borrowings (including dated securities and 364-day Treasury Bills) raised by the Centre during 2006-07 up to January 22, 2007 amounted to 83.1 per cent and 80.4 per cent of the budget estimates as compared with 84.9 per cent and 82.7 per cent, respectively, a year ago. The weighted average maturity of dated securities of the Central Government during 2006-07 (up to January 22, 2007) at 14.56 years was lower than that of 15.61 years in the corresponding period of the preceding year. The weighted average yield of the dated securities issued over the same period, on the other hand, increased to 7.86 per cent from 7.29 per cent (Chart 7). In this context, it may be noted that the secondary market yield on 10-year Central Government securities increased from 7.02 per cent during April-December 2005 to 7.76 per cent during April-December 2006. The Central Government has taken recourse to ways and means advances (WMA) on 39 days during 2006-07 so far (up to January 22, 2007) as compared with only two days during the entire fiscal year 2005-06. The average WMA utilisation during 2006-07 (up to January 22, 2007) was Rs.533 crore as compared with Rs.4 crore in the corresponding period of the preceding year. The Central Government continued to maintain large cash surplus with the Reserve Bank. The average daily surplus balance of the Central Government with the Reserve Bank was Rs.23,077 crore during 2006-07 (up to January 22, 2007) as compared with Rs.21,817 crore during the corresponding period of the previous year.
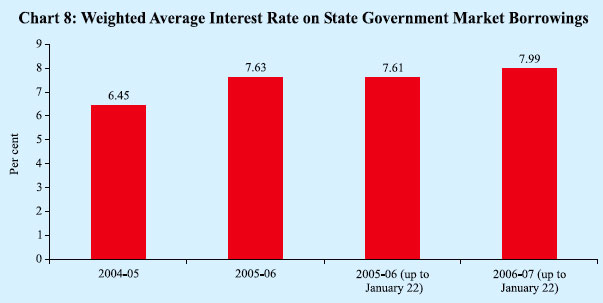
State Finances Financing of the States’ Budgets The provisional net allocation under market borrowing programme for State Governments is placed at Rs.17,242 crore during 2006-07. Taking into account additional allocations amounting to Rs.2,066 crore and repayments of Rs.6,551 crore, the gross allocation amounts to Rs.25,860 crore. During 2006-07 so far (up to January 22, 2007), the States have raised market loans amounting to Rs.14,204 crore (or 54.9 per cent of gross allocation) exclusively through auctions with cut-off rates in the range of 7.65-8.66 per cent (Table 16). Over the same period of 2006-07, the weighted average interest rate of market loans firmed up to 7.99 per cent from 7.61 per cent in the corresponding period of the previous year (Chart 8).
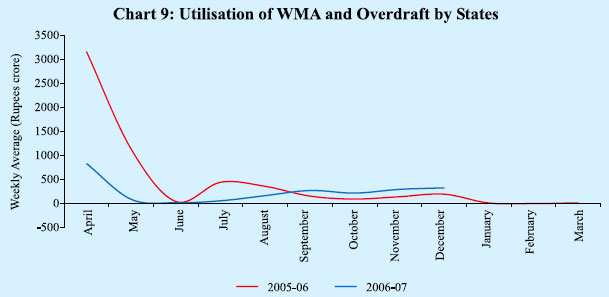
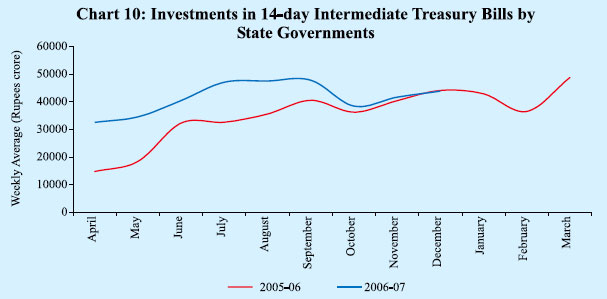
The liquidity position of the States has remained comfortable during 2006-07 so far. Notwithstanding the increase in WMA availment between September and November 2006, the weekly average utilisation of WMA and overdraft by the States at Rs.256 crore during April-December 2006 was lower than that of Rs.639 crore in the corresponding period of 2005 (Chart 9). Two States resorted to overdraft during 2006-07 (up to January 22, 2007) as compared with nine States during the corresponding period of the previous year. The cash surplus position of the State Governments has improved further during 2006-07 so far. This was reflected in an increase in their investments in 14-day Treasury Bills to Rs.41,567 crore
(weekly average) during April-December 2006 from Rs.32,789 crore in the corresponding period of the previous year (Chart 10). The surplus cash balances of State Governments are automatically invested in 14-day Treasury Bills.
|
||||||||||||||||||||||||||||||||||||||||||||||||||||||||||||||||||||||||||||||||||||||||||||||||

ਇਸ ਪੇਜ ਨੂੰ ਸ਼ੇਅਰ ਕਰੋ:


ਭਾਰਤੀ ਰਿਜ਼ਰਵ ਬੈਂਕ ਮੋਬਾਈਲ ਐਪਲੀਕੇਸ਼ਨ ਇੰਸਟਾਲ ਕਰੋ ਅਤੇ ਨਵੀਨਤਮ ਖਬਰਾਂ ਤੱਕ ਤੇਜ਼ ਐਕਸੈਸ ਪ੍ਰਾਪਤ ਕਰੋ!
ਸਾਡੀ ਐਪ ਇੰਸਟਾਲ ਕਰਨ ਲਈ QR ਕੋਡ ਸਕੈਨ ਕਰੋ।


ਪੇਜ ਅੰਤਿਮ ਅੱਪਡੇਟ ਦੀ ਤਾਰੀਖ:


