 IST,
IST,
Industrial Outlook Survey of the Manufacturing Sector for Q2:2020-21
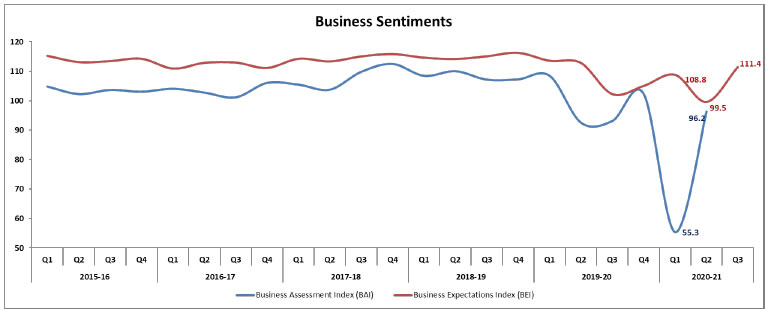
Today, the Reserve Bank released the results of the 91st round of the Industrial Outlook Survey (IOS) conducted during July-September 2020. The survey encapsulates qualitative assessment of the business climate by Indian manufacturing companies for Q2:2020-21 and their expectations for Q3:2020-211. In all, 959 companies responded in this round of the survey. Owing to uncertainty driven by the Covid-19 pandemic, an additional block was included in this round of the survey for assessing the manufacturers’ outlook on key parameters for two and three quarters ahead. Highlights: A. Assessment for Q2: 2020-21
B. Expectations for Q3: 2020-21

C. Expectations for Q4:2020-21 and Q1:2021-22
1 The survey results reflect the views of the respondents, which are not necessarily shared by the Reserve Bank of India. This round of the survey was launched on August 7, 2020 and results were compiled with data received till September 23, 2020. The results of the 90th round of the survey (Q1:2020-21) were released on August 6, 2020 on the RBI’s website. 2 For each survey round, two indices are computed – one based on assessment [viz., Business Assessment Index (BAI)] and another based on expectations [viz., Business Expectations Index (BEI)]. Each index is a composite indicator calculated as a simple average of nine business parameters, where each parameter is derived as a weighted net response of companies, weights being the share of industry groups in gross value added (GVA). The nine parameters considered are: (1) overall business situation; (2) production; (3) order books; (4) inventory of raw material; (5) inventory of finished goods; (6) profit margins; (7) employment; (8) exports; and (9) capacity utilisation. BAI/BEI gives a snapshot of the business outlook in every quarter and takes values between 0 and 200, with 100 being the threshold separating expansion from contraction. 3 Net Response (NR) is the difference between the percentage of respondents reporting optimism and those reporting pessimism. It ranges between -100 to 100. Any value greater than zero indicates expansion/optimism and any value less than zero indicates contraction/pessimism. In other words, NR = (I – D), where, I is the percentage response of ‘Increase/optimism’, and D is the percentage response of ‘Decrease/pessimism’ and E is the percentage response as ‘no change/equal’ (i.e., I+D+E=100). For example, increase in production is optimism whereas decrease in cost of raw material is optimism. | |||||||||||||||||||||||||||||||||||||||||||||||||||||||||||||||||||||||||||||||||||||||||||||||||||||||||||||||||||||||||||||||||||||||||||||||||||||||||||||||||||||||||||||||||||||||||||||||||||||||||||||||||||||||||||||||||||||||||||||||||||||||||||||||||||||||||||||||||||||||||||||||||||||||||||||||||||||||||||||||||||||||||||||||||||||||||||||||||||||||||||||||||||||||||||||||||||||||||||||||||||||||||||||||||||||||||||||||||||||||||||||||||||||||||||||||||||||||||||||||||||||||||||||||||||||||||||||||||||||||||||||||||||||||||||||||||||||||||||||||||||||||||||||||||||||||||||||||||||||||||||||||||||||||||||||||||||||||||||||||||||||||||||||||||||||||||||||||||||||||||||||||||||||||||||||||||||||||||||||||||||||||||||||||||||||||||||||||||||||||||||||||||||||||||||||||||||||||||||||||||||||||||||||||||||||||||||||||||||||||||||||||||||||||||||||||||||||||||||||||||||||||||||||||||||||||||||||||||||||||||||||||||||||||||||||||||||||||||||||||||||||||||||||||||||||||||||||||||||||||
ਪੇਜ ਅੰਤਿਮ ਅੱਪਡੇਟ ਦੀ ਤਾਰੀਖ:


