 IST,
IST,


IV. Issues and Perspectives
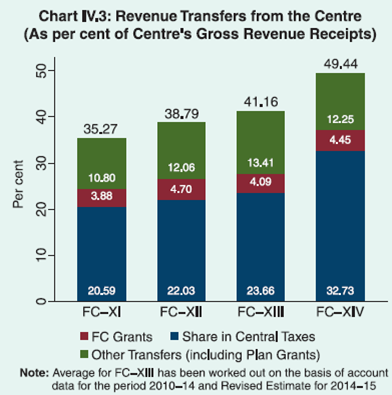
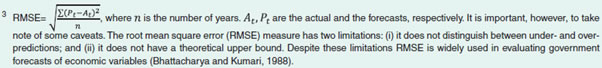
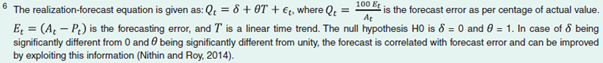
Budgetary forecasting at the sub-national level should benefit from fiscal marksmanship. Evolving federal fiscal relations are increasingly imbuing more autonomy for states, which is reflected in the recommendations of the Fourteenth Finance Commission for higher statutory transfers, particularly through the tax devolution route, reduction in discretionary plan grants and improved design of transfers. Taxing e-commerce trade is an opportunity and a challenge for states, with the need to balance market fairness, consumer protection and the revenue effort. 1. Evaluating States’ Budgetary Forecasting Performance 4.1 A characteristic feature of state finances in India is the poor predictive power of budget estimates with respect to actual outcomes. The imprecision in budgetary forecasting, reflecting persistent inefficiencies in the use of available information for budgetary process, has resulted in poor integration of plans with budgetary policy, sub-optimal implementation of government plans and weakening credibility of the budgetary process (Chart IV.1). Against this backdrop, empirical assessment of the degree of correspondence between the budgeted and actual revenues and expenditures has significant implications: are these forecasting errors due to exogenous factors that are beyond the control of forecasting authorities and/or do they emanate from application of incorrect parameters and methods? An assessment of fiscal marksmanship1 at the subnational level has not received adequate attention in the literature in India2. Accordingly, an attempt has been made to analyse errors in forecasts (budget estimates or BE and revised estimates or RE) of major revenues and expenditures of the state governments – both for non-special category (NSC) and special category (SC) states – vis-à-vis actuals for the period 2001-02 to 2012-13, the terminal year determined by the availability of actual data. 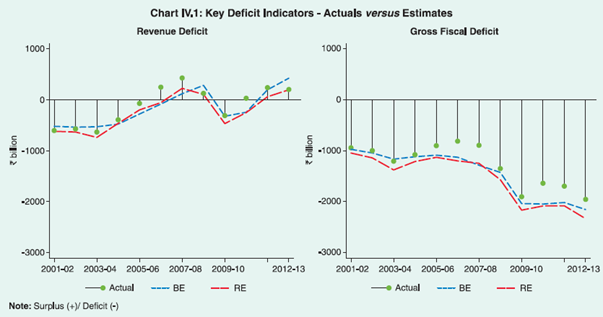 Measuring Forecast Errors 4.2 On an average, it is observed that both BE and RE tend to overestimate the major fiscal variables, barring loans and advances and recovery of loans and advances which are underestimated (Table IV.1). Overestimation is relatively large for expenditure items and consequently, this has led to an overestimation of the revenue deficit on an average by 50 per cent (BE) and 76 per cent (RE) during the period under review. Employing the standard statistical measure of deviation i.e., root mean square error (RMSE)3 to these forecast over/under shoots yields interesting insights. The RMSE is higher for tax revenue (both devolution of central taxes and own tax revenue), the revenue deficit, loans and advances, and recovery of loans and advances in the BE than in the RE. In respect of both revenue expenditure and capital outlay, however, the BE outperformed the RE. This is noteworthy because the RE is expected to factor in more information than the BE and, therefore, produce estimates closer to the actuals. Forecast Error Decomposition 4.3 Systematic forecast errors arise on account of miscalculation and wrong judgment, leading to overestimation or underestimation of revenue buoyancy and/or expenditure, and even poor assessment of macroeconomic aggregates. Technically, the systematic component of the forecast error can be reduced by improved forecasting methods. Random errors on account of unanticipated exogenous shocks are beyond the control of the forecaster (such as oil price shocks which could impact states’ VAT revenues4; and uncertainties surrounding central transfers). The mean square error of the various fiscal variables are decomposed5 in order to identify the extent of systematic and random errors. The systematic component is further divided into the proportion of forecast error due to bias (over/under prediction of the average value) and the proportion due to unequal variation in the actual and the estimates (over/under prediction of the variance). 4.4 The random component turns out to be high for revenue receipts, particularly devolution of central taxes. On the other hand, the forecasts of grants from the centre, overall revenue expenditure, capital outlay, loans and advances and recovery of loans exhibit a large systematic component, indicating scope for improving forecasting (Table IV.2). 4.5 Given the infirmities associated with standard statistical measures of variance referred to earlier, the distribution of per centage errors has been examined using box plots which provide ranges in which errors lie and the variation. These plots reveal that the range of error is higher for BE than for RE for the entire period under review. Among revenue items, states’ share in central taxes has the largest errors, arising outside the states’ control and, therefore, not amenable to reduction through refinement in forecasting methodology. Among the major expenditure heads, capital outlay - particularly the development component - shows the largest margin of error, reflecting expedient adjustments necessitated by unanticipated revenue shortfalls to meet committed fiscal targets. Within revenue expenditure, the development component contributes significantly to forecast error for similar reasons (Chart IV.2). 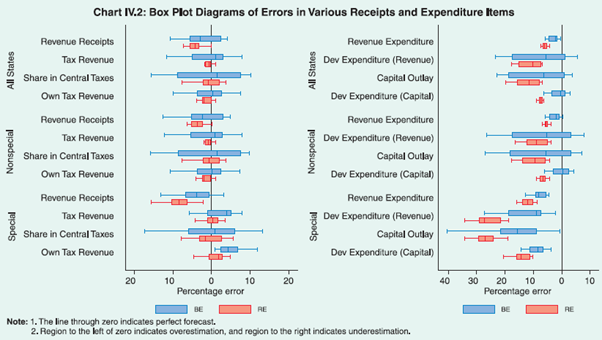 Testing Inter-temporal Efficiency of Forecasts 4.6 The efficiency of budgetary forecasts over time is evaluated by employing realisation-forecast equations.6 If the coefficient on the time variable is less than 0, the efficiency of forecasting improves over time; on the other hand, greater than 0 would imply deterioration in forecasting efficiency over time. In this regard, this exercise shows that is statistically insignificant for all the fiscal variables under consideration except own tax revenue, which shows no improvement in forecasting over time (Table IV.3). 4.7 In summary, forecast errors around the states’ budget estimates have exhibited higher variability, reflecting over-estimation of expenditures relative to receipts. This appears to be driven by incentive-compatibility, given the constraints states face in borrowing from the market as well as federal transfers – both tax devolution and grants. Empirical analysis provide little evidence of any significant improvement in budgetary estimates over time. Therefore, the main message is that state governments can improve the efficiency and reliability of their budgetary forecasts of underlying components by having better estimates of key parameters like tax and expenditure elasticities. While some variables which are beyond the control of the states may continue to impact fiscal marksmanship, states may attempt to improve the methodology used for their budgeting exercise to minimise overall forecast errors. Despite its aggregative approach, this exercise offers a simple methodological framework for evaluating the accuracy and efficiency of budget estimates that individual states can adopt as part of prudent housekeeping. 2. Changing Dynamics of Fiscal Federalism 4.8 Fiscal federalism7 in India has been undergoing a significant transformation over the past two decades, driven by an overhaul of the policy framework aimed at redressing vertical imbalances - most major taxes are assigned to the central government, while large part of the expenditure responsibilities lie with the state and local governments - and horizontal imbalances among states in terms of their revenue raising capacity relative to their expenditure responsibilities. 4.9 Vertical and horizontal imbalances in federal finances are addressed by the Finance Commissions (FC) set up under Article 280 of the Constitution every fifth year or earlier, if necessary. Apart from these statutory transfers through FC awards, the centre also provides plan grants which comprise of (i) formula-based8 untied transfers under normal central assistance for the annual plans of states; (ii) additional central assistance for specific-purpose schemes and transfers; (iii) special central assistance for special category states; and (iv) special plan assistance. Funds are also transferred under central plan schemes and centrally sponsored schemes (CSS), which are conditional upon the implementation of specified schemes and programmes. Over 70 per cent of central assistance for CSS used to be disbursed to district rural development agencies (DRDA) and implementing agencies, bypassing the state budgets. From the fiscal year 2014-15, however, the entire financial assistance in respect of CSS is being routed to the states through their consolidated funds. States, in general, have expressed concerns over the increasing share of non-statutory transfers, particularly non-formula based transfers, at the expense of statutory transfers. This has reduced states’ fiscal space over the years, resulting in misalignment between expenditure patterns and policy priorities. 4.10 Against this backdrop, changes in the architecture of fiscal transfers over the tenure of past FCs have been examined in the following sections with a view to evaluating their effectiveness in rebalancing the roles of the centre and states. Tax Devolution Vertical Distribution 4.11 Vertical imbalances are addressed through central transfers, viz., states’ share in central taxes and grants. Each FC has exercised varying value judgments to determine the approach and size of the vertical revenue transfers. The key factors determining states’ share in central taxes have varied across FCs. Since the FC-XI, in particular, there has been a radical departure. Instead of limiting the states’ share to tax-specific transfers9, the approach has been to widen the base to include the entire proceeds from gross tax revenue (barring surcharges and cesses) in a common shareable pool of revenues, from which a fixed per centage share (as recommended by the FC) is devolved to the states. While a gradual increase in tax devolution was recommended by subsequent FCs, the FC-XIV has recommended a sharp increase in tax devolution by 10 per centage points to 42 per cent of the divisible pool (Table IV.4). The objective is to increase the flow of unconditional transfers to states while leaving space for the centre to carry out specific-purpose transfers to states through an alternate institution. Horizontal Distribution 4.12 In order to address horizontal imbalances, FC transfers have attempted to (i) correct for differentials in revenue raising capacity and cost disability factors inherent in the economies of the states and (ii) foster fiscal efficiency among the states. The criteria used in the past for horizontal transfer purposes can be grouped under (a) factors reflecting needs such as population and infrastructure distance; (b) cost and revenue disability indicators such as area and income distance from the highest per capita income or as an inverse; and (c) fiscal efficiency indicators such as tax effort and fiscal discipline. The choice, definition and weight of the variables used to define a devolution formula have been changing across the FCs, reflecting efforts to address competing claims of equity and efficiency. 4.13 The FC-XIV has removed the distinction between non-special and special category states. It has accorded greater importance to fiscal capacity, with indicators of cost and revenue disabilities being assigned a combined weight of 72.5 per cent as against 57.5 per cent assigned by the FC-XIII (Table IV.5). Under the new tax devolution formula, the share of 19 states in taxes would be higher than those under the FC-XIII’s recommendations (Table IV.6). Grants-in-aid 4.14 Apart from tax devolution, the centre also extends grants which are either unconditional/ general purpose - intended mainly to fill the nonplan revenue gap - or conditional and purpose specific to meet certain objectives. Grants-in-aid are mainly targeted towards achieving a degree of equalisation. Consequent to the 73rd and 74th amendments to the Constitution, the FC-X introduced exclusive grants for rural and urban local bodies. The FC-XI established the practice of conditionalities for grants from the centre to the states. It also placed an indicative ceiling on the total transfers to the states (including transfers by the Planning Commission and central ministries), regardless of the channels of transmission. The overall ceiling for transfers in terms of gross revenue receipts has been marginally increased by subsequent FCs. 4.15 The FC-XIV has recommended post-devolution revenue deficit grants of ₹1,948 billion during its award period (viz., 2015-20) for eleven states. It has also recommended grants for local governments and disaster management but has dispensed with sector specific and area/state specific FC grants due to multiplicity of channels of central support (Table IV.7). Fiscal Discipline 4.16 In recognition of the fact that high transfer dependence can lead to fiscal profligacy, successive FCs since FC-XI had emphasised the need to maintain fiscal discipline at all levels of government. Implementation of fiscal reforms at the state level was incentivised by assigning weights to fiscal discipline in the devolution criteria. Further, enactment of fiscal responsibility legislations committing the states to deficit and debt targets were made pre-conditions for availing debt and interest relief, based on the FC-XII’s recommendation. In the aftermath of the global financial crisis and the consequent deviations from the FRBM targets, FC-XIII specified a road-map for return to fiscal consolidation, both at the central and state government levels, with annual targets for reduction in revenue/gross fiscal deficits and debt. Fiscal efficiency indicators have, however, not been taken into account by the FC-XIV for tax devolution, despite a majority of states favouring the continuation of the fiscal discipline criteria. 4.17 Making a marked departure, FC-XIV has linked fiscal discipline to borrowing criteria rather than devolution criteria, with the borrowing ceiling being relaxed up to 0.5 per cent of GDP for states with revenue balance and prescribed debt-GDP ratio/interest rate-revenue receipts ratios (Box IV.1). This will enable fiscally well managed states to resort to higher borrowings for increasing developmental capital spending. Sub-national Government Borrowing 4.18 The FC-XII brought about a radical change in the role of the centre in the borrowings of state governments. In pursuance of the recommendations of the Commission, the centre has not been extending loans to states under state plans from 2007-08 onwards, but the grants portion of central assistance has been significantly enhanced. Each state raises market borrowings for the loan portion of the state plan schemes, subject to borrowing caps for the year. Furthermore, based on the FC-XII’s recommendation, transfer of external assistance to non-special category states (as state governments cannot access external sources of finance directly) is being provided on a ‘back-to-back’ basis since April 1, 2005. The move towards disintermediation of loans from the centre has been undertaken to encourage states to rely more on markets for meeting their borrowing needs, thereby subjecting them to market discipline and attenuating the problem of moral hazard. 4.19 In continuation with the disintermediation principle advocated by FC-XII, the FC-XIV has recommended that states may be excluded from the operations of the National Small Savings Fund (NSSF) with effect from April 1, 2015 and their involvement be limited to discharging the liabilities already incurred. However, the Union Budget, 2015-16 indicates a net investment of ₹103.4 billion by the NSSF in state government securities. As alluded to earlier, the FC-XIV has also provided for an increase in the overall borrowing limits of states, subject to their fulfilment of certain conditionalities. Box IV.1: The Report of the Fourteenth Finance Commission (FCXIV) (Chairman: Dr.Y.V.Reddy) was submitted in December 2014 and was placed before the Parliament on February 24, 2015. The major recommendations of the Commission which covers the period 2015-20 relating to the States are set out below: Vertical Distribution
Horizontal Distribution
Goods and Services Tax
Fiscal Discipline and FRBM
Legislative Measures for Fiscal Rules
Pricing of Public Utilities
Public Expenditure Management
Debt Relief Measures 4.20 Since FC-II, states were provided with debt relief measures in respect of loans extended to them by the centre with a view to aiding their debt sustainability.10 These measures were in the form of (i) debt consolidation on common terms and reduction of interest rates, (ii) rescheduling of loans to elongate the repayment period without changes in interest rates, (iii) moratorium on interest payments and repayment of principal for a certain period, (iv) debt write-offs and (v) introduction of schemes that linked debt relief to fiscal performance. FC-IX extended debt relief to include plan loans as well as non-plan loans. FC-X and FC-XI linked debt relief to fiscal performance. A watershed in advancing fiscal reforms at the sub-national level was FC-XII award which made availment of debt relief for central loans contingent upon the enactment of rule-based fiscal responsibility legislations. FC-XIII extended debt relief to borrowings from the NSSF, provided the states amend/enact Fiscal Responsibility and Budget Management (FRBM) Acts. With debt/ interest relief in respect of all high cost loans from the centre having been covered by previous FCs, FC-XIV has not made any provision for debt relief. Changes in the Composition of Central Transfers 4.21 With a view to minimising discretion, improving the design of transfers, avoiding duplication and promoting co-operative federalism, the FC-XIV suggested a review of existing arrangements for transfers outside of the recommendations of the FC. Accordingly, it suggested that a new institutional arrangement may be evolved which can, inter alia, make recommendations regarding sector-specific and area-specific grants. 4.22 In view of the enhancement in the FC transfers to states, the centre-state funding pattern of some of the centrally sponsored schemes (CSS) has been modified in the Union Budget, 2015-16. CSS have been grouped into three categories viz., (i) schemes which will be fully supported by the centre, (ii) schemes which will run with the changed sharing pattern and (iii) schemes which will be delinked. Although 30 schemes were initially identified for discontinuation of central support on the basis of the FC-XIV’s recommendation, only eight CSS have been delinked in 2015-16 (BE). These changes in centre-state funding pattern of CSS schemes would result in a reduction in the central assistance to state plans to 1.4 per cent of GDP in 2015-16 (BE) from 2.1 per cent of GDP in 2014-15 (RE). 4.23 Overall, the projections made by the FCXIV for the award period indicate a significant increase in the share of revenue transfers from the centre relative to centre’s gross revenue receipts (Chart IV.3). However, since the CSS funds, which were earlier given directly to implementing agencies, are being routed through state budgets from 2014-15 onwards, these direct transfers were added to state plan grants for the period 2010-14 to make a like-to-like comparison. This indicates that the share of revenue transfers in gross revenue receipts of the centre at 48.9 per cent during the FC-XIII award period, was only marginally lower than that projected for the FC-XIV period (49.4 per cent). 4.24 According to the Economic Survey 2014-15, special category states will be the biggest gainers of the FC-XIV award. Further, nine nonspecial category states are expected to get more than 25 per cent of their own revenue. The compositional shift in favour of statutory transfers and reduction of discretionary plan grants would increase the autonomy of states and give them greater flexibility with regard to allocation of their expenditure. The FC-XIV’s recommendations imbibe the spirit of co-operative federalism which is further advanced by the replacement of the Planning Commission by the NITI Aayog. The key objective is to give states greater freedom in designing their development plans that are growth-enhancing, fiscally prudent and serving national objectives. With a conducive policy environment, states would have to seize the initiative and aim to propel their economies on to a higher growth trajectory. 3. Taxing E-commerce Trade 4.25 Rapid progress in e-commerce11 in recent years has confronted governments having federal structures with issues relating to taxing e-commerce trades, especially inter-state trades (Box IV.2). These issues are gaining importance in the Indian context, with e-commerce and online business in the country booming in recent years and expected to grow exponentially.12 The key issues are: (a) what should be treated as point of sale? and (b) whether e-business is to be treated as market place or inventory model of online business? The Unsettled Issues 4.26 The point of sale in online trade i.e., where the sale is deemed to have occurred, fixes the liability and incidence of tax. For intra-state sale, i.e., where the seller and buyer are in the same state, the Value Added Tax (VAT) rate of that state is applicable and collected from the seller. For inter-state trade i.e., where the seller and buyer are located in different states, the Central Sales Tax (CST) is applicable and is collected and kept by the state in which the sale originates and not by the destination state. In the case of online trading/selling in the business to customer model, the seller is liable to pay both CST and VAT, depending on location of the seller. In respect of transactions through e-retailers, there is considerable ambiguity regarding where the sale is deemed to have occurred and hence, in the incidence of tax. This leads to dual tax demand, both at the point of origin as well as at the point of destination. Box IV.2: Internationally, laws are being amended and systems are being put in place to tax interstate online sales of goods and services in a fair manner to protect revenues of the states, interests of consumers and local business and at the same time, encourage online businesses. In the United States of America, inter-state trades are not taxed unless the seller has a physical presence (‘nexus’) in the destination state. The Market Fairness Act (MFA) was reintroduced on March 10, 2015 after the MFA 2013 was stalled. The Act intends to empower state governments to collect taxes from e-retailers on the basis of destination, even when the seller does not have a nexus in the state. Under the Act, states have been asked to voluntarily enter into Streamlined Sales and Use Tax Agreement (SSUTA) wherein they will have to simplify and harmonise the tax rate, administrative procedures and provide software to retailers to calculate and track the applicable destination based tax rates. In order to simplify tax collection there is a small seller tax exception clause for online/remote sales of less than US$1 million and a single organization would handle sales tax registrations, filings and audits for all states. Up to December 2014, twenty-four states have passed laws conforming legislation. MFA 2015 proposes to give states the right to enforce their own laws regarding sales tax and provide a grace period in imposition and collection of tax on remote sellers after enactment of the Act. Distance Sales in the European Union include mail orders, phone sales and sale of physical goods ordered over online platforms. Destination-based tax is applicable for distance sales if the seller is registered for VAT in destination EU country; for unregistered sellers, VAT of the origin country is applicable if the threshold level of sales of the destination country is not reached. If the sales exceed the threshold level in a member state, the supplier must register and account for VAT in that country. Many member states are offering cash lotteries based on fully compliant VAT invoices to encourage compliance and reduce fraud. From January 1, 2015, even online sales of digital goods (digital download of music, software, online courses, e-books, even knitting patterns) will have to charge VAT at the buyer’s country rate without a small seller exception. A new portal – Mini One-Stop-Shop (MOSS) – is being launched in each member state where the sellers have to register themselves, report sales and individually account for VAT collected for each of the EU countries. The tax authorities of each country will then distribute the VAT to the appropriate countries. The cost of VAT compliance under the new regime has been estimated at 80 billion by the European Commission (2015). Keeping in view this cost and complexity of applying these rules along with how these act as deterrent to trade, the EU has agreed to reconsider these rules. At the same time the concept of Single Digital Market strategy for the EU is being worked which will help apply uniform rules of taxation across all countries in the EU for digital download and services. In Canada, online sales and brick and mortar sales are taxed under the same rules. Some states have legislated that online sellers should register themselves in the state and provisional sales tax (PST) on online sales should be collected and remitted to them. Other states are using moral suasion to get e-retailers to comply with destination based taxes. If sellers do not register or pay PST, then the consumer is liable to pay the tax. This is forcing some of the retailers to limit their areas of operation in order to simplify tax compliance. An agreement was signed by 18 Brazilian states to charge ICMS (State VAT) based on the location of the consumer, even when the seller does not have any sort of physical presence in the destination state. However in September 2014, the Brazilian Supreme Court has ruled that ICMS on inter-state e-commerce sales will be charged on the origin principle. This is at odds with the destination principle adopted by OECD and most of the world. VAT rules are undergoing reforms in China. The government plans to introduce tax on online sales of goods and e-commerce in 2015 through a tax system which would require online site and e-commerce platforms to incorporate tax calculations, and potentially act as the state’s tax collector on e-retailers. In view of the complex problem faced by countries in taxing e-commerce, India needs to develop a uniform model across states which is easy to implement. Leveraging technology and plugging the gaps in the state laws will lower the cost of compliance and monitoring of e-commerce taxation. 4.27 The second issue relates to who is responsible for the collection of tax. Large e-retailers are of the view that they are providing an online marketplace to both buyers and sellers. Under the marketplace model, e-commerce firms host third-party merchants on their websites and customers buy goods on the sites from these merchants. Thus, the third party vendor/seller is liable to collect the VAT and the online platforms only need to pay service tax on the commission they charge the vendors listed with them. However, state governments are of the view that these online platforms are inventory-based models as many of the online traders set up warehouses and store goods before any sale has been transacted. Hence, they contend that these online retailers are liable for tax on the sales. 4.28 Various state Value Added Tax Acts and the Central Sales Tax Act, 1956 predate online retail activities and do not cover them specifically. Tax rates and rules differ widely across states. Even the definition and treatment of dealers and distributers differ. Further, if the vendor/third party is not registered under VAT in the state of destination, monitoring compliance of collection of tax becomes difficult. States’ responses 4.29 Conscious of the potential loss of revenue from burgeoning e-commerce, states have been undertaking a variety of strategies. They include (i) treating these businesses as inventory-based models and applying local state tax on transactions from local warehouses/distribution centers to buyer; (ii) calling for records of warehouses to verify if appropriate taxes are being paid; (iii) exerting pressure on online sites that do not have warehouses to establish warehouses and distribution centers in their states so that online trades can be easily taxed; (iv) calling for details of sales made by major e-retailers in their respective states; asking them to register themselves as dealers in the state and file applicable returns; and (v) undertaking surveys to assess the loss of revenue from online sales. 4.30 Apart from these administrative measures, states have also been calling for legislative measures such as amendment to the Central Sales Tax Act to make it easier for them to tax online retail transactions. The Karnataka Government plans to amend its Value Added Tax Act and bring e-commerce marketplace transactions under its purview. It proposes to classify online marketplaces as ‘commission agents’ since they charge a commission from third-party sellers for using their platform and their delivery and warehousing services and make them liable to pay VAT to the state government. The Way forward 4.31 The introduction of goods and services tax (GST) will solve some of the interstate tax problems faced by online sellers, as it is a consumption tax based on the principle of destination which would subsume all the indirect taxes such as CST, VAT and local taxes. Further, since GST rates would be fixed within a band around the revenue neutral rate, it would prevent wide differences in tax rates across states which could trigger inter-state flight of businesses. Centralised filing of returns will also reduce hassle for retailers. Transparency and simplification associated with GST should increase tax compliance among online retailers. There are, however, downsides too. While large e-retailers would be able to apply software programmes to calculate and levy taxes based on destination, small retailers will not be in a position to bear this additional cost and may restrict their sales to certain geographical areas. It is also necessary to explicitly address the issue of treatment and liability of online market-place platforms. 1 Fiscal marksmanship refers to the accuracy of budgetary forecasting and indicates how efficiently government uses all available information for budgetary procedures. 2 Barring Ghosh and Jena (2008) which examined fiscal marksmanship of state governments during a particular year i.e., 2005-06, the focus has been on fiscal marksmanship of the central government (Paul and Rangarajan, 1974; Asher, 1978; Chakraborty and Sinha, 2008; Bhattacharya and Kumari,1988). 4 State VAT revenues from petroleum products account for around 28 per cent of their overall VAT revenues. 7 Fiscal federalism refers to the division of governmental functions and financial relations among different tiers of government. 8 Based on the Gadgil-Mukherjee formula which assigns differential weights for population, per capita income, fiscal management and special problems. 9 Tax sharing up to FC-X was restricted to the proceeds of income tax and union excise duties. 10 Detailed table on the types of debt relief measures recommended by various FCs is given in Chapter VI on ‘Sub-National Debt Sustainability-– An Assessment of the State Governments’ in the Reserve Bank’s ‘State Finances: A Study of Budgets – 2012-13’. 11 Transactions in electronic-commerce as defined by OECD (2002) are the sale or purchase of goods or services, whether between businesses, households, individuals, governments, and other public or private organisations, conducted over computer-mediated networks. Electronic commerce operates through four segments: business to business (B2B); business to consumer (B2C); consumer to consumer (C2C); and consumer to business (C2B). 12 The e-commerce industry in India is valued at US$17 billion with around 65 million consumers buying online products and services in 2014 (Assocham-PwC, 2014). It is estimated that online transactions in India are likely to cross the US$100 billion mark in value by 2019. |


ਇਸ ਪੇਜ ਨੂੰ ਸ਼ੇਅਰ ਕਰੋ:


ਭਾਰਤੀ ਰਿਜ਼ਰਵ ਬੈਂਕ ਮੋਬਾਈਲ ਐਪਲੀਕੇਸ਼ਨ ਇੰਸਟਾਲ ਕਰੋ ਅਤੇ ਨਵੀਨਤਮ ਖਬਰਾਂ ਤੱਕ ਤੇਜ਼ ਐਕਸੈਸ ਪ੍ਰਾਪਤ ਕਰੋ!
ਸਾਡੀ ਐਪ ਇੰਸਟਾਲ ਕਰਨ ਲਈ QR ਕੋਡ ਸਕੈਨ ਕਰੋ।


ਪੇਜ ਅੰਤਿਮ ਅੱਪਡੇਟ ਦੀ ਤਾਰੀਖ:


