29: IIP - Seventeen Major Industry Groups of Manufacturing Sector (Base : 1993-94 = 100 ) - ਆਰਬੀਆਈ - Reserve Bank of India
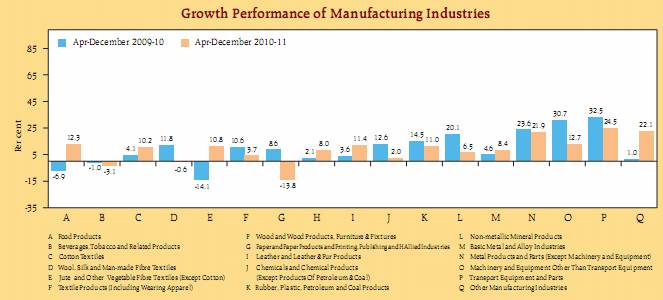
29: IIP - Seventeen Major Industry Groups of Manufacturing Sector (Base : 1993-94 = 100 )
Industry Group |
Industry |
Weight |
Annual |
Cumulative |
Monthly |
||||
2007-08 |
2008-09 |
2009-10 P |
April - December |
December |
|||||
2009-10 |
2010-11 P |
2009 |
2010 P |
||||||
1 |
2 |
3 |
4 |
5 |
6 |
7 |
8 |
9 |
10 |
|
Manufacturing Index |
79.36 |
287.2 |
295.1 |
331.9 |
329.4 |
359.3 |
381.1 |
385.0 |
20-21 |
Food Products |
9.08 |
198.2 |
178.9 |
176.2 |
152.7 |
171.6 |
264.8 |
293.0 |
22 |
Beverages, Tobacco and Related Products |
2.38 |
498.0 |
578.5 |
577.1 |
575.5 |
557.6 |
646.5 |
588.6 |
23 |
Cotton Textiles |
5.52 |
164.0 |
160.9 |
169.7 |
168.6 |
185.8 |
177.0 |
192.3 |
24 |
Wool, Silk and Man-made Fibre Textiles |
2.26 |
281.2 |
281.2 |
304.1 |
308.4 |
306.6 |
307.6 |
298.0 |
25 |
Jute and Other Vegetable Fibre Textiles (Except Cotton) |
0.59 |
120.7 |
108.6 |
82.1 |
91.4 |
101.3 |
60.4 |
95.8 |
26 |
Textile Products (Including Wearing Apparel) |
2.54 |
295.5 |
312.5 |
338.9 |
340.3 |
353.0 |
345.9 |
357.1 |
27 |
Wood and Wood Products, Furniture and Fixtures |
2.70 |
127.9 |
115.6 |
126.8 |
128.0 |
110.4 |
114.8 |
94.9 |
28 |
Paper and Paper Products and Printing, Publishing and Allied Industries |
2.65 |
255.3 |
260.0 |
270.2 |
268.0 |
289.4 |
274.2 |
307.0 |
29 |
Leather and Leather & Fur Products |
1.14 |
167.8 |
156.3 |
161.4 |
165.3 |
184.1 |
178.8 |
206.1 |
30 |
Chemicals and Chemical Products (Except Products Of Petroleum and Coal) |
14.00 |
313.4 |
326.3 |
360.7 |
362.8 |
369.9 |
376.1 |
366.2 |
31 |
Rubber, Plastic, Petroleum and Coal Products |
5.73 |
246.4 |
242.6 |
279.9 |
271.6 |
301.4 |
297.7 |
330.5 |
32 |
Non-metallic Mineral Products |
4.40 |
323.2 |
327.0 |
366.5 |
388.3 |
413.4 |
423.7 |
434.0 |
33 |
Basic Metal and Alloy Industries |
7.45 |
312.7 |
325.1 |
346.3 |
339.8 |
368.4 |
355.3 |
384.6 |
34 |
Metal Products and Parts, Except Machinery and Equipment |
2.81 |
172.9 |
165.9 |
201.9 |
205.2 |
250.1 |
218.6 |
264.4 |
35-36 |
Machinery and Equipment Other ThanTransport Equipment |
9.57 |
394.4 |
429.1 |
542.1 |
542.2 |
610.9 |
695.3 |
606.6 |
37 |
Transport Equipment and Parts |
3.98 |
378.4 |
387.9 |
504.2 |
507.7 |
632.1 |
637.0 |
677.0 |
38 |
Other Manufacturing Industries |
2.56 |
357.4 |
358.9 |
383.3 |
365.5 |
446.2 |
465.6 |
566.1 |
Source : Central Statistics Office, Ministry of Statistics and Programme Implementation, Government of India. |
|||||||||
 |


