 IST,
IST,


An Analysis of the Recent Performance of NBFC Sector
by Abhyuday Harsh, Nandini Jayakumar, Rajnish Kumar Chandra, and Brijesh P.^ NBFIs have emerged as indispensable cogs in the global financial architecture, expanding significantly in the aftermath of the global financial crisis. Unlike NBFIs in advanced economies which function in a complex financial market structure, NBFCs in India take on a relatively more straightforward intermediation role between lenders and borrowers. The growing size and interconnectedness of the sector in recent times, however, necessitated a regulatory overhaul. The consolidated balance sheet of the NBFC sector exhibited double-digit year-on-year growth as at end-December 2022. While their profitability moderated marginally, the sector continues to maintain strong capital buffers. The pandemic accelerated the usage of digital services which opens up both opportunities and challenges for NBFCs. Introduction In recent years, particularly following the global financial crisis (GFC) of 2008, non-bank financial institutions (NBFIs) have emerged as one of the most important components of the global financial system. Their growth in terms of size and interconnectedness has become a dominant feature in both advanced economies (AEs) as well as emerging market economies (EMEs). Their size has rapidly increased from around US$ 57 trillion in 2002 to US$ 239 trillion in 2021 (FSB, 2022). Regulatory changes, post the GFC that restricted the activities of banks, demographic changes necessitating management of pension funds, technological change, and the pursuit of operational efficiencies were the primary forces behind this structural shift (Aramonte, Schrimpf, & Shin, 2022). The activities of NBFIs are extensive and diverse. Unlike banks, their functions are not strictly compartmentalised. Historically, NBFIs did not have access to statutory public backstops and had either limited or no access to the balance sheet of central banks (Aramonte, Schrimpf, & Shin, 2022). However, because of their interdependence with the rest of the financial system, they may pose significant systemic risks through financial intermediation, which could circumvent the prudential standards that apply to banks and reduce the efficacy of policies, including macroprudential policies. In India, considering their growth and implications for financial stability, the Reserve Bank of India (RBI) introduced scale-based regulation1 (SBR) for non-banking financial companies2 (NBFCs). The approach adopted in SBR envisages the regulation of NBFCs to be based on the principle of proportionality, where regulations are a function of the size, activity and perceived riskiness of NBFCs. In 2022, the Bank also brought out prudential guidelines to check credit risk concentration of NBFCs placed in the upper layer. Apart from the financial stability perspective, NBFCs are among the key players in realising the financial inclusion objective. NBFCs-MFI with 38.5 per cent share in the gross micro-credit portfolio at end-December 2022, surpassed banks as the leading micro-credit provider (MFIN, 2022). The rest of the article is divided into the following sections. Section II provides an overview of the international landscape of NBFIs. Section III gives a general overview of the NBFI sector in India followed by Section IV which discusses the balance sheet, along with sectoral distribution of credit, profitability and asset quality of NBFCs. Section V deliberates upon an important category of NBFCs, namely Core Investment Companies (CICs), in light of their different business structure as compared to other NBFCs. The last section of the article concludes with a few observations on emerging challenges. II. Global Perspective NBFIs have emerged as indispensable cogs in the global financial architecture, expanding in the aftermath of the GFC. They comprise a diverse and complex set of entities, differing widely in their business models and functions across jurisdictions. Over time they have increasingly managed to capture attention in policy discussions because of their interconnectedness with other financial entities and related implications. In this regard, the Financial Stability Board (FSB), conducts annual monitoring of the sector and reports on the trends, emerging risks and innovations, which gives us crucial insight into the NBFI sector in different jurisdictions. 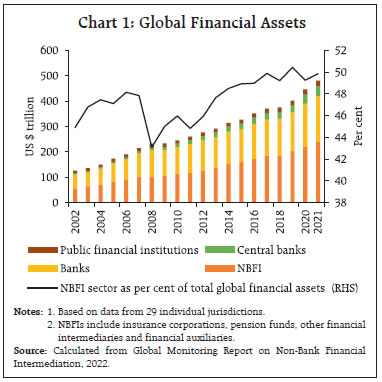 The outbreak of the COVID-19 pandemic necessitated a greater role for central banks, banks and public financial institutions to provide the necessary support and stability to the economy and financial markets. This resulted in a marginal decline in the share of NBFIs in the total financial assets in 2020. In 2021 however, NBFIs have again come to the forefront as a key driver of global financial assets, growing at 9 per cent, accounting for nearly half their size (Chart 1). Although the share of the NBFI sector has steadily risen over the years, banks continue to dominate the financial landscape in EMEs, accounting for nearly 57 per cent of their financial assets in 2021. On the contrary, among the AEs, it is the NBFI sector which is dominant. However, there exists considerable heterogeneity within both EMEs and AEs, with Brazil and South Africa having a more dominant NBFI sector, and AEs like France and Japan having bank-dominated economies (Chart 2). Globally, the United States (US) has the largest presence of NBFIs and along with other large AEs, it is home to the biggest and most interconnected NBFIs namely central counterparties, hedge funds and investment funds (Aldasoro, Huang , & Kemp, 2020). In order to better capture the extent of vulnerabilities posed by NBFIs due to their interconnectedness with other entities in the financial system, FSB has developed a ‘narrow measure’. This measure comprises those NBFIs which are engaged in credit intermediation activities that could give rise to bank-like financial stability risks. The measure is a composition of five economic functions (EF) or activities. In different jurisdictions around the globe, the narrow measure takes different forms, reflecting economy-specific requirements, policy support and existing legal and regulatory structures (FSB, 2022). As a result, within the narrow measure, EF1 has the largest share globally, attributable to the well-developed and complex financial market structures in AEs. In India, NBFIs take on a more straightforward intermediation role between ultimate lenders and ultimate borrowers. They cater to the finance needs of individuals and businesses who are unserved or under-served by the traditional banking sector, thereby facilitating financial inclusion and last-mile connectivity. Consequently, the non-banking sector in India is largely represented under EF2 (Table 1). 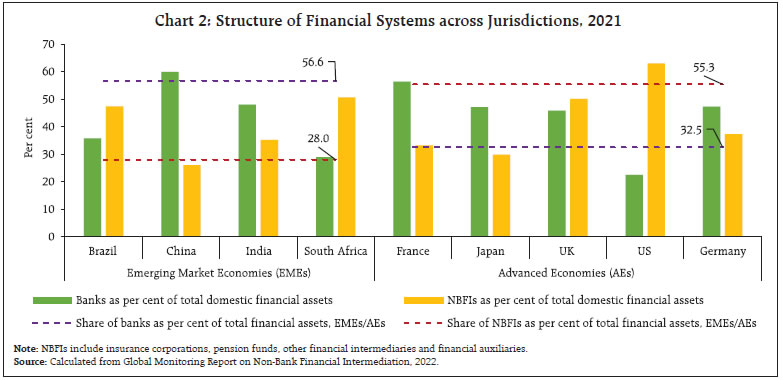 Globally, the narrow measure grew by 9.9 per cent in 2021, in line with the overall growth of the NBFI sector at 9 per cent, while in India the narrow measure expanded by 15.5 per cent, about 5 per cent lower than the growth in India’s NBFI sector (Chart 3). An outline of the NBFI sector in India is provided in the next section. 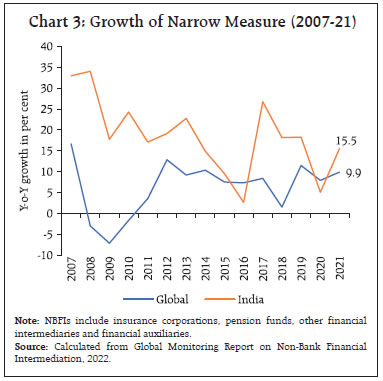 III. A General Overview of the NBFI Sector in India NBFIs in India comprise a varied range of entities operating on distinct business models. In order to systematically cover the wide dimension of the sector, we have grouped NBFIs under two sets, one regulated by the Reserve Bank and the remaining by other regulators, namely the Securities and Exchange Board of India (SEBI), Pension Fund Regulatory and Development Authority (PFRDA), Insurance Regulatory & Development Authority of India (IRDAI), the central or state governments among others (Chart 4). Among entities which come under the Reserve Bank’s regulatory purview, all India financial institutions (AIFIs) are the public financial institutions (FIs) that provide long-term funding to agriculture, foreign trade, small industries, housing finance companies (HFCs) and infrastructure. Asset reconstruction companies (ARCs) are specialised FIs that provide an institutional alternative for resolution of stressed assets by purchasing them from banks and other FIs. HFCs specialise in providing housing finance to individuals, cooperative societies and corporate bodies to support housing activity in the country. Primary dealers (PDs) ensure subscription to primary issuances of government securities (G-secs), besides acting as market makers in the G-sec market. NBFCs comprise mostly private limited companies which play an important role in credit delivery and financial intermediation. 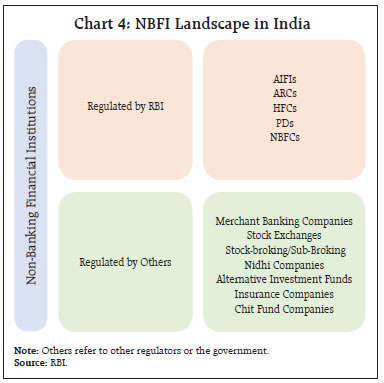 NBFCs could be dated back to the late 1940s when many small finance companies offered funding for the purchase of trucks (Kannan, Shanmugam, & Bhaduri, 2019). Over time they evolved into full-fledged FIs which developed expertise in penetrating market segments where banks have a thin presence, by offering traditional and innovative financial products and services which are tailored to the specific needs of the customer. Further, they have benefitted from differential regulation vis-à-vis banks, allowing them to foster innovation and offer healthy competition to banks, ultimately benefitting the end consumers. In view of the growing importance of the NBFC sector in India’s financial ecosystem, the rest of the article looks at the performance of select NBFCs in 2022-23 up to December 2022, grouping them in terms of the SBR framework which became effective from October 2022. Under the SBR framework, NBFCs are placed in one of the four layers namely, Top (NBFC-TL), Upper (NBFC-UL), Middle (NBFC-ML) or Base layer (NBFC-BL) [Chart 5]. For now, the top layer has been kept vacant and would be filled if the Bank perceives a substantial increase in the potential systemic risk from specific NBFCs in NBFC-UL. At end-March 2022, in terms of number, about 94 per cent NBFCs were under the NBFC-BL category, whereas in terms of asset size, NBFC-BL constituted merely 5 per cent of the total asset size (Chart 6). Given the nature of market concentration in the sector, where around 6 per cent of NBFCs contributed to 95 per cent of the asset size, the Reserve Bank prudently placed progressively stringent regulations for NBFC-UL and NBFC-ML. 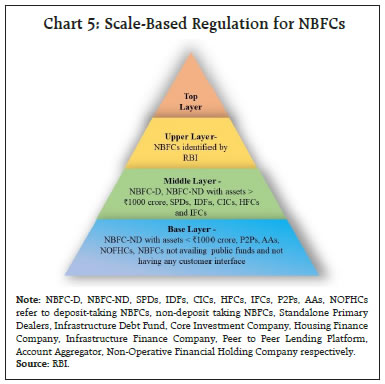 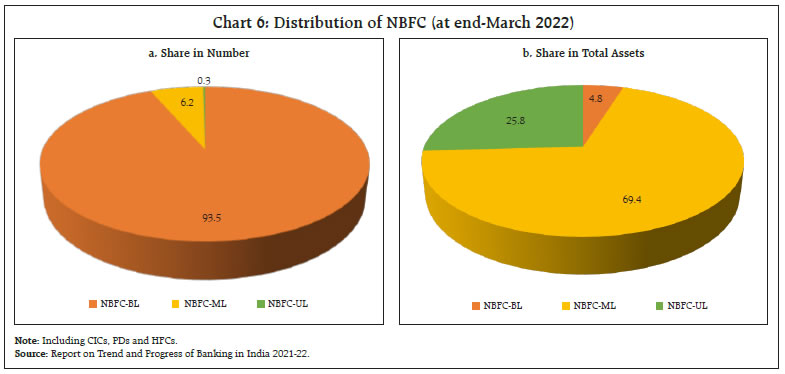 IV. A Balance-Sheet based Analysis of the NBFC Sector As on March 31, 2023, 9443 NBFCs3 were registered with the Reserve Bank. However, the analysis is based on a sample of 205 companies that have regularly filed returns in all quarters from December 2020 to December 2022. The sample4 represents around 91 per cent of the NBFC universe (in terms of asset size) at end-December 2022 on the eXtensible Business Reporting Language (XBRL) platform. The consolidated balance sheet of the sector grew at a double-digit level, however at a lower pace, at end-December 2022, than a year ago (Table 2). IV.1 Liabilities Structure of NBFCs NBFCs finance their operations mainly through borrowings from the market and banks, which account for around 75 per cent of their total borrowings. This makes them the largest net borrowers and as a result, they are intricately linked to the rest of the financial system (RBI, 2022). During the assessment period, NBFCs’ reliance on banks steadily increased due to low interest environment and lags in monetary policy transmission (Chart 7a). While NBFC-UL overwhelmingly rely on secured borrowings, NBFC-ML borrow significantly via unsecured means (Chart 7b). This is particularly true for big, government NBFCs, over two-thirds of whose borrowing is unsecured. NBFCs-D (deposit-taking) additionally have access to public deposits. These are term-deposits, which witnessed significant growth at end-December 2022 over a year ago. A deeper analysis highlights banks’ preference in lending to NBFCs in the upper layer. Direct bank borrowings by NBFC-UL have grown steadily in recent quarters, accounting for nearly half of their total borrowings at end-December 2022. NBFC-ML rely more on debenture issuances, though their bank borrowings have also grown in recent times. Further, NBFC-UL also seem to be more successful in raising short-term debt via CPs (Chart 8a and b). 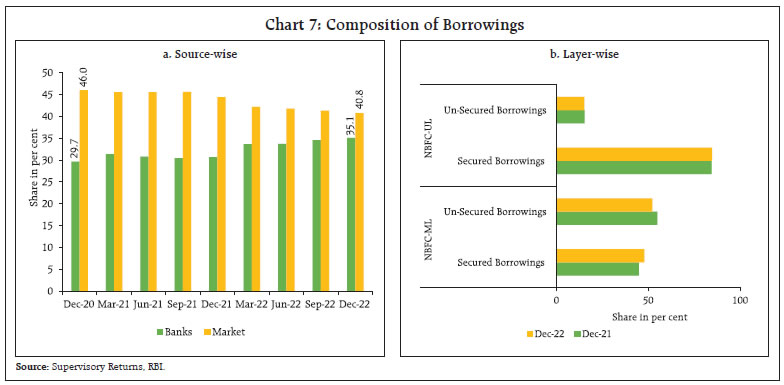 Apart from direct lending, banks are also one of the key subscribers of the debenture and CP issuances by NBFCs. In this way, their exposure to the NBFC sector is higher than the quantum indicated by direct lending. Banks’ exposure to NBFC-UL in particular, has been steadily rising, primarily due to a steep growth in their direct lending to these NBFCs in 2022-23 (up to December 2022). Bank subscription to debenture and CP issuances of NBFC-UL have also been growing at a robust pace, reflecting banks’ preference for instruments of bigger NBFCs, which in general have strong parentage and are under enhanced regulation (Chart 9). 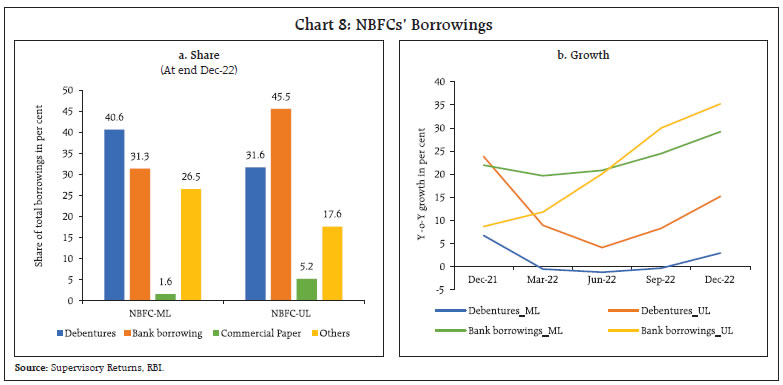 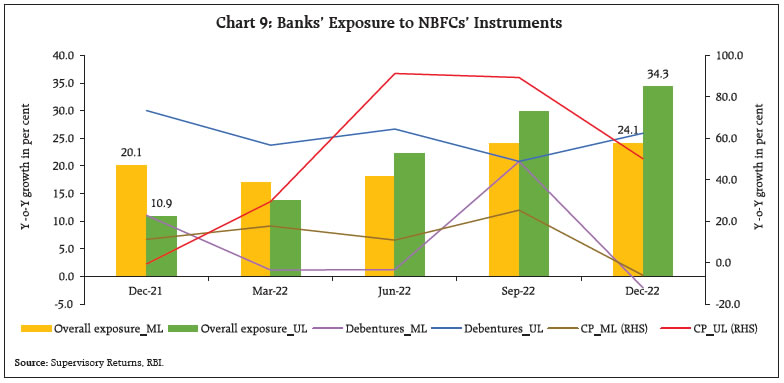 The debenture issuances of NBFCs are also subscribed by a host of other market participants apart from banks, with mutual funds, insurance companies, retail investors and pension funds being the other key players (Chart 10a). The CP market of NBFCs is dominated by mutual funds and banks, with the former cornering a preponderant share (Chart 10b). 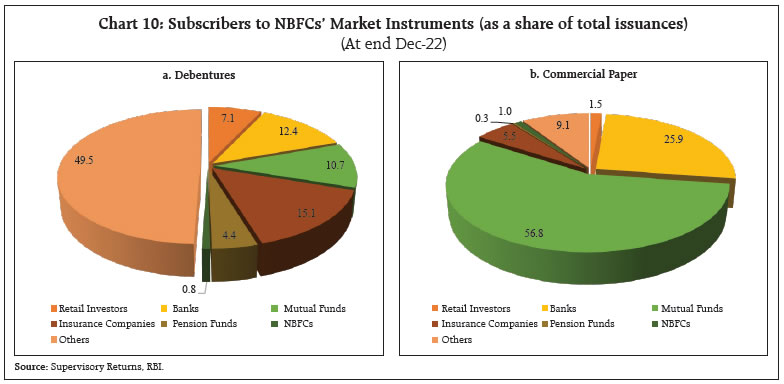 IV.2 Assets Structure of NBFCs Loans and advances followed by investments are the top two components on the asset side, with shares of 76 and 14 per cent of the aggregate asset size, respectively. Aggregate loans and advances grew at 13.8 per cent at end-December 2022, higher than a year ago. These loans are mainly secured and are of longer tenor (Chart 11a and b). Investment, as opposed to loans and advances, experienced slower growth, during the same period. IV.3 Sectoral Credit NBFCs play a crucial role in the Indian economy by complementing banks in deploying funds to various productive sectors. In descending order of their respective shares, the NBFC sector provided finance to industry, retail, services and agriculture at end-December 2022 (Chart 12a). Following a period of subdued spending post-pandemic, gross advances grew at a double-digit rate at end-December 2022, mainly led by growth in retail and service segments (Chart 12b). Scale-based analysis of the credit allocation reveals that NBFCs in the upper layer (all of which are privately owned) provide a major chunk of their gross advances to the retail segment, while the middle layer provided maximum credit to the industry. Government NBFCs that fall in the middle layer are large providers of credit to the infrastructure segment of industries (Table 3). Historically, NBFCs have been providing advances to unbanked/under-banked segments and furthering the objective of financial inclusion. Within industry and service sectors, NBFCs extended about seven per cent of their outstanding gross advances to the micro, small and medium enterprises (MSMEs), which grew significantly at end-December 2022 over end- December 2021. Within retail segment, vehicle loans and loans against gold occupied the top two positions in terms of their share in gross advances, at around 12 and 4 per cent, respectively. 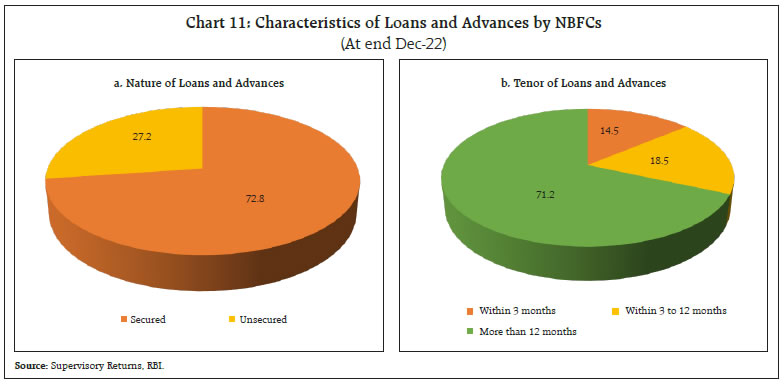 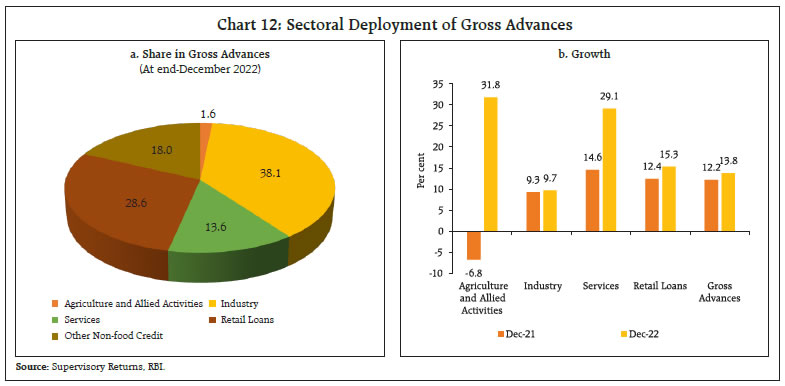 IV.4 Financial Performance, Asset Quality and Capital Adequacy NBFCs generate income mainly through the allocation of their funds. Fee-based income, on the other hand, contributes merely two per cent of their total income. On the expenditure side, interest expense, operating expenditure and expense incurred on writing-off bad debts are major contributors to the total expenditure. During Q3:2022-23, operating expenditure was the largest component of aggregate expenditure for NBFCs-UL. On the other hand, the share of interest expenses to total expenditure was higher for the middle layer than the upper layer. Profitability as indicated by return on assets (RoA), return on equity (RoE) and net interest margin (NIM) varied across the layers. At the sector level, all profitability indicators, except RoA, showed some moderation in Q3:2022-23 when compared with the same period last year. The upper layer, on the other hand, fared better when assessed over the same period (Chart 13). Better recovery practices and resumption of the economic activity helped in on-time servicing of loan obligations. Reduction in GNPA and NNPA ratios at end-December 2022, bodes well for the sector (Chart 14). The decline was mainly on account of low accretion, better recoveries, and write-offs. NBFC sector at an aggregate level maintained adequate capital, as the capital to risk-weighted assets ratio (CRAR) at 25.8 per cent was well above the regulatory requirement of 15 per cent at end-December 2022. A higher CRAR is indicative of a stronger financial position along with a lower default risk. Under SBR, NBFC-ML and NBFC-UL are required to make a realistic assessment of their risks and accordingly estimate their capital requirements. This has to be done in line with Internal Capital Adequacy Assessment Process (ICAAP), which is prescribed for commercial banks under Pillar 2 of Basel III regulations, however, not insisted upon for NBFCs. Additionally, NBFC-UL are required to maintain common equity tier I capital of at least nine per cent of risk-weighted assets. 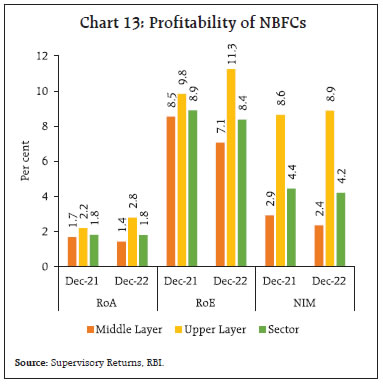 Since the IL&FS crisis in 2018, the balance sheet of the sector has been growing with sound financials. The crisis unfolded due to a default by a group company of a big CIC on its short-term liabilities, which led to a liquidity shock in the system. This led to a withdrawal by short-term creditors of NBFCs. Mutual funds which were a large player in the CP market, and had significant exposure to the sector, quickly reacted and reduced their exposure to NBFCs (Kulkarni, Neelima, & Sinha, 2023). In a reversal of events, mutual funds have again become the largest subscribers of CPs issued by NBFCs at end-December 2022, reflecting the return of market confidence in their businesses. In light of this event, the next section delves into the functioning of CICs. 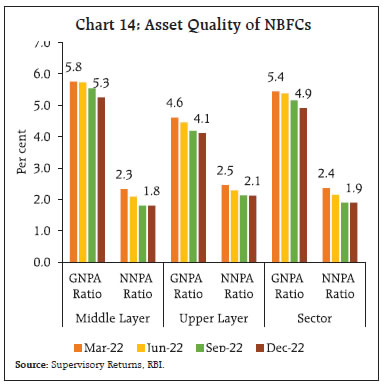 V. Core Investment Companies Core investment companies (CICs) are a niche segment within the NBFC universe that provide promoters with an avenue to hold stakes in group companies. In 2002, CICs were identified as investment companies whose only business was to invest in group companies. Subsequently, to limit the scope of trading in securities of group companies by CICs, a category called systemically important CICs (CIC-ND-SI) was introduced in 2010. Thus, by design, CICs were mandated to invest in group companies which in turn confined their exposure. Hence, differential prudential norms, as opposed to those applicable for other NBFCs which are primarily concerned with lending, became applicable to CICs, which were in line with their business model (RBI, 2019). Thus, they were only required to maintain adjusted net worth (ANW) such that it is at least 30 per cent of their aggregate risk weighted assets along with a leverage ratio not exceeding 2.5 times their ANW. Further principal business criteria for CICs mandated a minimum exposure5 of 90 per cent to group companies, of which 60 per cent should be in the form of equity investment (RBI, 2022). 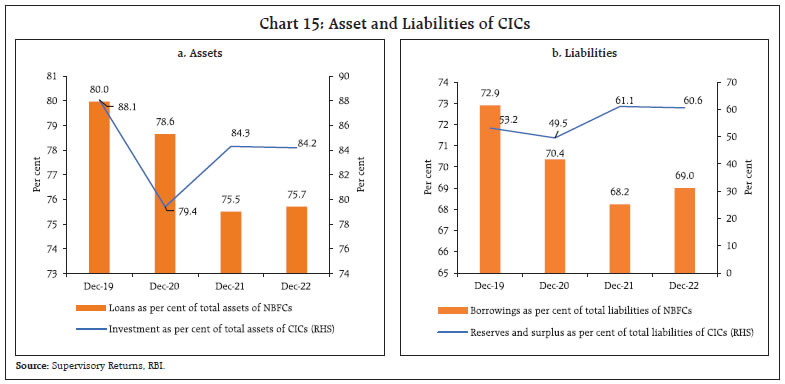 As the business activity of CICs is primarily investing, their investment in group companies stood at 84.2 per cent of total assets at end December 2022, whereas, for NBFCs, loans and advances had the highest share at 75.7 per cent during the same period (Chart 15a). On the liability side, for CICs, reserves and surplus were the largest constituents, accounting for 60.6 per cent of their total assets, while for NBFCs, borrowings were the largest component constituting 69 per cent of their total assets during the same period (Chart 15b). Further, the size of the balance sheet of CICs as a proportion of the balance sheet of NBFCs has been gradually rising, except for a dip in December 2022, reflecting the rising importance of CICs (Chart 16). The IL&FS episode of 2018 had a major impact on the Indian financial system and exposed the systemic risk posed by CICs. However, timely interventions by the government and the Reserve Bank restored confidence. Revised guidelines were issued after the submission of the Tapan Ray committee report which were aimed at monitoring the complex group structures and interconnectedness of CICs with financial systems and strengthening the corporate governance framework for them. Under the new guidelines, the definition of ANW was altered to address the issues of multiple gearing and excessive leveraging. Now, as applicable to other NBFCs, the capital contribution by a CIC in a step-down CIC, over and above 10 per cent of its owned funds, is deducted from its ANW. Further, to address the complexity in group structures and the existence of multiple CICs within a group, the number of layers of CICs within a group (including the parent CIC) has been restricted to two. Group Risk Management Committee (GRMC) has been mandated to address the issues of build-up of high leverage and other risks at the group level. CICs with asset size of more than ₹5,000 crore are also required to appoint a chief risk officer. To increase transparency and carry out due diligence, more corporate governance and disclosures have been stipulated. Also, CICs will have to prepare a consolidated financial statement as per provisions of the Companies Act, 2013 to provide a clear view of the financials of the group as a whole. To reduce the scope of misrepresentation, CICs that were not required to be registered with the Reserve Bank will now be termed as“unregistered CICs” instead of “exempted CICs”.6 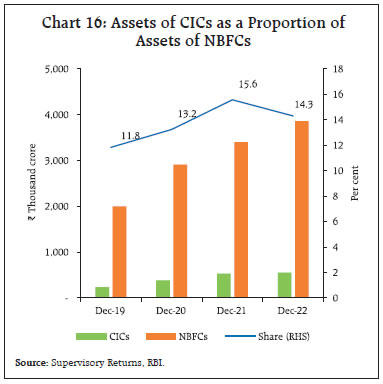 Going forward, the revised guidelines are expected to strengthen the sector by reducing the chances of failure which have financial stability implications. VI. Conclusion Innovation and dynamism are the hallmarks of the NBFI sector globally. Unlike in AEs, NBFCs in India take on a relatively more straightforward intermediation role between lenders and borrowers. Although the balance sheet size of the NBFC sector is less than one-fifth of SCBs, it is an important segment of the Indian financial landscape, complementing banks in providing credit to various productive sectors. Over the years, many NBFCs have grown and become systemically significant and in this context, scale-based regulation is both relevant and timely. At end Q3:2022-23, the consolidated balance sheet of the NBFC sector exhibited double digit growth. GNPA and NNPA ratios of the sector moderated on account of low accretion, better recoveries, and write-offs, as economic activity gained traction in the aftermath of the pandemic. The sector continues to maintain adequate provisions and strong capital buffers. In recent years, NBFCs have been leading in the rapidly evolving digital lending space, leveraging technology to reach wider audiences and streamline the user experience. When compared to banks that sanctioned 5.6 per cent of loans through digital channels, NBFCs sanctioned 60 per cent of loans digitally in 2019-20 (RBI, 2021). Riding on this momentum, new-age NBFCs are integrating Artificial Intelligence/Machine Learning (AI/ML) tools in their operations to improve business processes and decision-making. The Reserve Bank has also been encouraging NBFCs to adopt digital solutions for seamless customer interface. In this regard, the Bank has mandated NBFC-UL and NBFC-ML with 10 or more fixed point service delivery units to implement a ‘Core Financial Services Solution (CFSS)’, akin to the Core Banking Solution (CBS) adopted by banks, on or before September 30, 2025.7 Going forward, NBFCs need to diversify their funding sources, thereby reducing excessive reliance on bank borrowings. They need to develop strong governance and risk management standards and be more vigilant about cybercrimes, as the growing digital lending space offers huge opportunities, but also presents novel challenges. References Aldasoro, I., Huang , W., & Kemp, E. (2020). Cross-border links between banks and non-bank financial institutions. BIS Quarterly Review. Aramonte, S., Schrimpf, A., & Shin, H. S. (2022). Non-bank financial intermediaries and financial stability. BIS Working Papers No. 972. FSB. (2022). Global Monitoring Report on Non-Bank Financial Intermediation. Financial Stability Board. Kannan, R., Shanmugam, K. R., & Bhaduri, S. (2019). Non-Banking Financial Companies Role in India’s Development . Springer. Kulkarni, N., Neelima, K. M., & Sinha, S. (2023, August 29). Anatomy of a Liquidity Shock on Non-banks. CAFRAL, Working Paper. MFIN. (2022). Micrometer. MicroFinance Institutions Network. RBI. (2019). Report of the Working Group to Review the Regulatory and Supervisory Framework for Core Investment Companies. Reserve Bank of India. RBI. (2021). Report of the Working Group on Digital Lending including Lending through Online Platforms and Mobile Apps. Reserve Bank of India. RBI. (2022). Financial Stability Report. Reserve Bank of India. RBI. (2022). Master Direction - Core Investment Companies (Reserve Bank) Directions, 2016. ^ The authors are from the Department of Economic and Policy Research. This article is prepared under the guidance of Shri Gopinath Prahlada Char Tulasi, Adviser. The views expressed in this article are those of the authors and do not represent the views of the Reserve Bank of India. 1 RBI notification dated October 22, 2021, “Scale Based Regulation (SBR): A Revised Regulatory Framework for NBFCs”. 2 In this article NBFCs refer to non-banks regulated by the RBI, as defined under Section 45-IA of the RBI Act, 1934. 4 Includes 10 NBFC-UL and the rest are NBFC-ML, excluding CICs and PDs. CICs are covered in the next section. 5 Includes both loans and investments in group companies. 6 https://www.rbi.org.in/Scripts/NotificationUser.aspx?Id=11949&Mode=0 7 https://www.rbi.org.in/scripts/NotificationUser.aspx?Id=12247&Mode=0 |

ਇਸ ਪੇਜ ਨੂੰ ਸ਼ੇਅਰ ਕਰੋ:


ਭਾਰਤੀ ਰਿਜ਼ਰਵ ਬੈਂਕ ਮੋਬਾਈਲ ਐਪਲੀਕੇਸ਼ਨ ਇੰਸਟਾਲ ਕਰੋ ਅਤੇ ਨਵੀਨਤਮ ਖਬਰਾਂ ਤੱਕ ਤੇਜ਼ ਐਕਸੈਸ ਪ੍ਰਾਪਤ ਕਰੋ!
ਸਾਡੀ ਐਪ ਇੰਸਟਾਲ ਕਰਨ ਲਈ QR ਕੋਡ ਸਕੈਨ ਕਰੋ।


ਪੇਜ ਅੰਤਿਮ ਅੱਪਡੇਟ ਦੀ ਤਾਰੀਖ:


