 IST,
IST,
Coal Supply-Demand Situation and Implications
Coal sector in India has experienced demand-supply mismatches recently, owing to domestic and global factors. Coal being an important input for thermal power and some other important industries, its timely and adequate supply is imperative. With the government’s efforts, coal shortage has eased in recent weeks. In the medium to long term, increased transition to green sources of energy will reduce India’s dependence on coal and help meet India’s commitment made at COP26 in Glasgow. Coal sector in India in the recent period has grappled with demand-supply imbalances for a variety of reasons: sharp rise in power demand, supply disruptions caused by extended monsoon and reduction in imports on the back of steep rise in international prices. Demand for power increased rapidly with lifting of restrictions and recovery in economic activity, while heavy monsoon rains in September and the early part of October impacted mining of coals. International prices of coal increased sharply during the last few months with surge in global energy consumption leading to demand for coal outpacing its supply. Since coal is also used as a primary input in several industries such as steel, its shortage is bound to have a bearing on production of these industries. Against this backdrop, this article assesses the coal supply-demand situation and its implications. The evolving recent trends in domestic coal sector are discussed in Section II, while Section III contains the analysis of global coal consumption and energy. Section IV delineates the trends in connected sectors such as electricity and steel, and implications of coal shortages, if any, for these sectors. The concluding observations are furnished in Section V. II. Domestic Coal Sector – Recent Trends Coal production, which has a weightage of 10.33 per cent in index of eight core industries (ECI), posted a decelerated y-o-y growth of 8.0 per cent in September 2021 as compared with 21.0 per cent in the same month of last year and 20.6 per cent in August 2021, partly because strong revival of monsoon affected coal production as well as dispatches from mines. Coal production growth in October 2021 improved to 14.6 per cent before moderating to 7.4 per cent in November 2021 as evidenced by production of two major companies, viz. Coal India Ltd.(CIL), Singareni Collieries Company Ltd. (SCCL) and the captive mines. Accordingly, the growth in coal production as part of ECI is expected to record deceleration in November 2021. On a seasonally adjusted month-on-month (m-o-m) basis, coal production contracted by 5.0 per cent in September but expanded by 3.2 per cent in October before again contracting by 2.9 per cent in November 2021 (Chart 1). 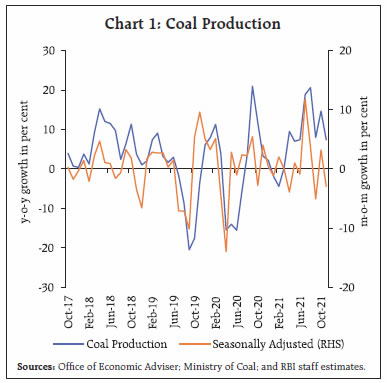 The monsoon season generally has an adverse impact on coal production but the impact was more severe this year as revealed by the comparison of seasonal factors derived using the index of coal within ECI (Table 1). Domestic coal consumption remains consistently above domestic production, needing substantial recourse to imports – around 25 per cent of the domestic consumption during 2018-21 (Chart 2 and Table 2). Indonesia, Australia and South Africa contribute about 80 per cent of the total coal imports. Prices of coal from these three markets inched up significantly in recent period; concomitantly, imports fell by 13.7 per cent (y-o-y) in August 2021, 9.1 per cent in September and 3.4 per cent in October. As a result, electricity generation in power plants which rely more on imported coal has been adversely impacted. As per the present import policy1, consumers can freely import coal considering their needs based on their commercial prudence. The Steel Authority of India Limited (SAIL) and other steel manufacturing units are importing coking coal mainly to bridge the gap between the requirement and indigenous availability and to improve the quality, while coal-based power plants, cement plants, captive power plants, sponge iron plants, industrial consumers and coal traders are importing non-coking coal. 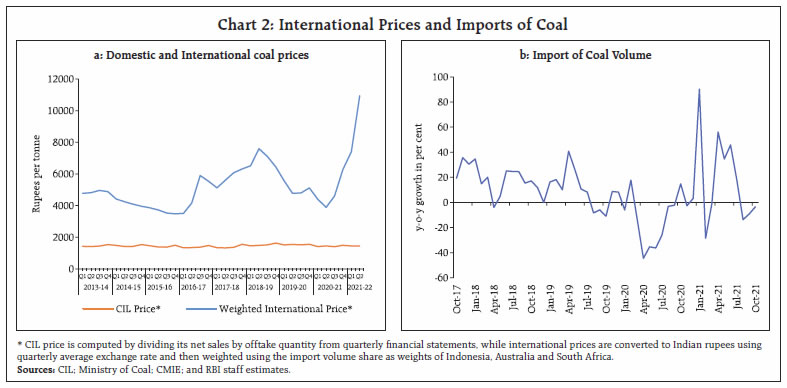 As on October 12, 2021, 115 thermal plants contributing about 85 per cent to total thermal power capacity were having coal stocks for up to 6 days; of these, 18 plants with about 11 per cent of total capacity had zero day of coal stock; 43 plants with about 32 per cent of total power capacity had 1-2 days of coal stocks; and 37 plants with about 29 per cent of total capacity had 3-4 days of coal stocks (Chart 3). Subsequently, the situation improved and the number of plants having up to 6 days of coal stocks declined to 82 (contributing about 60 per cent to total thermal power capacity) on October 30 and further to 58 on November 24 (contributing about 41 per cent to total thermal power capacity) (Chart 4). State-wise analysis indicates that as on November 24, the coal stock position in some states such as Haryana, Uttar Pradesh, and Bihar appear to be relatively comfortable compared with others such as Maharashtra, Rajasthan and West Bengal. Overdue payments to coal companies have also contributed to low coal stocks in case of some states, as per newspaper reports2. The government is ramping up coal supply from domestic sources to ease the situation. To further improve the supplies, the government has allowed power producers using domestic coal to import up to 10 per cent of their coal requirements. The government is also taking measures to augment production of coal over medium to long-term to meet the rapidly increasing demand domestically. In this regard, the government allowed participation of private sector by launching commercial coal mining recently and has also launched the next tranche of auction of coal mines involving 40 new mines. 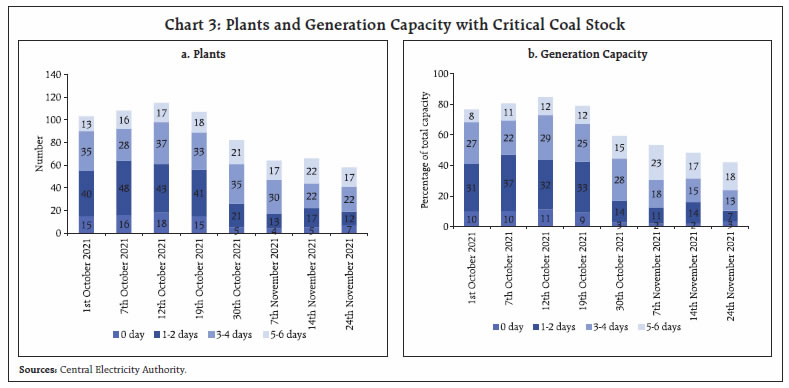 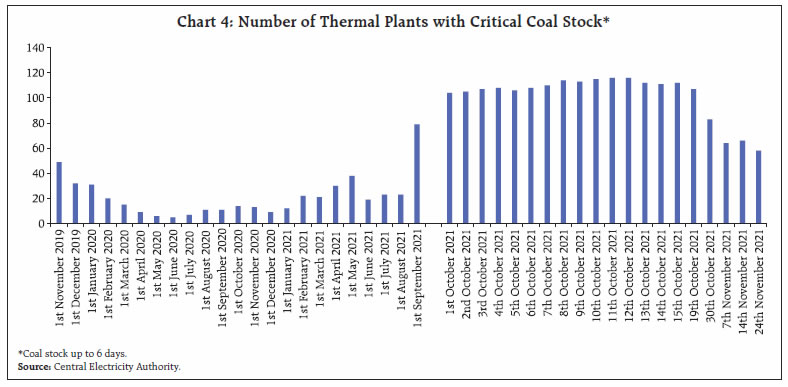 III. Global Consumption of Coal The energy demand globally dropped sharply in 2020 owing to contraction in economic activity in the face of restrictions imposed by countries to contain the virulent COVID-19 pandemic. As per the International Monetary Fund (IMF), world output declined by 3.1 per cent in 2020 with the output of advanced economies (AEs) and emerging market and developing economics (EMDEs) contracting by 4.5 per cent and 2.1 per cent, respectively. Global economic activity rebounded with ebbing of COVID pandemic, and world output is projected to expand by 5.9 per cent in 2021 – AEs are projected to grow by 5.2 per cent (USA by 6.0 per cent) and EMDEs by 6.4 per cent in 2021 (China by 8.5 per cent)3. Accordingly, world energy demand also soared in 2021 especially in the second half, and International Energy Agency (IEA) projects global energy demand to rebound by 4.0 per cent in 2021, exceeding the pre-COVID levels by 0.5 per cent (IEA, Global Energy Review, 2021). Coal remains one of the major sources of world energy, although global efforts under “Climate Change” are being made to increase the share of green energy (Chart 5). As per IEA, global coal demand dropped by 4.0 per cent in 2020, the biggest drop since World War II, due to economic downturn inflicted by Covid‑19 restrictions. With upturn in energy demand, global coal demand surged in 2021 as it constitutes a substantial part of total world energy consumption. IEA expects global coal demand to increase by 4.5 per cent in 2021, exceeding 2019 levels. China has been the largest consumer of coal followed by India and both economies have recovered strongly resulting in a significant jump in coal consumption for energy (Chart 6). Global coal supply is also expected to revive in 2021 but production challenges faced by Indonesia, the world’s biggest exporter of coal used for power generation because of heavy rains and stricter enforcement of domestic market obligations may have a bearing on it. The reports suggest that after a period of slowdown, China is also ramping up production of coal. At the same time, Chinese authorities have tightened regulation on traders and speculators, resulting in a sharp decline in domestic coal prices. 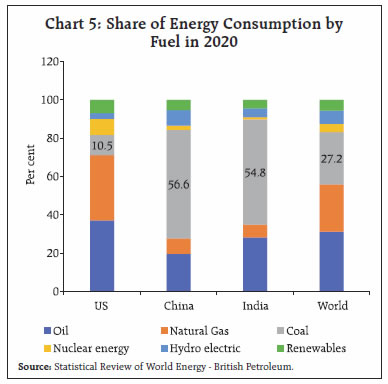  IV. Domestic Coal Use: Electricity and Other Sectors Electricity Electricity demand shot up sharply in recent months, mainly driven by pick-up in economic activity. As per the Ministry of Power, power consumption increased from an average of 107 Billion Unit (BU) per month during August-September 2019 (pre-COVID levels) to 124 BU per month in August-September 20214 (a rise of about 16 per cent). Electricity generation from all sources after peaking in August declined in September by 1.7 per cent y-o-y before expanding by 3.1 per cent in October and 1.6 per cent in November (Chart 7). In terms of contribution, hydel accounted for the entire y-o-y increase in total electricity generation in November. On seasonally adjusted m-o-m basis, total generation and thermal generation decreased, respectively, by 10.7 per cent and 12.5 per cent in September before expanding by 3.1 per cent and 0.9 per cent in October. In November, total generation and thermal generation again contracted by 1.7 per cent and 1.3 per cent, respectively. Nevertheless, thermal power continues to be the major contributor to total power generation, albeit its share declined from about 81 per cent in 2015-16 to about 75 per cent in 2020-21. The share of coal-based thermal generation in total generation also declined to 69 per cent in 2020-21 from 74 per cent in 2015-16 - in October 2021, coal-based thermal generation contributed about 75 per cent share. 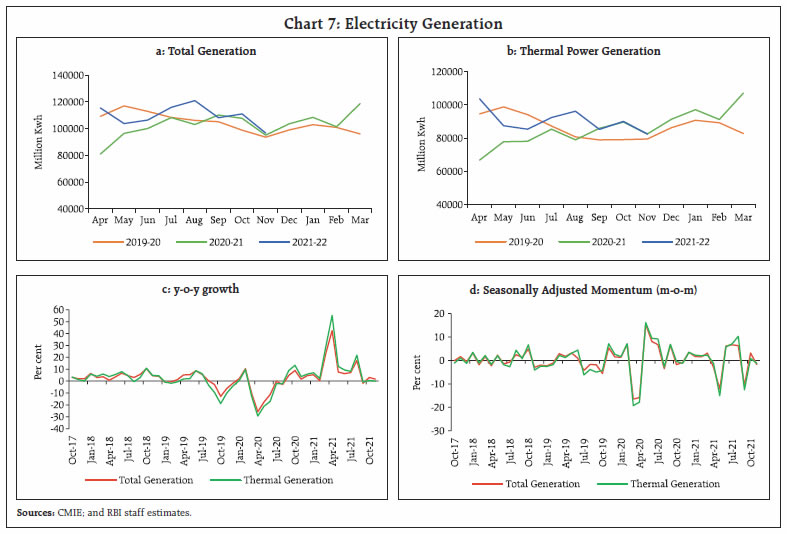 Water logging in coal bearing areas due to heavy rains in the month of September and early October hindered dispatches from coal mines, resulting in lower than normal stock accumulation by the thermal power plants in October. On top of that, lower coal imports due to surge in international coal prices also contributed to the demand supply mismatch. Imports of coal by thermal power plants dropped considerably by about 73 per cent y-o-y in September 2021 and 61 per cent in October 2021 (Table 3). Other sectors Apart from the electricity sector, iron and steel, non-metallic mineral products, and refined petroleum products are amongst the major industries which use coal and lignite as raw materials for their production. According to Supply and Use table, 2015-16, MOSPI5, ‘iron and steel’ consumes highest proportion of coal as input (Chart 8). Given the extent of usage as inputs, the coal shortage could have some negative transient impact on coal-intensive industries. Finished steel production witnessed a deceleration in y-o-y growth from 7.7 per cent in July to 6.2 per cent in September and further to 3.9 per cent in October (Chart 9). Steel consumption has also been declining (-3.2 per cent in September and -6.7 per cent in October), partly due to the slowdown in auto production in the face of shortages of semiconductors and chips, while demand for steel in construction activity remains robust. 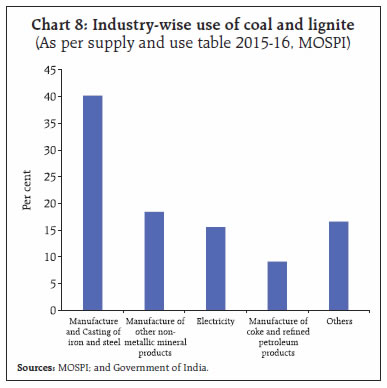 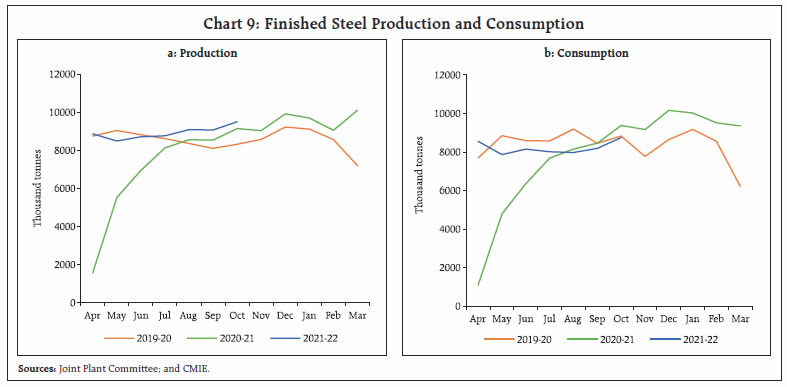 The demand-supply balance of coal especially in the case of thermal power sector has worsened in the last few months, owing to both monsoon-related disruptions in domestic supply and lower imports. At the same time, demand for electricity surged on the back of rebound in economic activity and seasonality. The government is ramping up coal supply to build sufficient stocks at thermal power plants and the situation has eased considerably in recent weeks. The demand-supply balance may, however, remain tight in the near-term due to dwindling imports in view of high import prices and elevated shipment freight rates and can be expected to ease due to waning of power demand in the winter months ahead. Given the large structural dependence on imports, the government is taking measures, including allowing participation of private sector by launching commercial coal mining recently, to augment production of coal over medium to long-term to meet domestic demand along with efforts to increasingly ramp up production of green sources (natural gas, renewables, and nuclear). Increased transition to green sources in the medium to long run will also help India to achieve climate change related targets under the Paris Agreement and recently concluded COP26 global climate summit in Glasgow. References Statistical Review of World Energy (2021). British Petroleum. https://www.bp.com/en/global/corporate/energy-economics/statistical-review-of-world-energy.html Global Energy Review (2021). International Energy Agency. https://www.iea.org/reports/global-energy-review-2021 * This article has been prepared by Kashyap Gupta, Bipul Kumar Ghosh, and Sunil Kumar from the Monetary Policy Department (MPD). The views expressed in the article are those of authors and do not represent the views of the organisation they belong to. The usual disclaimer applies. 1 https://coal.gov.in/en/major-statistics/import-and-export 2 https://indianexpress.com/article/business/clear-dues-to-coal-cos-govt-to-4-states-with-low-stock-high-thermal-capacities-7566897/ 3 IMF, World Economic Outlook October 2021 Update. |
ਪੇਜ ਅੰਤਿਮ ਅੱਪਡੇਟ ਦੀ ਤਾਰੀਖ:


