India’s Foreign Trade: 2008-09 (April 2008-February 2009)* Provisional data on India’s merchandise trade for April 2008-February 2009 and commodity-wise details for April-December 2008 have been recently released by the Directorate General of Commercial Intelligence and Statistics (DGCI&S). This article reviews India’s merchandise trade on the basis of these data.
Highlights
- India’s merchandise exports during February 2009 at US$ 11.9 billion recorded a sharp decline of 21.7 per cent as against a sizeable growth of 44.6 per cent registered in the corresponding month of the previous year. With exports recording a steady decline since October 2008, the overall exports during April 2008- February 2009 at US$ 154.9 billion decelerated to 6.4 per cent (28.4 per cent a year ago). This was on account of sharp deceleration in the export of textiles and textile products, gems and jewellery, leather products and agriculture and allied products and iron ore and minerals as these sectors have been adversely affected under the impact of demand recession, mainly in the developed regions, viz., the US and the EU.
- Imports during February 2009 at US$ 16.8 billion also showed substantial decline by 23.3 per cent for the second consecutive month during the current fiscal year 2008-09 so far, as against a sharp increase of 55.0 per cent in February 2008, mainly due to sharp decline in oil imports. The overall imports during April 2008- February 2009 at US$ 268.7 billion, showed a growth of 17.9 per cent lower than that registered during the comparable period of previous year (40.2 per cent) on account of deceleration in both oil and non-oil imports.
* Prepared in the Division of International Trade, Department of Economic Analysis and Policy. The previous issue of the article was published in RBI Bulletin, April 2009.
- Petroleum, oil and lubricants (POL) imports during April 2008-February 2009 at US$ 87.8 billion, grew by 24.4 per cent (35.3 per cent in April 2007-February 2008). However, the average price of Indian basket of crude oil during April 2008-February 2009 remained higher at US$ 86.4 per barrel than US$ 77.4 per barrel during April 2007-February 2008 due to the impact of higher international crude oil prices that prevailed during April-August 2008.
- Non-oil imports during April 2008-February 2009 at US$ 180.9 billion recorded a lower growth of 15.0 per cent than that of 42.6 per cent a year ago, mainly due to decline in the growth in imports of gold and silver, electronic goods and deceleration in transport equipments.
- Trade deficit during April 2008-February 2009 widened to US$ 113.8 billion, an increase of US$ 31.6 billion (38.4 per cent) over the corresponding period of the previous year.
India’s Merchandise Trade during 2008-09 (April 2008-February 2009)
Exports
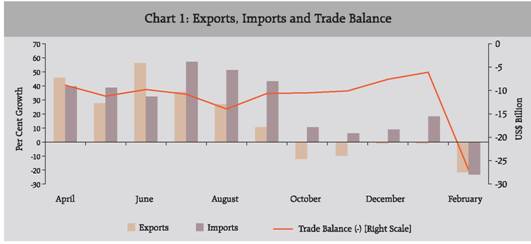
India’s merchandise exports, after recording a steady growth of 35.3 per cent during April-August 2008, showed deceleration in September 2008. However, from the subsequent month onwards, exports recorded decline, viz., (-12.1 per cent in October ), (-9.9 per cent in November), (-1.1 per cent in December), (-15.9 per cent in January 2009) and February 2009 (-21.7 per cent) mainly on account of global financial turmoil and economic slowdown (Chart 1). With the result, growth in overall exports during April 2008- February 2009 at US$ 154.9 billion moderated to 6.4 per cent as compared with 28.4 per cent during the corresponding period of previous year (Table 1). Exports of labour intensive sectors such as, gems and jewellery, textiles and textile products, agricultural and allied products and ores and minerals have registered decelerated growth as these sectors have been adversely affected under the impact of demand recession, mainly in the developed regions, viz., the US and the EU.
The detailed commodity-wise exports data released by DGCI&S for the period April-December 2008 revealed that engineering goods, chemicals and related products, petroleum products and agricultural and allied products maintained the largest share in exports, while ores and minerals, leather and manufactures, textile and textiles products and gems and jewellery reduced their shares (Table 2). Sector-wise, manufactured goods continued to maintain largest share at 65.3 per cent, followed by petroleum products (17.4 per cent) and primary products (14.8 per cent).
Table 1: India’s Merchandise Trade: April 2008-February 2009 |
(US $ billion) |
Items |
2007-08 R |
2008-09 P |
1 |
2 |
3 |
Exports |
|
145.6 |
|
154.9 |
| |
|
(28.4) |
|
(6.4) |
Oil Exports |
24.3 |
|
22.8* |
|
| |
(42.6) |
|
(16.7)* |
|
Non-Oil Exports |
121.3 |
|
107.9* |
|
| |
(25.9) |
|
(14.9)* |
|
Imports |
|
227.9 |
|
268.7 |
| |
|
(40.2) |
|
(17.9) |
Oil Imports |
70.6 |
|
87.8 |
|
| |
(35.3) |
|
(24.4) |
|
Non-Oil Imports |
157.3 |
|
181.0 |
|
| |
(42.6) |
|
(15.0) |
|
Trade Balance |
|
-82.2 |
|
-113.8 |
Oil Trade Balance |
-46.3 |
|
-56.9* |
|
Non-Oil Trade Balance |
-36.0 |
|
-47.8* |
|
* : Figures pertain to April-December. R : Revised. P : Provisional.
Note : Figures in parentheses show percentage change over the corresponding period of the previous year.
Source : Compiled from DGCI&S data. |
Table 2: India’s Exports of Principal Commodities |
(Percentage Shares) |
Commodity |
2006-07 |
2007-08 |
2007-08 |
2008-09 |
April-March |
April-December |
1 |
2 |
3 |
4 |
5 |
I. Primary products |
15.6 |
16.9 |
15.6 |
14.8 |
Agriculture and allied products |
10.0 |
11.3 |
10.5 |
10.5 |
Ores and minerals |
5.5 |
5.6 |
5.0 |
4.4 |
II. Manufactured goods |
67.2 |
63.2 |
64.6 |
65.3 |
Leatherand manufactures |
2.4 |
2.2 |
2.2 |
2.1 |
Chemicals and Related products |
13.7 |
13.0 |
13.1 |
13.5 |
Engineering goods |
23.4 |
22.9 |
23.0 |
26.3 |
Textile and textile products |
13.7 |
11.9 |
12.2 |
11.1 |
Gems and jewellery |
12.6 |
12.1 |
12.9 |
11.2 |
III.Petroleum products |
14.8 |
17.4 |
17.2 |
17.4 |
IV. Others |
2.4 |
2.5 |
2.6 |
2.5 |
Total Exports |
100.0 |
100.0 |
100.0 |
100.0 |
Source : Compiled from DGCI&S data. |
Exports of primary products during April-December 2008 at US$ 19.4 billion experienced a decelerated growth of 9.9 per cent from 33.6 per cent during the corresponding period of the previous year. Within primary products both agricultural and allied products (from 39.1 per cent to 14.6 per cent ) and ores and minerals (from 23.4 per cent to 0.1 per cent) witnessed a sharp deceleration in growth. Among agricultural and allied products, while tea, coffee, oil meal, tobacco, and cashew maintained the growth momentum, exports of rice, cotton raw incl.waste, spices, sugar and molasses and marine products continued to show deceleration /decline (Statement 3). Exports of manufactured goods during April-December 2008 at US$ 85.3 billion moderated by recording a growth of 16.3 per cent than 19.2 per cent a year ago. Within manufactured products, engineering goods and chemicals and related products exhibited higher growth, while other major items, viz., leather and manufactures, textiles and textile products and gems and jewellery witnessed a deceleration in growth.
Engineering goods exports during April-December 2008 at US$ 34.3 billion, which constituted more than one-fourth of total exports of India, continued to accelerate with 31.7 per cent growth, on top of 22.3 per cent growth reached a year ago, largely contributed by transport equipments, iron and steel and electronic goods. Exports of transport equipments to the major markets, such as Singapore, the US and the UK increased substantially on the back of strong export performance, particularly during the first half of the year.
Chemicals and related products exports during April-December 2008 at US$ 17.6 billion registered a higher growth of 18.7 per cent as compared with 17.6 per cent during the similar period of last year, on the back of basic chemicals, pharmaceuticals, plastic and linoleum and residual chemicals and allied products contributing the major chunk, while exports of rubber, glass and paints showed deceleration.
Exports by textiles and textile products, an important employment intensive sector, during April-December 2008 at US$ 14.6 billion sharply slowed down to 4.8 per cent (9.7 per cent a year ago). The major component, viz., the readymade garments, which accounted for about 50 per cent share in textiles and textile products exports, however, maintained its growth. The other major items, viz., cotton yarn, fabrics, madeups, manmade yarn, fabrics, etc., however, showed either deceleration or decline. Growth in the gems and jewellery exports, the other major employment intensive sector, at US$ 14.6 billion recorded a sharp deceleration to 0.1 per cent during April-December 2008 from 26.8 per cent a year ago, reflecting the recessionary conditions in the major export destinations for India’s gems and jewellery, viz., Hong Kong, the US and the UAE.
Petroleum products at US$ 22.8 billion, which constituted the second largest components of India’s exports, witnessed decelerated growth of 16.7 per cent during April- December 2008 as compared with 36.4 per cent a year ago (Statement 2).
Destination-wise, during April-December 2008, developing countries constituted highest share of 39.6 per cent of India’s exports, followed by OECD countries (38.8 per cent) and OPEC (19.7 per cent). The US with a share of 12.0 per cent continued to be the single largest importer of India’s exports, even while its share has declined over the previous year (13.4 per cent) [Table 3]. The other major market for India’s exports were the UAE (11.0 per cent), Singapore (5.0 per cent), China (4.7 per cent) and Hong Kong (3.7 per cent).
Table 3: India’s Exports to Principal Regions |
(Percentage Shares) |
Region |
2006-07 |
2007-08 |
2007-08 |
2008-09 |
April-March |
April-December |
1 |
2 |
3 |
4 |
5 |
I. OECD countries |
41.2 |
38.5 |
40.4 |
38.8 |
EU |
20.4 |
20.2 |
21.5 |
21.9 |
North America |
15.8 |
13.5 |
14.2 |
12.8 |
U.S. |
14.9 |
12.7 |
13.4 |
12.0 |
Asia and Oceania |
3.4 |
3.2 |
3.0 |
2.6 |
Other OECD countries |
1.6 |
1.6 |
1.7 |
1.5 |
II. OPEC |
16.4 |
16.4 |
17.1 |
19.7 |
III. Eastern Europe |
2.0 |
2.1 |
1.2 |
1.2 |
IV. Developing countries |
40.2 |
42.7 |
41.1 |
39.6 |
Asia |
29.8 |
31.6 |
30.2 |
28.8 |
SAARC |
5.1 |
5.9 |
5.5 |
5.1 |
Other Asian developing |
|
|
|
|
countries |
24.6 |
25.7 |
24.7 |
23.8 |
Africa |
7.0 |
7.7 |
7.7 |
7.0 |
Latin American countries |
3.4 |
3.4 |
3.1 |
3.8 |
V. Others / unspecified |
0.3 |
0.4 |
0.3 |
0.7 |
Total Exports |
100.0 |
100.0 |
100.0 |
100.0 |
Source : Compiled from DGCI&S data. |
Imports
India’s merchandise imports witnessed a growth of 44.9 per cent during April-September 2008, and thereafter it showed a deceleration, reflecting the slowdown in industrial activities due to global economic crisis. The overall imports during April 2008-Februray 2009 at US$ 268.7 billion, recorded a lower growth of 17.9 per cent than 40.2 per cent recorded a year ago. POL imports during April 2008-February 2009 at US$ 87.8 billion, also recorded a lower growth of 24.4 per cent (35.3 per cent a year ago), however, the effect of higher crude oil prices prevailed during the first half seems to have had a persisting impact. The average price of Indian basket of crude oil during April 2008-February 2009 was at US$ 86.4 per barrel (ranged between US$ 41.2 – 132.2 per barrel) was higher by 11.6 per cent than US$ 77.4 per barrel (ranged between US$ 65.2–91.8 per barrel) during April 2007- February 2008 (Table 4). Growth in non-oil imports during April 2008-February 2009 also decelerated considerably to 15.0 per cent from 42.6 per cent a year ago.
Commodity-wise imports data for the period April-December 2008 indicated 46.3 per cent growth in POL imports (24.0 per cent a year ago) under the impact of high crude oil prices prevailed in the past months, together with the continued increase of quantum of POL imports. During April–December 2008, POL imports in terms of volume, increased by 9.5 per cent as against an increase of 7.5 per cent during the similar period of the previous year. Non-POL imports witnessed moderation in growth (from 32.3 per cent to 29.8 per cent), mainly due to deceleration in imports of capital goods and gold and silver and bulk consumption goods (Statement 5). In terms of percentage share, POL increased to 33.8 per cent from 31.6 per cent, while the share of capital goods, gold and silver showed decline (Table 5).
Table 4: Trends in Crude Oil Prices |
(US $/barrel) |
Year |
Dubai |
Brent |
WTI* |
Indian Basket** |
1 |
2 |
3 |
4 |
5 |
2000-01 |
25.9 |
28.1 |
30.3 |
26.8 |
2001-02 |
21.8 |
23.2 |
24.1 |
22.4 |
2002-03 |
25.9 |
27.6 |
29.2 |
26.6 |
2003-04 |
26.9 |
29.0 |
31.4 |
27.8 |
2004-05 |
36.4 |
42.2 |
45.0 |
39.2 |
2005-06 |
53.4 |
58.0 |
59.9 |
55.7 |
2006-07 |
60.9 |
64.4 |
64.7 |
62.4 |
2007-08 |
77.3 |
82.4 |
82.3 |
79.5 |
April- February 2008 |
75.5 |
80.4 |
80.2 |
77.4 |
April- February 2009 |
83.6 |
88.2 |
89.2 |
86.4 |
February 08 |
90.0 |
94.8 |
95.4 |
93.8 |
February 09 |
43.1 |
43.2 |
39.2 |
41.8 |
* : West Texas Intermediate.
** : The composition of Indian basket of crude represents average of Oman and Dubai for sour grades and Brent (dated) for sweet grade in the ratio of 62.3:37.7 for 2008-09.
Sources: International Monetary Fund, International Financial Statistics, World Bank’s Commodity Price Pink Sheet for March 2009. |
Source-wise, during April-December 2008, OPEC had the highest share in India’s imports (33.9 per cent), followed by developing countries (31.9 per cent) and OECD countries (31.4 per cent) [Table 6]. China continued to be the single largest source of imports, with a share of 10.3 per cent in total imports, followed by Saudi Arabia (7.3 per cent), the UAE (6.5 per cent), the US (5.9 per cent), Switzerland (4.6 per cent) and Iran (4.3 per cent).
Table 5: Imports of Principal Commodities |
(Percentage Shares) |
Commodity |
2006-07 |
2007-08 |
2007-08 |
2008-09 |
(April- March) |
(April-December) |
1 |
2 |
3 |
4 |
5 |
1. Petroleum, crude and products |
30.8 |
31.7 |
31.6 |
33.8 |
2. Capital goods |
25.3 |
28.2 |
23.9 |
21.0 |
3. Gold and silver |
7.9 |
7.1 |
8.4 |
7.2 |
4.Organic and inorganic chemicals |
4.2 |
3.9 |
4.3 |
4.3 |
5. Coal, coke and briquettes, etc. |
2.5 |
2.6 |
2.7 |
3.6 |
6. Fertilizers |
1.7 |
2.2 |
2.4 |
5.3 |
7. Metalliferrous ores, metal scrap, etc. |
4.5 |
3.1 |
3.4 |
2.9 |
8. Iron and steel |
3.5 |
3.5 |
3.8 |
3.2 |
9. Pearls, precious and semi precious stone |
4.0 |
3.2 |
4.1 |
4.6 |
10. Others |
19.6 |
18.7 |
20.7 |
20.0 |
Total Imports |
100.0 |
100.0 |
100.0 |
100.0 |
Source : Compiled from DGCI&S. |
Table 6: Shares of Groups/Countries in India’s Imports |
(Percentage Shares) |
Group/Country |
2006-07 |
2007-08 |
2007-08 |
2008-09 |
April-March |
April-December |
1 |
2 |
3 |
4 |
5 |
I. O E C D Countries |
34.5 |
34.8 |
33.5 |
31.4 |
E U |
15.3 |
14.6 |
14.9 |
13.3 |
France |
2.3 |
2.5 |
1.2 |
1.0 |
Germany |
4.1 |
3.9 |
3.9 |
3.5 |
U K |
2.2 |
2.0 |
2.2 |
2.1 |
North America |
7.3 |
9.1 |
6.7 |
6.6 |
U S A |
6.3 |
8.4 |
5.8 |
5.9 |
Asia and Oceania |
6.4 |
5.8 |
6.2 |
5.9 |
Other O E C D Countries |
5.5 |
5.2 |
5.7 |
5.5 |
II. O P E C |
30.2 |
30.3 |
31.3 |
33.9 |
III. Eastern Europe |
2.7 |
2.1 |
1.7 |
2.4 |
IV. Developing Countries |
32.2 |
32.1 |
33.2 |
31.9 |
Asia |
25.5 |
25.5 |
27.0 |
25.6 |
S A A R C |
0.8 |
0.8 |
0.8 |
0.6 |
Other Asian |
|
|
|
|
Developing Countries |
24.7 |
24.7 |
26.2 |
25.0 |
Of which: |
|
|
|
|
People’s Rep of China |
9.4 |
10.8 |
11.5 |
10.3 |
Africa |
3.7 |
4.1 |
4.0 |
4.5 |
Latin American Countries |
3.0 |
2.4 |
2.3 |
1.8 |
Total Imports |
100.0 |
100.0 |
100.0 |
100.0 |
Source: Compiled from DGCI&S data. |
Trade Deficit
The overall trade deficit during April 2008-February 2009 amounted to US$ 113.8 billion, showing an increase of US$ 31.6 billion (38.4 per cent) over the trade deficit of US$ 82.2 billion during April 2007- February 2008. Trade deficit on oil account during April-December 2008 at US$ 56.8 billion, was higher by US$ 21.9 billion (62.7 per cent) than US$ 34.9 billion a year ago. Trade deficit on non-oil account during this period amounted to US$ 47.8 billion, higher by US$ 24.1 billion (101.4 per cent) than US$ 23.8 billion a year back.
Global Trade
The World Economic Outlook (WEO) [April 2009] projections assume that financial market stabilisation will take longer than previously envisaged, with strong efforts by policymakers. Even with determined policy actions, and anticipating a moderation in the rate of contraction from the second quarter onward, global activity is now projected to decline 1.3 per cent in 2009, a substantial downward revision from the January WEO Update. Incidentally, this is by far the deepest post–World War II recession. As the downturn is truly global: output per capita is projected to decline in countries representing three-quarters of the global economy, and growth in virtually all countries has decelerated sharply. Accordingly, growth is projected to reemerge only in 2010, at just 1.9 per cent. Earlier WTO projected that the world merchandise trade is likely to fall some 9 per cent in volume terms in 2009 (i.e., where price changes have been removed from the calculation), with developed economy exports falling by some 10 per cent on average and developing country exports shrinking by 2-3 per cent.
Based on the provisional data from IMF’s International Financial Statistics (IFS), world merchandise exports, in dollar terms, which grew on an average 22.7 per cent during January-September 2008, declined by 1.1 per cent in October 2008 and the declining trend continued in the subsequent months as well, viz., November (-15.0 per cent) and December (-13.6) (Chart 2). However, the average growth for the year 2008 (January–December) worked out to be 14.3 per cent (13.9 per cent for the corresponding period of previous year). Exports from emerging and developing economies for the same period during the year 2008 grew by 21.1 per cent (14.7 per cent for previous year), while that from advanced economies moderated to 11.3 per cent (from 14.7 per cent). The overall exports during January- December 2008 recorded a higher growth mainly because of the higher export growth recorded in the first half of 2008 (Table 7).

Table 7: Growth in Exports: Global Scenario |
(Per cent) |
Region/Country |
2006 |
2007 |
2008 |
| |
January-December |
1 |
2 |
3 |
4 |
World |
16.1 |
13.9 |
14.3 |
Advanced Economies |
12.6 |
13.5 |
11.3 |
US |
14.5 |
12.0 |
11.9 |
France |
10.1 |
12.3 |
9.8 |
Germany |
14.7 |
18.0 |
10.8 |
Japan |
9.2 |
7.8 |
12.3 |
Emerging and Developing |
|
|
|
Economies |
22.8 |
14.7 |
21.1 |
Singapore |
18.4 |
10.1 |
13.0 |
China |
27.2 |
25.6 |
17.3 |
India |
21.4 |
21.5 |
20.6 |
Indonesia |
19.0 |
14.7 |
24.4 |
Korea |
14.4 |
14.1 |
13.6 |
Malaysia |
14.0 |
9.6 |
19.1 |
Thailand |
18.7 |
17.0 |
12.9 |
Sources : (1) IMF (www.imfstatistics.org).
(2) DGCI&S for India. |
Commodity Prices
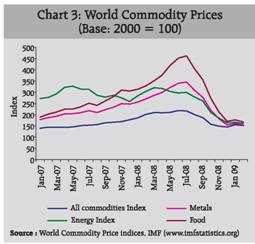
The world commodity prices persisted to show downward trend. According to IFS, world commodity prices decelerated since August 2008 and declined in all the subsequent months of 2008. The declining trend continued in the year 2009 as well, viz., in January(-16.4 per cent) and in February (-24.5 per cent). The decline was seen in energy, metal and food prices also. Energy prices declined by around 47.0 per cent, metals prices declined by 42.9 per cent and food prices by 49.0 per cent during February 2009 (Chart 3).
Statement 1: India’s Foreign Trade - February 2009 |
Year |
Exports |
Imports |
Trade Balance |
Total |
Oil |
Non-Oil |
Total |
Oil |
Non-Oil |
Total |
Oil |
Non-Oil |
1 |
2 |
3 |
4 |
5 |
6 |
7 |
8 |
9 |
10 |
Rupees crore |
2006-07 |
46,484 |
5,645 |
40,839 |
62,470 |
19,852 |
42,618 |
-15,986 |
-14,207 |
-1,779 |
| |
(15.8) |
(8.7) |
(16.9) |
(22.2) |
(9.0) |
(29.5) |
|
|
|
2007-08 R |
60,476 |
9,453 |
51,023 |
87,151 |
30,645 |
56,506 |
-26,675 |
-21,192 |
-5,483 |
| |
(30.1) |
(67.5) |
(24.9) |
(39.5) |
(54.4) |
(32.6) |
|
|
|
2008-09 P |
58,685 |
.. |
.. |
82,872 |
19,937 |
62,935 |
-24,187 |
|
|
| |
(-3.0) |
|
|
(-4.9) |
(-34.9) |
(11.4) |
|
|
|
US dollar million |
2006-07 |
10,527 |
1,278 |
9,248 |
14,147 |
4,496 |
9,651 |
-3,620 |
-3,217 |
-403 |
| |
(16.2) |
(9.1) |
(17.3) |
(22.6) |
(9.4) |
(30.0) |
|
|
|
2007-08 R |
15,221 |
2,379 |
12,842 |
21,934 |
7,713 |
14,222 |
-6,714 |
-5,334 |
-1,380 |
| |
(44.6) |
(86.1) |
(38.9) |
(55.0) |
(71.6) |
(47.4) |
(85.4) |
|
|
2008-09 P |
11,913 |
.. |
.. |
16,823 |
4,047 |
12,776 |
-4,910 |
|
|
| |
(-21.7) |
|
|
(-23.3) |
(-47.5) |
(-10.2) |
(-26.9) |
|
|
SDR million |
2006-07 |
7,030 |
854 |
6,176 |
9,448 |
3,002 |
6,446 |
-2,418 |
-2,149 |
-269 |
| |
(11.5) |
(4.6) |
(12.5) |
(17.6) |
(4.9) |
(24.6) |
|
|
|
2007-08 R |
9,600 |
1,501 |
8,100 |
13,835 |
4,865 |
8,970 |
-4,234 |
-3,364 |
-870 |
| |
(36.6) |
(75.8) |
(31.1) |
(46.4) |
(62.0) |
(39.2) |
|
|
|
| 2008-09 P |
8,022
|
.. |
.. |
11,328
|
2,725
|
8,603
|
-3,306
|
|
|
| |
(-16.4) |
|
|
(-18.1) |
(-44.0) |
(-4.1) |
|
|
|
P : Provisional. R : Revised. .. : Not available.
Note : Figures in brackets relate to percentage variation over the corresponding previous period. Source : DGCI & S. |
Statement 2: India’s Foreign Trade |
Year |
Exports |
Imports |
Trade Balance |
Total |
Oil |
Non-Oil |
Total |
Oil |
Non-Oil |
Total |
Oil |
Non-Oil |
1 |
2 |
3 |
4 |
5 |
6 |
7 |
8 |
9 |
10 |
April-March |
Rupees crore |
2005-06 |
4,56,418 |
51,533 |
4,04,885 |
6,60,409 |
1,94,640 |
4,65,769 |
-2,03,991 |
-1,43,107 |
-60,884 |
| |
(21.6) |
(64.1) |
(17.7) |
(31.8) |
(45.2) |
(26.9) |
|
|
|
2006-07 |
5,71,779 |
84,520 |
4,87,259 |
8,40,506 |
2,58,572 |
5,81,935 |
-2,68,727 |
-1,74,052 |
-94,675 |
| |
(25.3) |
(64.0) |
(20.3) |
(27.3) |
(32.8) |
(24.9) |
|
|
|
2007-08 R |
6,55,864 |
1,14,192 |
5,41,672 |
10,12,312 |
3,20,655 |
6,91,657 |
-3,56,448 |
-2,06,463 |
-1,49,985 |
| |
(14.7) |
(35.1) |
(11.2) |
(20.4) |
(24.0) |
(18.9) |
|
|
|
US dollar million |
2005-06 |
1,03,091 |
11,640 |
91,451 |
1,49,166 |
43,963 |
1,05,203 |
-46,075 |
-32,323 |
-13,752 |
| |
(23.4) |
(66.5) |
(19.5) |
(33.8) |
(47.3) |
(28.8) |
|
|
|
2006-07 |
1,26,361 |
18,679 |
1,07,683 |
1,85,749 |
57,144 |
1,28,606 |
-59,388 |
-38,465 |
-20,923 |
| |
(22.6) |
(60.5) |
(17.7) |
(24.5) |
(30.0) |
(22.2) |
|
|
|
2007-08 R |
1,62,904 |
28,363 |
1,34,541 |
2,51439 |
79,645 |
1,71,795 |
-88,535 |
-51,281 |
-37,254 |
| |
(28.9) |
(51.8) |
(24.9) |
(35.4) |
(39.4) |
(33.6) |
|
|
|
SDR million |
2005-06 |
70,774 |
7,991 |
62,783 |
1,02,405 |
30,182 |
72,224 |
-31,632 |
-22,191 |
-9,441 |
| |
(26.2) |
(70.3) |
(22.2) |
(36.8) |
(50.6) |
(31.7) |
|
|
|
2006-07 |
85,018 |
12,567 |
72,451 |
1,24,975 |
38,447 |
86,528 |
-39,957 |
-25,880 |
-14,077 |
| |
(20.1) |
(57.3) |
(15.4) |
(22.0) |
(27.4) |
(19.8) |
|
|
|
2007-08 R |
1,04,686 |
18,227 |
86,459 |
1,61,581 |
51,181 |
1,10,399 |
-56,895 |
-32,955 |
-23,940 |
| |
(23.1) |
(45.0) |
(19.3) |
(29.3) |
(33.1) |
(27.6) |
|
|
|
April-February |
Rupees crore |
2006-07 |
5,14,395 |
77,308 |
4,37,087 |
7,37,122 |
2,36,601 |
5,00,521 |
-2,22,728 |
-1,59,294 |
-63,434 |
| |
(27.0) |
(64.4) |
(22.1) |
(23.5) |
(34.5) |
(18.9) |
|
|
|
2007-08 R |
5,86,233 |
97,803 |
4,88,430 |
9,17,179 |
2,84,029 |
6,33,150 |
-3,30,946 |
-1,86,226 |
-1,44,720 |
| |
(14.0) |
(26.5) |
(11.7) |
(24.4) |
(20.0) |
(26.5) |
|
|
|
2008-09 P |
7,05,232 |
.. |
.. |
12,23,213 |
3,99,502 |
8,23,711 |
-5,17,981 |
|
|
| |
(20.3) |
|
|
(33.4) |
(40.7) |
(30.1) |
|
|
|
US dollar million |
2006-07 |
1,13,401 |
17,043 |
96,358 |
1,62,502 |
52,160 |
1,10,342 |
-49,101 |
-35,117 |
-13,984 |
| |
(23.9) |
(60.4) |
(19.1) |
(20.5) |
(31.2) |
(16.0) |
|
|
|
2007-08 R |
1,45,641 |
24,298 |
121,343 |
2,27,859 |
70,563 |
1,57,296 |
-82,219 |
-46,265 |
-35,954 |
| |
(28.4) |
(42.6) |
(25.9) |
(40.2) |
(35.3) |
(42.6) |
(67.4) |
|
|
2008-09 P |
1,54,937 |
22783* |
107926* |
2,68,736 |
87,769 |
1,80,966 |
-113,799 |
|
|
| |
(6.4) |
(16.7) |
(14.9) |
(17.9) |
(24.4) |
(15.0) |
(38.4) |
|
|
SDR million |
2006-07 |
76,393 |
11,481 |
64,912 |
1,09,470 |
35,138 |
74,332 |
-33,077 |
-23,657 |
-9,421 |
| |
(21.7) |
(57.6) |
(17.0) |
(18.4) |
(28.9) |
(14.0) |
|
|
|
2007-08 R |
94,017 |
15,685 |
78,332 |
1,47,093 |
45,551 |
1,01,542 |
-53,076 |
-29,866 |
-23,210 |
| |
(23.1) |
(36.6) |
(20.7) |
(34.4) |
(29.6) |
(36.6) |
|
|
|
2008-09 P |
99,545 |
.. |
.. |
1,72,660 |
56,391 |
1,16,269 |
-73,114 |
|
|
| |
(5.9) |
|
|
(17.4) |
(23.8) |
(14.5) |
|
|
|
P : Provisional. R : Revised. .. : Not available. * : Figures pertain to the month of April-December. Note : 1. Figures in brackets relate to percentage variation over the corresponding period of the previous year. 2. Data conversion has been done using period average exchange rates.
Source : DGCI & S. |
Statement 3: India’s Exports of Principal Commodities |
(US$ million) |
Commodity/Group |
April-December |
Percentage Variation |
2006-07 |
2007-08 |
2008-09 P |
(3)/(2) |
(4)/(3) |
1 |
2 |
3 |
4 |
5 |
6 |
I. |
Primary Products |
13,212.9 |
17,657.2 |
19,404.0 |
33.6 |
9.9 |
| |
|
(14.5) |
(15.6) |
(14.8) |
|
|
| |
A. |
Agricultural & Allied Products |
8,596.9 |
11,960.4 |
13,703.0 |
39.1 |
14.6 |
| |
|
of which : |
(9.4) |
(10.5) |
(10.5) |
|
|
| |
|
1. |
Tea |
355.5 |
383.7 |
450.8 |
7.9 |
17.5 |
| |
|
2. |
Coffee |
316.0 |
298.9 |
375.6 |
-5.4 |
25.7 |
| |
|
3. |
Rice |
1,075.7 |
1,881.7 |
1,811.0 |
74.9 |
-3.8 |
| |
|
4. |
Wheat |
7.6 |
0.1 |
0.1 |
-99.3 |
151.8 |
| |
|
5. |
Cotton Raw incl. Waste |
637.5 |
951.4 |
473.5 |
49.2 |
-50.2 |
| |
|
6. |
Tobacco |
272.3 |
353.8 |
537.5 |
29.9 |
51.9 |
| |
|
7. |
Cashew incl. CNSL |
413.5 |
398.2 |
511.4 |
-3.7 |
28.4 |
| |
|
8. |
Spices |
485.8 |
942.5 |
1,064.3 |
94.0 |
12.9 |
| |
|
9. |
Oil Meal |
724.8 |
1,061.9 |
1,770.7 |
46.5 |
66.7 |
| |
|
10. |
Marine Products |
1,245.8 |
1,376.3 |
1,224.3 |
10.5 |
-11.0 |
| |
|
11. |
Sugar & Mollases |
546.3 |
906.7 |
993.2 |
66.0 |
9.5 |
| |
B. |
Ores & Minerals |
4,616.0 |
5,696.8 |
5,700.9 |
23.4 |
0.1 |
| |
|
of which : |
(5.1) |
(5.0) |
(4.4) |
|
|
| |
|
1. |
Iron Ore |
2,569.1 |
3,295.4 |
3,177.8 |
28.3 |
-3.6 |
| |
|
2. |
Processed Minerals |
963.9 |
904.2 |
1,095.9 |
-6.2 |
21.2 |
II. |
Manufactured Goods |
61,537.7 |
73,327.9 |
85,310.7 |
19.2 |
16.3 |
| |
of which : |
(67.4) |
(64.6) |
(65.3) |
|
|
| |
A. |
Leather & Manufactures |
2,222.9 |
2,539.1 |
2,755.3 |
14.2 |
8.5 |
| |
B. |
Chemicals & Related Products |
12,643.1 |
14,867.8 |
17,644.9 |
17.6 |
18.7 |
| |
|
1. |
Basic Chemicals, Pharmaceuticals & Cosmetics |
7,930.8 |
9,726.0 |
11,991.1 |
22.6 |
23.3 |
| |
|
2. |
Plastic & Linoleum |
2,438.4 |
2,395.8 |
2,420.0 |
-1.7 |
1.0 |
| |
|
3. |
Rubber, Glass, Paints & Enamels etc., |
1,743.9 |
2,086.0 |
2,346.0 |
19.6 |
12.5 |
| |
|
4. |
Residual Chemicals & Allied Products |
530.0 |
660.0 |
887.8 |
24.5 |
34.5 |
| |
C. |
Engineering Goods |
21,315.8 |
26,068.4 |
34,336.4 |
22.3 |
31.7 |
| |
|
of which : |
|
|
|
|
|
| |
1. |
Manufactures of metals |
3,707.4 |
4,889.2 |
5,927.1 |
31.9 |
21.2 |
| |
2. |
Machinery & Instruments |
4,873.4 |
6,446.2 |
8,339.0 |
32.3 |
29.4 |
| |
3. |
Transport equipments |
3,333.5 |
4679.3 |
7,802.9 |
40.4 |
66.8 |
| |
4. |
Iron & steel |
3,868.6 |
3,870.7 |
4,825.7 |
0.1 |
24.7 |
| |
5. |
Electronic goods |
2,115.4 |
2,379.1 |
3,342.6 |
12.5 |
40.5 |
| |
D. |
Textiles and Textile Products |
12,653.8 |
13,882.3 |
14,554.6 |
9.7 |
4.8 |
| |
|
1. |
Cotton Yarn, Fabrics, Made-ups, etc., |
3,092.4 |
3,297.6 |
3,291.5 |
6.6 |
-0.2 |
| |
|
2. |
Natural Silk Yarn, Fabrics Madeups etc. (incl.silk waste) |
332.0 |
279.0 |
287.8 |
-16.0 |
3.2 |
| |
|
3. |
Manmade Yarn, Fabrics, Made-ups, etc., |
1,605.8 |
2,114.1 |
2,371.6 |
31.7 |
12.2 |
| |
|
4. |
Manmade Staple Fibre |
134.7 |
190.1 |
210.7 |
41.2 |
10.8 |
| |
|
5. |
Woolen Yarn, Fabrics, Madeups etc. |
63.1 |
65.5 |
78.2 |
3.8 |
19.4 |
| |
|
6. |
Readymade Garments |
6,400.6 |
6,851.2 |
7,348.2 |
7.0 |
7.3 |
| |
|
7. |
Jute & Jute Manufactures |
220.3 |
247.6 |
241.8 |
12.4 |
-2.3 |
| |
|
8. |
Coir & Coir Manufactures |
102.9 |
116.1 |
109.0 |
12.9 |
-6.2 |
| |
|
9. |
Carpets |
702.1 |
721.1 |
616.0 |
2.7 |
-14.6 |
| |
|
|
(a) Carpet Handmade |
677.8 |
708.2 |
609.0 |
4.5 |
-14.0 |
| |
|
|
(b) Carpet Millmade |
0.0 |
0.0 |
0.0 |
- |
- |
| |
|
|
(c) Silk Carpets |
24.3 |
13.0 |
7.0 |
-46.8 |
-45.7 |
| |
E. |
Gems & Jewellery |
11,518.6 |
14,600.7 |
14,614.2 |
26.8 |
0.1 |
| |
F. |
Handicrafts |
336.1 |
417.7 |
242.0 |
24.3 |
-42.1 |
III. |
Petroleum Products |
14,323.7 |
19,531.0 |
22,783.4 |
36.4 |
16.7 |
| |
(15.7) |
(17.2) |
(17.4) |
|
|
IV. |
Others |
2,287.0 |
2,959.1 |
3,211.8 |
29.4 |
8.5 |
| |
(2.5) |
(2.6) |
(2.5) |
|
|
Total Exports |
91,361.3 |
1,13,475.2 |
1,30,709.8 |
24.2 |
15.2 |
P : Provisional.
Note : Figures in brackets relate to percentage to total exports for the period.
Source : DGCI & S. |
Statement 4: Direction of India’s Foreign Trade - Exports |
(US$ million) |
Group/Country |
April-December |
Percentage |
Variation |
2006-07 |
2007-08 |
2008-09 P |
(3)/(2) |
(4)/(3) |
1 |
2 |
3 |
4 |
5 |
6 |
I. |
O E C D Countries |
38,503.9 |
45,808.2 |
50,739.9 |
19.0 |
10.8 |
| |
A. E U |
19,234.2 |
24,347.1 |
28,670.4 |
26.6 |
17.8 |
| |
of which: |
|
|
|
|
|
| |
1. |
Belgium |
2,428.3 |
2,998.4 |
3,462.6 |
23.5 |
15.5 |
| |
2. |
France |
1,512.1 |
1,835.4 |
2,171.4 |
21.4 |
18.3 |
| |
3. |
Germany |
2,810.6 |
3,626.1 |
4,359.2 |
29.0 |
20.2 |
| |
4. |
Italy |
2,585.7 |
2,781.7 |
2,844.8 |
7.6 |
2.3 |
| |
5. |
Netherland |
1,868.8 |
3,576.0 |
4,816.0 |
91.4 |
34.7 |
| |
6. |
U K |
4,093.9 |
4,826.5 |
4,781.7 |
17.9 |
-0.9 |
| |
B. |
North America |
14,763.2 |
16,159.7 |
16,676.0 |
9.5 |
3.2 |
| |
|
1. |
Canada |
824.2 |
904.2 |
1,006.8 |
9.7 |
11.3 |
| |
|
2. |
U S A |
13,939.03 |
15,255.47 |
15,669.27 |
9.4 |
2.7 |
| |
C. |
Asia and Oceania |
3,192.0 |
3,428.5 |
3,428.6 |
7.4 |
0.0 |
| |
of which: |
|
|
|
|
|
| |
1. |
Australia |
676.6 |
842.2 |
1,023.2 |
24.5 |
21.5 |
| |
2. |
Japan |
2,045.8 |
2,482.8 |
2,258.7 |
21.4 |
-9.0 |
| |
D. |
Other O E C D Countries |
1,314.5 |
1,872.9 |
1,964.9 |
42.5 |
4.9 |
| |
of which: |
|
|
|
|
|
| |
1. |
Switzerland |
315.5 |
427.7 |
507.2 |
35.6 |
18.6 |
II. |
O P E C |
15,451.4 |
19,366.2 |
25,711.7 |
25.3 |
32.8 |
| |
of which: |
|
|
|
|
|
| |
1. |
Indonesia |
1,428.2 |
1,325.4 |
1,816.0 |
-7.2 |
37.0 |
| |
2. |
Iran |
1,187.7 |
1,655.7 |
1,991.1 |
39.4 |
20.3 |
| |
3. |
Iraq |
139.3 |
162.1 |
265.2 |
16.3 |
63.6 |
| |
4. |
Kuwait |
462.9 |
472.6 |
602.8 |
2.1 |
27.6 |
| |
5. |
Saudi Arabia |
1,830.2 |
2,490.2 |
4,088.8 |
36.1 |
64.2 |
| |
6. |
U A E |
8,917.8 |
11,365.8 |
14,421.4 |
27.5 |
26.9 |
III. |
Eastern Europe |
1,119.0 |
1,321.1 |
1,558.6 |
18.1 |
18.0 |
| |
of which: |
|
|
|
|
|
| |
1 |
Russia |
638.5 |
664.6 |
806.4 |
4.1 |
21.3 |
IV. |
Developing Countries |
36,080.3 |
46,612.3 |
51,726.9 |
29.2 |
11.0 |
| |
of which: |
|
|
|
|
|
| |
A. |
Asia |
26,922.1 |
34,304.2 |
37,675.1 |
27.4 |
9.8 |
| |
|
a) |
S A A R C |
4,704.5 |
6,238.0 |
6,617.4 |
32.6 |
6.1 |
| |
|
|
1. |
Afghanistan |
127.4 |
175.6 |
284.6 |
37.8 |
62.1 |
| |
|
|
2. |
Bangladesh |
1,193.6 |
1,658.7 |
1,973.4 |
39.0 |
19.0 |
| |
|
|
3. |
Bhutan |
40.1 |
62.7 |
79.1 |
56.6 |
26.1 |
| |
|
|
4. |
Maldives |
49.2 |
61.9 |
80.2 |
25.8 |
29.5 |
| |
|
|
5. |
Nepal |
701.1 |
1,022.1 |
1,110.0 |
45.8 |
8.6 |
| |
|
|
6. |
Pakistan |
982.7 |
1,246.7 |
1,084.0 |
26.9 |
-13.1 |
| |
|
|
7. |
Sri Lanka |
1,610.4 |
2,010.2 |
2,006.1 |
24.8 |
-0.2 |
| |
b) |
Other Asian Developing Countries |
22,217.6 |
28,066.2 |
31,057.7 |
26.3 |
10.7 |
| |
|
of which: |
|
|
|
|
|
| |
|
1. |
People’s Rep of China |
5,589.7 |
6,805.2 |
6,123.3 |
21.7 |
-10.0 |
| |
|
2. |
Hong Kong |
3,257.1 |
4,450.5 |
4,846.0 |
36.6 |
8.9 |
| |
|
3. |
South Korea |
1,675.1 |
1,726.4 |
2,627.5 |
3.1 |
52.2 |
| |
|
4. |
Malaysia |
995.7 |
1,566.8 |
2,025.7 |
57.4 |
29.3 |
| |
|
5. |
Singapore |
4,768.8 |
5,141.6 |
6,507.4 |
7.8 |
26.6 |
| |
|
6. |
Thailand |
1,022.6 |
1,258.1 |
1,423.4 |
23.0 |
13.1 |
| |
B. |
Africa |
6,260.4 |
8,760.0 |
9,125.6 |
39.9 |
4.2 |
| |
|
of which: |
|
|
|
|
|
| |
|
1. |
Benin |
113.1 |
189.8 |
159.0 |
67.8 |
-16.2 |
| |
|
2. |
Egypt Arab Republic |
508.3 |
961.5 |
1,308.3 |
89.2 |
36.1 |
| |
|
3. |
Kenya |
1,039.0 |
1,041.5 |
1,094.3 |
0.2 |
5.1 |
| |
|
4. |
South Africa |
1,691.9 |
1,725.3 |
1,556.3 |
2.0 |
-9.8 |
| |
|
5. |
Sudan |
300.3 |
277.1 |
331.9 |
-7.7 |
19.8 |
| |
|
6. |
Tanzania |
210.2 |
391.1 |
849.7 |
86.1 |
117.2 |
| |
|
7. |
Zambia |
81.3 |
108.3 |
78.6 |
33.1 |
-27.4 |
| |
C. |
Latin American Countries |
2,897.7 |
3,548.1 |
4,926.2 |
22.4 |
38.8 |
V. |
Others |
88.4 |
217.0 |
403.5 |
145.3 |
85.9 |
VI. |
Unspecified |
118.2 |
150.4 |
569.1 |
27.2 |
278.5 |
Total Exports |
91,361.3 |
1,13,475.2 |
1,30,709.8 |
24.2 |
15.2 |
P : Provisional. Source : DGCI & S. |
Statement 5: India’s Imports of Principal Commodities |
(US$ million) |
Commodity/Group |
April-December |
Percentage |
Variation |
2006-07 |
2007-08 |
2008-09 P |
(3)/(2) |
(4)/(3) |
1 |
2 |
3 |
4 |
5 |
6 |
I. |
Bulk Imports |
63,427.4 |
78,910.2 |
1,15,377.1 |
24.4 |
46.2 |
| |
|
|
|
(47.2) |
(45.8) |
(49.0) |
|
|
| |
A. Petroleum, Petroleum Products |
43,871.2 |
54,420.2 |
79,635.3 |
24.0 |
46.3 |
| |
|
& Related Material |
(32.6) |
(31.6) |
(33.8) |
|
|
| |
B. |
Bulk Consumption Goods |
2,603.3 |
3,324.3 |
3,493.9 |
27.7 |
5.1 |
| |
|
1. |
Wheat |
304.1 |
372.3 |
0.0 |
22.4 |
-100.0 |
| |
|
2. |
Cereals & Cereal Preparations |
26.2 |
28.5 |
34.2 |
8.9 |
19.9 |
| |
|
3. |
Edible Oil |
1,661.9 |
1,979.2 |
2,453.5 |
19.1 |
24.0 |
| |
|
4. |
Pulses |
610.4 |
943.8 |
977.5 |
54.6 |
3.6 |
| |
|
5. |
Sugar |
0.7 |
0.5 |
28.8 |
-27.4 |
5548.2 |
| |
C. |
Other Bulk Items |
16,952.8 |
21,165.7 |
32,247.9 |
24.9 |
52.4 |
| |
|
1. |
Fertilisers |
2,628.2 |
4,123.4 |
12,407.0 |
56.9 |
200.9 |
| |
|
|
a) Crude |
260.5 |
336.4 |
843.7 |
29.2 |
150.8 |
| |
|
|
b) Sulphur & Unroasted Iron Pyrites |
78.3 |
200.0 |
630.1 |
155.6 |
215.0 |
| |
|
|
c) Manufactured |
2,289.5 |
3,587.0 |
10,933.2 |
56.7 |
204.8 |
| |
|
2. |
Non-Ferrous Metals |
1,908.5 |
2,521.5 |
2,659.8 |
32.1 |
5.5 |
| |
|
3. |
Paper, Paperboard & Mgfd. incl. Newsprint |
934.3 |
1,031.9 |
1,493.1 |
10.4 |
44.7 |
| |
|
4. |
Crude Rubber, incl. Synthetic & Reclaimed |
439.7 |
565.4 |
781.4 |
28.6 |
38.2 |
| |
|
5. |
Pulp & Waste Paper |
466.2 |
575.8 |
655.5 |
23.5 |
13.8 |
| |
|
6. |
Metalliferrous Ores & Metal Scrap |
6,058.8 |
5,810.4 |
6,741.1 |
-4.1 |
16.0 |
| |
|
7. |
Iron & Steel |
4,517.1 |
6,537.3 |
7,510.0 |
44.7 |
14.9 |
II. |
Non-Bulk Imports |
71,091.8 |
93,209.3 |
1,20,032.5 |
31.1 |
28.8 |
| |
|
|
|
(52.8) |
(54.2) |
(51.0) |
|
|
| |
A. |
Capital Goods |
30,886.5 |
41,056.4 |
49,501.3 |
32.9 |
20.6 |
| |
|
1. |
Manufactures of Metals |
1,119.4 |
1,875.0 |
2,550.7 |
67.5 |
36.0 |
| |
|
2. |
Machine Tools |
1,062.4 |
1,538.9 |
1,880.0 |
44.8 |
22.2 |
| |
|
3. |
Machinery except Electrical & Electronics |
9,902.0 |
13,485.5 |
16,351.7 |
36.2 |
21.3 |
| |
|
4. |
Electrical Machinery except Electronics |
1,446.3 |
2,067.5 |
2,587.1 |
43.0 |
25.1 |
| |
|
5. |
Electronic Goods incl. Computer Software |
12,628.5 |
16,068.1 |
17,474.7 |
27.2 |
8.8 |
| |
|
6. |
Transport Equipments |
3,372.3 |
5,114.1 |
6,332.6 |
51.6 |
23.8 |
| |
|
7. |
Project Goods |
1,355.6 |
907.3 |
2,324.5 |
-33.1 |
156.2 |
| |
B. |
Mainly Export Related Items |
13,703.1 |
16,588.7 |
23,359.8 |
21.1 |
40.8 |
| |
|
1. |
Pearls, Precious & Semi-Precious Stones |
5,907.8 |
7,137.2 |
10,752.1 |
20.8 |
50.6 |
| |
|
2. |
Chemicals, Organic & Inorganic |
5,824.4 |
7,327.2 |
10,157.3 |
25.8 |
38.6 |
| |
|
3. |
Textile Yarn, Fabric, etc. |
1,649.4 |
1,835.6 |
1,948.4 |
11.3 |
6.1 |
| |
|
4. |
Cashew Nuts, raw |
321.4 |
288.7 |
502.1 |
-10.2 |
73.9 |
| |
C. |
Others |
26,502.2 |
35,564.2 |
47,171.5 |
34.2 |
32.6 |
| |
|
of which : |
|
|
|
|
|
| |
|
1. |
Gold & Silver |
10,711.6 |
14,410.0 |
17,033.3 |
34.5 |
18.2 |
| |
|
2. |
Artificial Resins & Plastic Materials |
1,907.3 |
2,670.2 |
2,937.8 |
40.0 |
10.0 |
| |
|
3. |
Professional Instruments etc. except electrical |
1,710.2 |
2,222.9 |
3,147.7 |
30.0 |
41.6 |
| |
|
4. |
Coal, Coke & Briquittes etc. |
3,275.2 |
4,597.8 |
8,402.0 |
40.4 |
82.7 |
| |
|
5. |
Medicinal & Pharmaceutical Products |
882.7 |
1,201.7 |
1,394.0 |
36.1 |
16.0 |
| |
|
6. |
Chemical Materials & Products |
1,004.3 |
1,161.5 |
1,568.4 |
15.7 |
35.0 |
| |
|
7. |
Non-Metallic Mineral Manufactures |
576.1 |
742.3 |
936.3 |
28.9 |
26.1 |
Total Imports |
1,34,519.2 |
1,72,119.5 |
2,35,409.6 |
28.0 |
36.8 |
Memo items: |
Non-oil imports |
90,648.0 |
1,17,699.3 |
1,55,774.3 |
29.8 |
32.3 |
Non-oil imports excl. Gold & Silver |
79,936.4 |
1,03,289.3 |
1,38,740.9 |
29.2 |
34.3 |
Mainly industrial input* |
73,333.4 |
94,155.1 |
1,21,166.1 |
28.4 |
28.7 |
P : Provisional.
* : Non oil imports net of gold and silver, bulk consumption goods, manufactured fertilizers and professional instruments.
Note : Figures in brackets relate to percentage to total imports for the period.
Source : DGCI & S. |
Statement 6: Direction of India’s Foreign Trade-Imports |
(US$ million) |
Group / Country |
April-December |
Percentage |
Variation |
2006-07 |
2007-08 |
2008-09 P |
(3)/(2) |
(4)/(3) |
1 |
2 |
3 |
4 |
5 |
6 |
I. |
O E C D Countries |
44,471.1 |
57,619.0 |
73,845.8 |
29.6 |
28.2 |
| |
A. |
E U |
20,056.9 |
25,634.5 |
31,289.7 |
27.8 |
22.1 |
| |
|
of which: |
|
|
|
|
|
| |
|
1. |
Belgium |
3,188.6 |
3,933.1 |
4,735.1 |
23.3 |
20.4 |
| |
|
2. |
France |
1,596.1 |
1,989.3 |
2,349.8 |
24.6 |
18.1 |
| |
|
3. |
Germany |
5,457.0 |
6,760.2 |
8,295.8 |
23.9 |
22.7 |
| |
|
4. |
Italy |
1,916.1 |
2,751.5 |
3,427.7 |
43.6 |
24.6 |
| |
|
5. |
Netherland |
815.3 |
1,425.5 |
1,384.2 |
74.8 |
-2.9 |
| |
|
6. |
U K |
3,103.1 |
3,810.6 |
5,045.5 |
22.8 |
32.4 |
| |
B. |
North America |
8,734.1 |
11,486.3 |
15,648.0 |
31.5 |
36.2 |
| |
1. |
Canada |
1,032.3 |
1,432.8 |
1,780.7 |
38.8 |
24.3 |
| |
2. |
U S A |
7,701.8 |
10,053.5 |
13,867.3 |
30.5 |
37.9 |
| |
C. |
Asia and Oceania |
8,727.9 |
10,731.3 |
13,927.3 |
23.0 |
29.8 |
| |
|
of which: |
|
|
|
|
|
| |
|
1. |
Australia |
5,242.8 |
5,930.9 |
7,582.4 |
13.1 |
27.8 |
| |
|
2. |
Japan |
3,286.5 |
4,551.3 |
5,968.3 |
38.5 |
31.1 |
| |
D. |
Other O E C D Countries |
6,952.3 |
9,767.0 |
12,980.7 |
40.5 |
32.9 |
| |
|
of which: |
|
|
|
|
|
| |
|
1. |
Switzerland |
6,333.7 |
7,837.8 |
10,796.0 |
23.7 |
37.7 |
II. |
O P E C |
42,732.3 |
53,923.9 |
79,830.6 |
26.2 |
48.0 |
| |
of which: |
|
|
|
|
|
| |
1. |
Indonesia |
2,803.3 |
3,484.2 |
5,044.5 |
24.3 |
44.8 |
| |
2. |
Iran |
5,702.4 |
7,254.1 |
10,101.5 |
27.2 |
39.3 |
| |
3. |
Iraq |
4,455.1 |
4,397.4 |
7,042.5 |
-1.3 |
60.1 |
| |
4. |
Kuwait |
4,403.7 |
4,883.8 |
7,915.3 |
10.9 |
62.1 |
| |
5. |
Saudi Arabia |
10,262.8 |
13,511.8 |
17,072.8 |
31.7 |
26.4 |
| |
6. |
U A E |
6,498.1 |
9,691.0 |
15,370.1 |
49.1 |
58.6 |
III. |
Eastern Europe |
2,717.9 |
2,872.3 |
5,611.8 |
5.7 |
95.4 |
| |
of which: |
|
|
|
|
|
| |
1 |
Russia |
1,515.1 |
1,858.5 |
3,775.9 |
22.7 |
103.2 |
IV. |
Developing Countries |
44,022.3 |
57,116.7 |
75,096.9 |
29.7 |
31.5 |
| |
of which: |
|
|
|
|
|
| |
A. |
Asia |
35,196.3 |
46,429.7 |
60,277.3 |
31.9 |
29.8 |
| |
|
a) |
S A A R C |
1,140.3 |
1,368.0 |
1,407.6 |
20.0 |
2.9 |
| |
|
|
1. |
Afghanistan |
30.9 |
74.0 |
97.6 |
139.1 |
31.9 |
| |
|
|
2. |
Bangladesh |
184.5 |
192.6 |
263.0 |
4.4 |
36.5 |
| |
|
|
3. |
Bhutan |
92.0 |
154.0 |
119.1 |
67.3 |
-22.7 |
| |
|
|
4. |
Maldives |
2.2 |
2.8 |
3.3 |
23.5 |
17.8 |
| |
|
|
5. |
Nepal |
229.5 |
402.5 |
369.2 |
75.4 |
-8.3 |
| |
|
|
6. |
Pakistan |
247.8 |
211.9 |
293.1 |
-14.5 |
38.3 |
| |
|
|
7 |
Sri Lanka |
353.4 |
330.3 |
262.3 |
-6.5 |
-20.6 |
| |
|
b) |
Other Asian Developing Countries |
34,056.0 |
45,061.7 |
58,869.7 |
32.3 |
30.6 |
| |
|
|
of which: |
|
|
|
|
|
| |
|
|
1. |
People’s Rep of China |
12,640.1 |
19,854.7 |
24,169.4 |
57.1 |
21.7 |
| |
|
|
2. |
Hong Kong |
1,842.6 |
2,192.0 |
4,397.2 |
19.0 |
100.6 |
| |
|
|
3. |
South Korea |
3,572.2 |
4,288.5 |
6,536.8 |
20.1 |
52.4 |
| |
|
|
4. |
Malaysia |
4,013.9 |
4,464.5 |
5,866.4 |
11.2 |
31.4 |
| |
|
|
5. |
Singapore |
4,176.9 |
5,620.2 |
5,823.8 |
34.6 |
3.6 |
| |
|
|
6. |
Thailand |
1,246.6 |
1,719.4 |
2,065.4 |
37.9 |
20.1 |
| |
B. |
Africa |
5,049.7 |
6,802.5 |
10,540.2 |
34.7 |
54.9 |
| |
|
of which: |
|
|
|
|
|
| |
|
1. |
Benin |
71.5 |
62.7 |
106.4 |
-12.3 |
69.7 |
| |
|
2. |
Egypt Arab Republic |
1,368.4 |
1,525.8 |
1,612.0 |
11.5 |
5.6 |
| |
|
3. |
Kenya |
41.1 |
65.3 |
60.7 |
58.6 |
-6.9 |
| |
|
4. |
South Africa |
1,936.4 |
2,679.7 |
4,550.5 |
38.4 |
69.8 |
| |
|
5. |
Sudan |
83.6 |
241.6 |
359.1 |
189.1 |
48.6 |
| |
|
6. |
Tanzania |
58.8 |
73.1 |
108.9 |
24.3 |
49.0 |
| |
|
7. |
Zambia |
74.9 |
66.2 |
127.6 |
-11.6 |
92.7 |
| |
C. |
Latin American Countries |
3,776.3 |
3,884.5 |
4,279.5 |
2.9 |
10.2 |
V. |
Others |
53.4 |
52.1 |
50.6 |
-2.3 |
-3.0 |
VI. |
Unspecified |
522.2 |
535.4 |
973.9 |
2.5 |
81.9 |
Total Imports |
1,34,519.2 |
1,72,119.5 |
2,35,409.6 |
28.0 |
36.8 |
P : Provisional.
Note : The figures for 2006-07, which include country-wise distribution of petroleum imports, are not strictly comparable with the data for previous years. Source : DGCI & S. |
|


