
Investment Portfolio of Scheduled Commercial Banks: March 2012 - ਆਰਬੀਆਈ - Reserve Bank of India


Investment Portfolio of Scheduled Commercial Banks: March 2012
Investment Portfolio of Scheduled Commercial Banks: March 2012* This article presents an analysis of the investment portfolio of scheduled commercial banks (excluding Regional Rural Banks) as at end-March 2012, based on annual Basic Statistical Return 5 (BSR-5)1. The investment portfolio covers investments in central and state government securities, securities other than government securities approved for the purpose of investments under the Indian Trusts Act, 1882, other domestic investments, foreign government securities and other foreign investments. Besides summary findings2 of March 2012 survey, this article also presents comparable figures for select parameters over the period 2006 to 2012 based on previous studies published earlier. Highlights
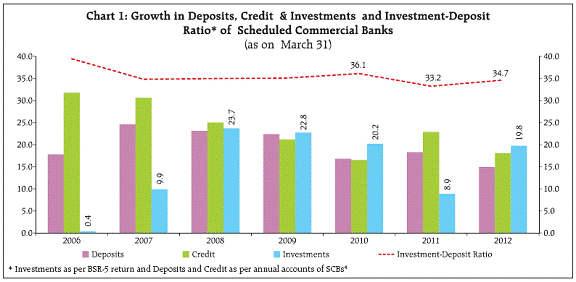
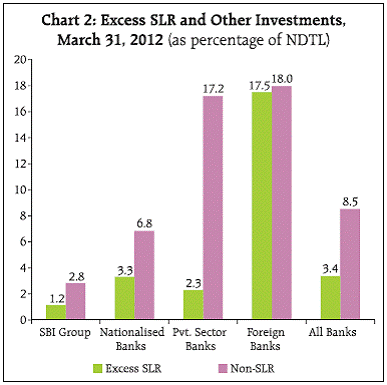
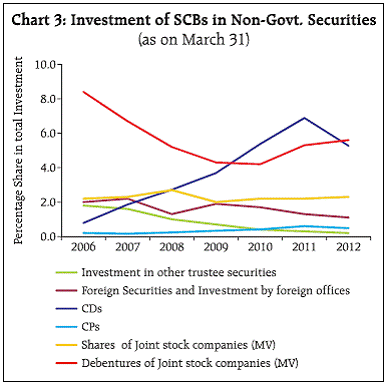
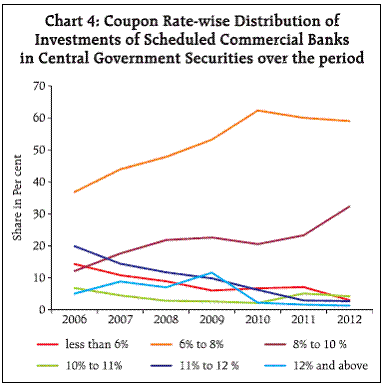
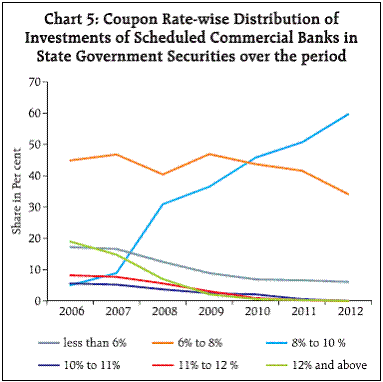
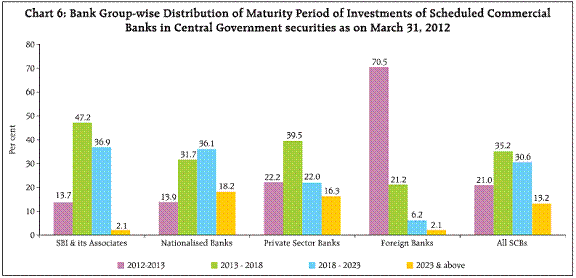
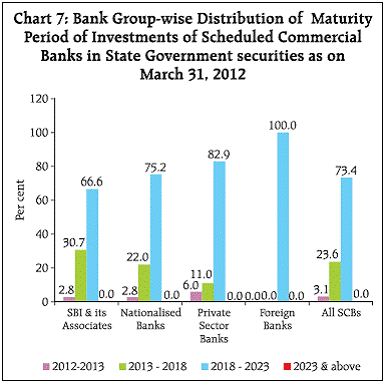
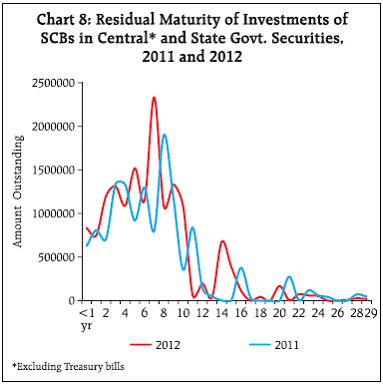
Investment growth of SCBs accelerated in 2011-12 1. During 2011-12, the outstanding investments of the scheduled commercial banks (SCBs) grew by 19.8 per cent as compared with 8.9 per cent in the previous year. On the other hand, growth in deposits and credit of SCBs decelerated during 2011-12 compared with the higher growth witnessed in the previous year (Chart 1). Investment-Deposit ratio increased to 34.7 per cent as on March 31, 2012 from 33.2 per cent a year ago. Investment of SCBs in government securities increased by 23.1 per cent in 2011-12 compared to 9.1 per cent in other domestic securities. The portfolio choice reflected both risk aversion on the back of increase in NPAs and liquidity constrains due to higher dependence on borrowed funds3. 2. A Major part of the incremental investment in 2011-12 was in government securities. As a result, the share of government securities in SCBs investment portfolio increased to 79.5 per cent in 2011-12 from 77.4 per cent in 2010-11 (Table 1). The share of the other domestic investments on the other hand decreased to 19.2 per cent in 2011-12 from 21.1 per cent in 2010-11. The investment preference of bank groups showed significant variations. Central government securities continued to be the preferred investment for all bank groups, but its share in total investments varied between 59.3 per cent (for private sector banks) to 69.4 per cent (for foreign banks). While state government securities were the second most preferred investment for public sector banks (PSBs), private and foreign banks preferred investment in other domestic securities. Foreign banks’ investment in SLR securities was much higher than the stipulated limit 3. The SCBs holding of SLR securities as at end of March 2012 was about 27.4 per cent of their NDTL, much higher than the prescribed SLR of 24 per cent (Chart 2). Foreign banks with their high investments in central government securities reported excess SLR holding of about 17.5 per cent indicating their preference for low risk assets. Share of non-SLR securities in investment was higher for private sector and foreign banks 4. The SCBs holding of non-SLR securities was about 8.5 per cent of their NDTL. Such investments were higher in the case of private sector banks (17.2 per cent) and foreign banks (18.0 per cent). About 38 per cent of non-SLR investments of private sector banks was in shares and debentures of joint stock companies. In the case of foreign banks, securities like CPs, CDs and FDs formed about 80 per cent of their non-SLR investments which showed their preference for short-term securities. Investment pattern of SCBs in non-Government securities have been changing 5. The market value of SCBs investment in securities of joint stock companies grew at 25.2 per cent in 2011- 12 on top of 28.1 per cent growth in 2010-11. Among securities of joint stock companies, SCBs preferred debentures (70.8 per cent) than shares (29.2 per cent). (Table 2). Investment of SCBs in bonds issued by public sector enterprises more than doubled in 2011-12. Bonds of Rural Electrifi cation Corporation (REC) and Power Finance Corporation accounted for about three-fourth of SCBs investment in Bonds issued by the public sector enterprises (Table 3). 6. The SCBs’ investment in certificates of deposit (CD) declined by 8.4 per cent in 2012 compared to an increase of 39.5 per cent in 2011. Its share in total investments of SCB’s declined to 5.3 per cent from 6.9 per cent in 2011 (Chart 3). The decline in holding of CDs is mainly due to the steep increase in holdings of alternate short-term securities viz. GoI Treasury bills. The share of investment in debentures of Joint stock companies (Market value) in total SCBs’ investment was showing a steady decline from 8.4 per cent in 2006 to 4.2 per cent in 2010, but thereafter it increased to 5.3 per cent in 2011 and 5.6 per cent in 2012. Fixed deposits were less preferred by SCBs in 2012 as their share in total investments declined to 0.7 per cent from 2.0 per cent in 2011. Coupon Rates on Government Securities have increased 7. Distribution of banks’ investments in central government securities according to coupon rate showed that there was a steady increase of securities in the coupon rate bracket of 6 to 8 per cent till the year 2010, but from 2011, the share of securities with coupon rate in the bracket of 8 to 10 per cent has shown an upward trend (Chart 4). The weighted average coupon rate5 of central government securities held by banks increased to 7.85 per cent in 2012 from 7.81 per cent in 2011. This is in lne with the increase in the coupon rate of securities issued during the last two years. 8. As regards to banks’ investments in state government securities, securities with coupon rate in the bracket of 6 to 8 per cent had a share of about 40 per cent of the investment during the period 2005-06 to 2010-11. It declined to 34 per cent in 2011-12. The share of the investment in the coupon rate bracket of 8 per cent to 10 per cent has shown an upward trend over the period (Chart 5), and in 2011-12 it contributed about 60 per cent of SCBs’ investments in state government securities in tandem with the rising interest rate scenario. The weighted average coupon rate of state government securities held by banks increased to 7.87 per cent from 7.73 per cent as at the end of March 2011 in tandem with increase in average coupon rate of securities issued during the year. Holding in Government Securities with long-term maturity decreased 9. At all SCBs level, central government securities maturing in 'more than 1 year but less than 6 years' constituted the largest share (35.2 per cent), followed by the securities maturing in 'more than 6 years but less than 11 years' (30.6 per cent). Securities with long-term maturities of more than 11 years had a lower share of 13.2 per cent as at end-March 2012 (18.1 per cent in 2011). On the other hand, the share of securities with residual maturity of less than one year (including treasury bills) increased sharply to 21.0 per cent as at end-March 2012 from 14.8 per cent in the previous year. The change in maturity profile was influenced by yield and term structure of the issuance of government securities and open market operations of RBI. 10. SCB’s holding of Treasury bills increased steeply by `785.85 billion (80.6 per cent) in 2012 on the back of increased issuance and firming up of yields in 2011- 12. The incremental investment in T-bills formed about 30 per cent of the incremental investments in all central government securities. Higher investments in securities like T-bills helped the banks in parking short term surplus gainfully as well as in managing asset liability maturities (ALM), especially in view of the lower growth in deposits (14.9 per cent) and high growth in borrowings (24.4 per cent). Among bank groups, Foreign banks were the highest holders of T-Bills (40 per cent) followed by Private sector banks (27 per cent). 11. At bank group level, share of the holdings of central government securities in the maturity bucket 'April 2013 to March 2018' varied between 21.2 per cent for foreign banks and 47.2 per cent for state bank group. (Chart 6). The proportion of central government securities with maturity period ‘2018-2023’ varied between 6.2 per cent for foreign banks and 36.9 per cent for state bank group. Nationalised banks and private sector banks were holding more long-term securities (maturity beyond March 2023) in their investment portfolio with respective shares of 18.2 per cent and 16.3 per cent, while in the case of state bank group and foreign banks such share was low at 2.1 per cent. Over 70 per cent of the investments of Foreign banks were in short-term securities with maturity less than one year, of which T-Bills alone had a share of 53.4 per cent. 12. As regards investments in state government securities by the SCBs, 23.6 per cent was due for maturing during April 2013 to March 2018 while 73.4 per cent had maturity during April 2018 to March 2023 (Chart 7). Private sector banks increased their holding in state government securities in the longer maturity bracket of 2018-2023. Foreign banks were having less exposure to state securities till 2011, but in 2012 they invested in some state government securities of long term maturity. 13. The Investment of SCBs in Central and state government securities, according to Residual Maturity as at end of March 2011 and 2012 is shown in Chart 8. Investments in securities with residual maturity of 7 to 8 years were the highest with a share of 15.0 per cent in total investments as on March 31, 2012. About 45 per cent of banks holding in Government Securities (excluding T-bills) were with residual maturity of 6 to 11 years. The average remaining period of maturity reduced to 7.18 years from 7.37 years as on March 31, 2011. Share of private sector banks investment in State Government Securities increased 14. SCBs investments in State government securities increased by 24.4 per cent in 2012 as against 3.1 per cent in 2011. About 70 per cent of banks’ SDL holding pertains to eight states with high SDP showing that banks prefer to hold to securities of relatively more developed states. While banks holding of state government securities increased sharply in 2012, their investments in all other state-level bodies declined. 15. Bank group-wise pattern of investment in the state-level securities showed that nationalised banks held the highest share at 61.9 per cent, followed by the state bank group at 29.6 per cent. Nationalised banks held a high share in investments in the state-level securities in most of the States/UTs, except in some of the north-eastern states namely Mizoram, Sikkim and Manipur, where State bank group remained invested with higher shares. Private sector banks’s investment in state level securities increased at a higher rate of 36.9 per cent in 2012. As a result, the share of investment of private sector banks in state level securities increased to 8.3 per cent from 7.6 per cent, but these were mostly concentrated in securities of states with high SDP. Holdings of foreign banks in state level securities remained negligible. Annex The analysis of investment portfolio of Scheduled Commercial Banks, excluding Regional Rural Banks, presented in this article is based on data furnished in the Basic Statistical Return (BSR)-5 as at end-March 2012 and covers 84 banks, viz., 6 from the State Bank group6, 20 from the Nationalised Banks group (including IDBI Ltd.), 20 Indian Private Sector Banks and 38 Foreign Banks operating in India. These banks accounted for 97.8 per cent of the total investments of all the SCBs7 (including Regional Rural Banks) on the last reporting Friday of March 2012. Besides summary findings of March 2012 survey, this article also presents comparable figures for select parameters over the period 2006 to 2012, based on previous studies published earlier. 2. The BSR-5 return covers total investments of domestic banks including their investments abroad and the investments made in India by the foreign banks through their branches located in the country. These investments are classified into: (a) Indian government securities (i.e., central and state government securities taken together), (b) Other trustee securities, (c) Other domestic investments and (d) Foreign investments. Other trustee securities are trustee securities, other than government securities, which are specially approved for investments purpose under the Indian Trusts Act, 1882; it includes securities/shares/bonds/debentures issued by major all-India bodies namely, Industrial Finance Corporation of India Ltd., National Bank for Agriculture and Rural Development, UTI Mutual Fund (formerly UTI) etc as well as State-level bodies namely State Electricity Boards, State Financial Corporations, Regional Rural Banks, Co-operatives, State Industrial Development Corporations, State Transport Corporations, Municipalities, local authorities etc. Other domestic investments cover i) Shares, bonds and debentures of Indian joint stock companies including public sector companies (non-trustee securities), ii) Fixed deposits with banks, iii) Certificate of deposits and Commercial papers, iv) Units of Mutual Funds, v) Others not elsewhere classified. Foreign investments comprise foreign government securities and other foreign investments. Moreover, investments by foreign offices of the domestic SCBs are classified into three segments namely, Indian securities, Foreign countries securities and other investments. 3. The investment data presented in this article, in general, is referred to by their face value and in the case of investments in shares, bonds and debentures of Indian joint stock companies, market value is also indicated along with the face value. For arriving at aggregates face value of investments is taken except in the case of investments in securities of Indian joint stock companies for which market value is taken. 4. Data on investments of SCBs classified according to broad categories at bank-group level and bank level are published in the Reserve Bank’s annual publication ‘Statistical Tables Relating to Banks in India (STRBI)’ based on annual accounts of banks. The investment figures presented in this article (as reported in BSR-5) may not necessarily tally with those in STRBI due to differences in valuation, aggregation and accounting practices. * Prepared in the Banking Statistics Division of the Department of Statistics and Information Management. The previous article as at end-March 2011 was published in March 2012 issue of the Reserve Bank of India Bulletin. 1 The BSR-5 return was introduced in the year 1972 as per the recommendations of the Committee on Banking Statistics constituted by the Reserve Bank in April 1972 under the chairmanship of Shri A. Raman. A detailed description of the coverage and contents of the BSR-5 return is given in the Annex. 2 More detailed data is available in the Reserve Bank website ‘(URL: http:// www.rbi.org.in)’. 3 Chapter I (Perspectives on the Indian Banking Sector) and Chapter IV (Operations and Performance of Commercial Banks) – Report on Trend and Progress of Banking in India 2011-12 4 Bank group-wise liabilities and assets of SCBs - Statistical Tables relating to banks in India 5 Amount outstanding (Face value) is taken as weights. 6 State Bank of Saurashtra and State Bank of Indore were merged with the SBI in October 2008 and August 2010 respectively. 7 As per the reported figures of investments in Form ‘A’ return under Section 42 (2) of RBI Act, 1934 as on last reporting Friday of March 2012. |

ਇਸ ਪੇਜ ਨੂੰ ਸ਼ੇਅਰ ਕਰੋ:


ਭਾਰਤੀ ਰਿਜ਼ਰਵ ਬੈਂਕ ਮੋਬਾਈਲ ਐਪਲੀਕੇਸ਼ਨ ਇੰਸਟਾਲ ਕਰੋ ਅਤੇ ਨਵੀਨਤਮ ਖਬਰਾਂ ਤੱਕ ਤੇਜ਼ ਐਕਸੈਸ ਪ੍ਰਾਪਤ ਕਰੋ!


