 IST,
IST,


Market Access and IMF Arrangements: Evidence from Across the Globe
|
by Shruti Joshi and PSS Vidyasagar^ The article analyses the availing of International Monetary Fund (IMF) loans by various countries and establishes a link between market access and dependence on IMF’s funds over the period 2000-2023. It is found that Emerging Market and Developing Economies (EMDEs) continue to rely on IMF resources for managing liquidity pressures on account of their limited access to international financial markets and alternate sources of funding. Introduction Since the mid-1980s, the world has witnessed a remarkable acceleration in global trade and financial integration on the back of increased cross-border trade, investments, and financial flows (IMF, 2016). While this increased integration offers benefits such as growth, innovations, and economies of scale, it also presents risks (Villaverde and Maza, 2011; Ahmad, 2019). The higher interconnectedness can lead to cross-border contagion of financial stress and periods of amplified distress in vulnerable countries through sudden swings in financial flows, which can lead to a significant change in countries’ gross and net foreign asset positions worldwide (Giglio, et al., 2016; Lane and Milesi-Ferretti, 2006) and/or through trade disruptions, which can reduce financial flows to countries (Attinasi, et al., 2022). In the post-pandemic years, a confluence of factors such as geo-economic fragmentation, elevated global debt, and heightened macroeconomic policy uncertainty poses balance-of-payments (BoP) risks for countries with weak buffers and high foreign currency debt (GFSR, 2024). IMF, as the centre of Global Financial Safety Net (GFSN), acts as the lender of last resort for countries with acute balance of payments pressures due to its near universal membership and resource size. Existing studies have found that countries that obtain IMF assistance usually have weak macroeconomic fundamentals, such as higher current account deficit, low international reserves, high fiscal deficit, low per capita income, and exchange rate imbalances, and their vulnerability can be exacerbated by global factors such as global business cycle, a steep rise in international commodity prices and world interest rates (Bird and Orne, 1986; Cornelieus, 1987; Joyce, 1992; Bird and Rowlands, 2002; Joyce, 2004; Elekdag, 2008). However, with increased access to international capital markets and alternative funding sources such as swap lines and Regional Financing Arrangements (RFAs), countries now have more options to address external funding needs. Moreover, the non-concessional IMF loans are offered at market-determined rates, which, although potentially lower than market rates1, may still be unappealing because of the performance conditions and the associated stigma (Kawai, 2010). It is observed, however, that a host of emerging market and developing economies (EMDEs) continue to rely on IMF loan arrangements, also known as IMF Programs. For instance, in the last decade (during 2014-2024), EMDEs entered a total of 329 IMF arrangements, of which, nearly half of the programs/arrangements were non-concessional loans. On the other hand, advanced economies (AEs) have not entered the IMF arrangements since 2014. In the new millennium, while the dependence of EMDEs on IMF loans has been greater, several fast growing large EMDEs, including India and China did not have to take recourse to the IMF loans. In fact, these economies had been the primary drivers of global growth, barring the COVID period, where nearly the entire globe recorded negative growth. The fast growing EMs continue to be global drivers of growth and are characterized by relatively robust macroeconomic fundamentals. In fact, several large and fast growing EMDEs had turned creditors to the IMF in the aftermath of the Global Financial Crisis (GFC). In the backdrop, this article aims at identifying the key factors driving the recourse to IMF programs by countries. The remainder of the article is organised as follows: Section II gives an overview of access of IMF loans across regions; Section III analyses the link between the demand for the Fund’s loans and market access of countries; and section IV contains the concluding observations. Historically, it is observed that demand for IMF loans increases during global downturns. For instance, during the global recession of 1983 triggered by oil shock and a subsequent debt crisis in Latin America, many EMDEs, especially in Latin America and Sub-Saharan Africa (SSA), suffered long-lasting slowdown in growth (Kose et al., 2020). As a result, IMF stepped up its lending programs during 1982-83 to these regions. For instance, around 85 per cent of the Fund lending in 1983 was to Latin America and SSA. Next, IMF lending increased during the Gulf war, where 50 per cent of the lending in 1991 was to the Asia-Pacific Region (APR), which was affected adversely by the increased crude prices. Similarly, during the GFC and Eurozone crisis, there was a rise in IMF arrangements to some European countries, while the COVID crisis resulted in demand for Fund resources across the world (Chart 1). The IMF has multiple instruments/windows to meet the funding requirements of member countries. The “reserve tranche,” which is the member’s unconditional drawing right on the IMF,2 allows a member country to draw from the IMF at short notice in need of balance of payments financing. Further, IMF’s loans are extended under two heads, viz., the general resource account (GRA) that provides loans at market-based rates, and the Trust-based concessional support to eligible countries (predominantly low-income countries), of which the Poverty Reduction and Growth Trust (PRGT) is the predominant source. Both these have different lines of credit facilities with similar conditionalities and provide short-term to long-term financing support.  The access to IMF loans is determined by members’ quotas, with the loan quantum typically being a multiple of the quota.3 As the PRGT countries are low-income developing countries, the quantum of loans availed by them is significantly smaller than the loans availed by other members through GRA (little less than 12 per cent of GRA amount accessed in 2023), though the number of PRGT arrangements is nearly equal to GRA arrangements (Chart 2c). The quantum of IMF support as well as the number of IMF arrangements availed by members increased substantially during the new millennium, particularly during periods of shocks (Chart 2a and 2b). This is in line with the increased global interconnectedness which seems to have accelerated transmission of global spillovers resulting in external financing problem in member countries (Chart 2d).4  II.1 Region-wise Borrowing from IMF In terms of number of arrangements as well as quantum of loans under GRA, the Western Hemisphere Region (WHR5) - predominantly Latin America - is the largest borrower, whereas SSA6 is the largest borrower from PRGT (Chart 3). Moreover, some countries within WHR, SSA and APR7 have repeatedly borrowed from the IMF. The temporal distribution of IMF loans across regions reveals that in the initial period of IMF operations, they were availed mostly by what are now the AEs. However, the demand for IMF loans from AEs waned over the period, barring the exceptional case of GFC-Eurozone crisis, where some AEs (Greece, Ireland, Portugal, Cyprus) availed extraordinarily large amounts of loans from the IMF. One of the driving factors for obtaining IMF financing is the deteriorating external funding/liquidity position (as proxied by indicators such as the import cover of forex reserves, the share of short-term debt, debt service ratio, etc.) for low-income countries (as identified by their eligibility for support of International Development Agency (IDA) of the World Bank). The import cover for AEs (proxied by OECD countries) has improved consistently from 1995, barring dips during crisis periods, whereas the same has turned weak for low-income countries from 2003 (even before the onset of GFC) and remained weak thereafter (Chart 4).  II.2 Role of Regional Financing Arrangements (RFAs) In the face of BoP issues, the first line of defence is country’s own resources, such as forex reserves, followed by other options such as swaps - both bilateral and from RFAs - and market borrowings which are more likely to be preferred to meet BoP financing needs, as these financing options do not have the stigma that is attached to borrowing from the IMF. Finally, countries tend to resort to IMF loans and/or official bilateral loans when other options do not appear to be feasible. As stated above, import cover of AEs remained comfortable and their credit ratings have generally been in the investment grade, leading to comfortable liquidity access from international capital markets. The sovereign ratings for most of the low income countries (LICs) and EMDEs, on the other hand, have been non-investible grade, with several LICs not having country ratings, thereby, severely restricting their market access. However, the relatively better postioned EMDEs, such as ASEAN region, BRICS and some Latin American countries had access to RFAs or currency swap agreements (Annex Tables A2, A3 and A4).  The access to alternative sources of funding through RFAs or currency swap arrangements for these fast-growing economies reduced their reliance on IMF loans. For instance, ASEAN+3 countries8 launched the Chiang Mai Initiative Multilateralisation (CMIM), which came into effect in 2010, to address short term liquidity needs in the region. Since its formation, the CMIM member countries did not borrow from the IMF, whereas prior to 2010 few ASEAN countries such as Korea and Philippines were repeat borrowers from the IMF. Similarly, BRICS countries have entered into the BRICS contingent reserve arrangement (CRA) in 2015 and since then only South-Africa entered into Fund’s arrangement during COVID crisis. In 2002, the European Union formed the EU-BoP facility for non-eurozone countries9 and in 2012 post the Eurozone crisis, the European Stability Mechanism10 (ESM) was put into place which led to a drop in IMF borrowings by the member countries. Likewise, in 1978, the FLAR - Latin American Reserve Fund11 - was established, leading to a fall in the number of IMF arrangements for its member countries (Chart 5). However, the drop in IMF borrowing amongst the members was not as steep for FLAR as compared to the members of other RFAs. Nevertheless, there were no withdrawals from IMF arrangements for countries like Colombia, Peru and Paraguay.  III. Market Access and IMF Arrangements Higher country risk profiles lead to higher borrowing costs as market demand higher returns to compensate for the additional risk. Therefore, factors such as poor sovereign ratings, or even absence of sovereign ratings as well as high credit default spreads, for a given country limit their access to international capital markets. Under such circumstances, borrowing from the IMF may be the only feasible option available for such countries, apart from borrowing from official bilateral creditors. However, borrowings from official bilateral creditors may also not be a preferred option for countries, as some of the heavily indebted countries such as Zambia faced debt distress, leading to difficult debt restructuring process in the G20 Common Framework for Debt Treatments. The market access of countries and recourse to IMF loans by countries which availed loans from the IMF is analysed in this context, with focus on select episodes of global turbulence such as the GFC (2008-2010), Eurozone Crisis (2012-14) and COVID crisis (2020-2021). A disaggregated analysis of data on country default spreads and risk premium for the post 2000 period, made available by Damodaran (2024), reveals that most of the countries that availed IMF loans are countries with non-investible grade sovereign ratings, and hence, are considered high-risk borrowers in the international capital markets which restricted their market access. These borrowers are mostly concentrated in WHR, SSA and APR, and are mostly low-income countries and EMDEs. For instance, in WHR, countries like Ecuador, Honduras and Jamaica borrowed from the IMF multiple times, and had non-investible grade ratings resulting in higher country risk premium (CRP) and default spreads. Similarly, many countries of SSA availing loan under PRGT such as, Madagascar, Malawi and São Tomé and Príncipe amongst others, do not have any country ratings available (Table 1). Coming to specific episodes of stress in the new millennium during the GFC, although AEs were at the epicenter of the crisis, there was a spillover to the rest of the world, followed by a period of slowdown in growth (Kose et al., 2020). Next, during the Eurozone-crisis, Cyprus, Greece, Ireland, Portugal, and Spain were the major crisis hit countries in Europe (Gourinchas et al., 2023). Most of the countries which availed IMF loans during the GFC and Eurozone crisis periods were rated Baa or lower on Moody’s rating scale or did not have any ratings available. For instance, Armenia, Colombia, El salvador, Bangladesh, Jamaica and Morocco, among others, had speculative grade or low investment grade ratings, while Angola, Congo, Comoros, Ethiopia and Ghanna, among others had no ratings available (Annex Tables A2 and A3). On the other hand, the credit-worthiness of countries which did not borrow from the IMF, despite being affected by the GFC and Eurozone crisis, remained stable as they enjoyed investible grade ratings.These, inter alia, included Finland, France, Germany, Sweden, and the USA. The average default spread for countries which borrowed money from IMF during 2009-2014 was in the range of 3 to 5 percent whereas it was 0.6 to 1 percent for those countries which did not borrow from IMF. Similarly, the CRP were in the range of 4 to 8 percent, and 0.9 to 1.9 percent for these two groups of countries (Chart 6). 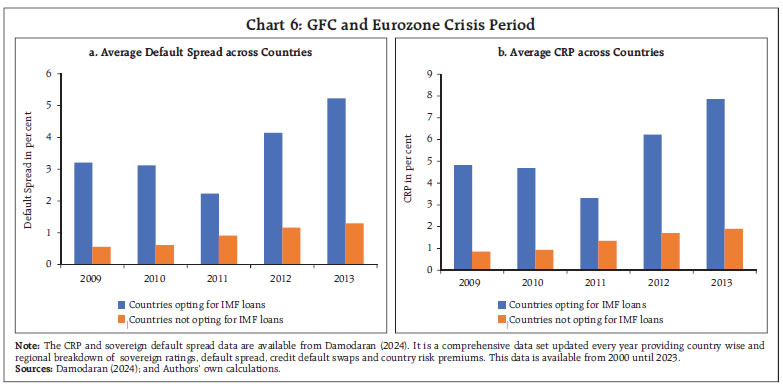 Secondly, some AEs, viz., Greece, Portugal, and Ireland entered the IMF loan arrangements during 2008-11 due to their mounting public and private sector debts. During this period, these countries faced rating downgrades, leading to curtailed market access. For instance, Greece was downgraded from A2 to Ba1 from 2009 to 2010 and Ireland was downgraded from Aa1 to Baa1 in the same period. Portugal was downgraded from A1 in 2010 to Ba2 in 2011. Iceland and Latvia had also drawn money from IMF in 2008 following their rating downgrades in 2007. Iceland was downgraded from Aaa in 2007 to Baa1 in 2008 and Latvia was downgraded from A2 to A3 (Annex Table A2). Similarly, African countries such as Angola, Djibouti, Dominican Republic Congo, Ghana, Mali, Niger, Togo, availed IMF PRGT financing and did not have sovereign ratings for the relevant period. On the other hand, Ireland, Portugal and Spain, despite being downgraded from medium investment grade to non-investible grade between 2012-14, did not enter into the Fund’s loan arrangement due to availability of financial assistance from the European Financial Stability Facility(EFSF)12, which was formed in 2012. Additionally, some countries signed IMF programs to enhance their market access, and did not need to take recourse to borrowals from the IMF. The IMF’s flexible credit line (FCL) is designed for this purpose for countries with strong macroeconomic fundamentals such as sustainable external position, low inflation and sound public finances13. The IMF certification that these countries have very strong macroeconomic fundamentals has a positive market announcemnt effect leading to easier access to funding from international capital markets. Similarly, the precautionary and liquidity line (PLL) is available for countries which may have some vulnerabilties which preclude them from FCL, though otherwise they may have reasonable macrofundamentals. Nevertheless, access to PLL also acts as a market signal about assured IMF funds. However, the CRP for Morocco did not decline even after grant of the PLL, possible on account of the fact that PLL does not send a market signal that the country has strong macroeconomic fundamentals. On the other hand, the CRP increased for Morocco, after the PLL expired. (Table 2). During the COVID pandemic (2020 – 2021), borrowing countries from the WHR and SSA regions were more as compared to other regions (Annex Table A4). Countries in this region had higher risk premium and lower ratings vis-à-vis non-borrowers. For instance, the average CRP for countries whch borrowed from IMF was 5.1 and 5.4 per cent in 2020 and 2021, respectively, whereas it was 2.7 and 2.8 per cent for the non-borrowers. In fact, these regions have also been repeated borrowers from IMF due to their poor market access. For instance, Latin America and Caribbean had the highest CRP (5.0 per cent) and a higher default spread (3.7 per cent) after Africa, whereas EMDEs from Asia had a lower CRP (3.6 per cent) and default spread (2.6 per cent). AEs had the lowest avergae default spread (0.7 per cent) and CRP (0.8 per cent), and thus, they did not need recourse to IMF loans (Chart 7). Also, some of the fast-growing EMDEs, especially in the APR region, had better market access and did not need to borrow from the IMF. 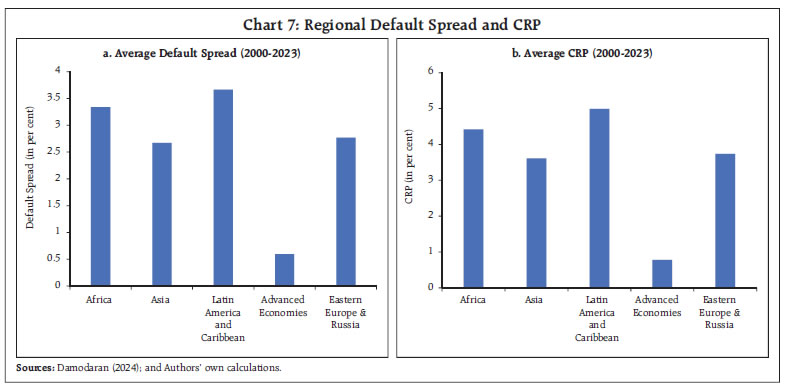 A panel regression with country fixed effects model has been estimated to establish the link between market access and IMF loans. The regression is estimated on the amount of loans drawn by countries with the relevant country risk premium as the explanatory variable14, and has the following specification: Amount Drawnit = α + βCRPit + Global Shock + Country Fixed Effects In the above equation, amount drawn refers to the amount of IMF loan support availed by country i in year t in SDR million; market access is measured through country risk premium (CRP), and global shock indicates time dummies for GFC, Euro-zone and COVID crisis. The sample comprises of an unbalanced panel15 of 124 countries which have borrwed from IMF during 2000 to 2024. This regression is run for the whole sample period with country fixed effects which takes into account the country-specific factors. In model 1, the impact of CRP is examined without controling for the global schocks. In model 2, 3, 4 and 5, separate dummies are added to account for the three shocks viz GFC, Euro-Zone and COVID. And in model 5 all the three shock dummies are added together. The regression results reveal that countries with lower market access as indicated by a higher country risk preimum availed greater financial support from the IMF. These results were significant across all the five models which indicates that it is the lack of market access which drives countries to borrow more from IMF. The regression parameter for CRP without time dummies is significant at 90% confidence interval. On the other hand, the estimated parameters for CRP with time dummies turns significant at 99% confidence interval. This appears to indicate that while higher CRPs (i.e., lack of market access) is a significant factor in driving countries’ recourse to the IMF loans, the shock events accentuate the countries’ recourse to IMF loans (Table 3). As stated before, the recourse of countries to IMF loans has increased during crisis periods. This is probably on account of the fact that crisis episodes leads to worsening of macroeconomic fundamentals and an increase in the country risk preimum of the affected countries, which in turn reduces their market access and makes them resort to IMF loans. This article shows that there has been an increased dependence on IMF loans in the last three decades across regions, particularly for the LICs and some EMDEs, in conjunction with rising economic integration across the globe. Countries with availability of alternate sources of funding including swap lines and RFAs, and had market access through better ratings usually did not avail IMF loans. On the other hand, the borrowers from IMF generally had weak ratings and limited market access. Further, shock events appear to increase the dependence of countries on IMF loans as these event appear to restrict market of crisis affected countries through increased CRPs. Some IMF programs such as FCL and PCL, which are designed for the purpose of enhancing market access for countries with robust macroeconomic fundamentals, appear to have served their purpose. Predominantly, the countries without or limited market access and alternate resources avail IMF loans, which points to the role of the IMF as the global lender of last resort and highlights its central role in the GFSN. References Ahmad, M. (2019). Globalisation, economic growth, and spillovers: A spatial analysis. Margin: The Journal of Applied Economic Research, 13(3), 255-276. Attinasi, M. G., Balatti, M., Mancini, M., & Metelli, L. (2022). Supply chain disruptions and the effects on the global economy. Economic Bulletin Boxes, 8. Bird, G., & Bird, G. (1988). An analysis of drawings on the International Monetary Fund by developing countries. Managing Global Money: Essays in International Financial Economics, 104-112. Bird, G., & Rowlands, D. (2002). The pattern of IMF lending: an analysis of prediction failures. The Journal of Policy Reform, 5(3), 173-186. Cornelius, P. (1987). The demand for IMF credits by sub-Saharan African countries. Economics Letters, 23(1), 99-102. Damodaran, A. (2024). Country risk: determinants, measures and implications Measures and Implications-The 2024 Edition. SSRN Electron. J. Elekdağ, S. (2008). How does the global economic environment influence the demand for IMF resources. IMF Staff Papers, 55(4), 624-653. International Monetary Fund. Monetary, & Capital Markets Department. (2004). Global Financial Stability Report, April 2004: Market Developments and Issues. International Monetary Fund. IMF. (2016). Adequacy of the global financial safety net. IMF Policy Papers, International Monetary Fund, Washington DC. IMF. (2017). Collaboration between the Regional Financing Arrangements and IMF. IMF Policy Papers, International Monetary Fund, Washington DC. Joyce, J. P. (1992). The economic characteristics of IMF program countries, Economics Letters, 38(2), 237-242. Joyce, J. P. (2004). Adoption, implementation and impact of IMF programmes: A review of the issues and evidence. Comparative Economic Studies, 46, 451-467. Kawai, M. (2010). Reform of the international financial architecture: An Asian perspective. The Singapore Economic Review, 55(01), 207-242. Lane, P. R., & Milesi-Ferretti, G. M. (2007). The external wealth of nations mark II: Revised and extended estimates of foreign assets and liabilities, 1970–2004. Journal of international Economics, 73(2), 223-250. Villaverde, J., & Maza, A. (2011). Globalisation, growth and convergence. The World Economy, 34(6), 952-971.
^ The authors are from the International Department, Reserve Bank of India. The views presented in this article are those of the authors and do not represent the views of the Reserve Bank of India. 1 https://www.imf.org/en/About/Factsheets/IMF-Lending. 2 The reserve tranche is created by the foreign exchange portion of the quota subscription, plus increase (decrease) through the IMF’s sale (repurchase) of the member’s currency to meet the demand for use of IMF resources by other members in need of balance of payments financing. 3 Currently, the normal access limit is 145 per cent; and cumulative access is 435 per cent of quota. In 2023, access limits were increased temporarily to meet the demands arising from COVID pandemic with normal access limit at 200 per cent, and cumulative access limit at 600 per cent of quota. This temporary increase in access limits is set to expire at the end of 2024. 4 The correlation between trade to GDP ratio and total amount drawn from IMF during 1970 to 2024 is 0.54 indicating that greater interconnectedness is associated with greater amounts drawn from IMF. 5 WHR comprises the Americas and Caribbean and includes Antigua and Barbuda, Argentina, Bahamas, Barbados, Belize, Bolivia, Brazil, Canada, Chile, Colombia, Costa Rica, Dominica, Dominican Republic, Ecuador, El Salvador, Grenada, Guatemala, Guyana, Haiti, Honduras, Jamaica, Mexico, Nicaragua, Panama, Paraguay, Peru, St. Kitts and Nevis, St. Lucia, St. Vincent and the Grenadines, Suriname, Trinidad and Tobago, the Unite States of America, Uruguay, and Venezuela. 6 SSA comprises: Angola, Benin, Burkina Faso, Burundi, Cabo Verde, Cameroon, Central African Republic, Chad, Comoros, Congo, Congo DR, Cote d’Ivoire, Equatorial Guinea, Eritrea, Eswatini, Ethiopia, Gabon, Gambia, Ghana, Guinea, Guinea-Bissau, Kenya, Lesotho, Liberia, Madagascar, Malawi, Mali, Mauritius, Mozambique, Namibia, Niger, Nigeria, Rwanda, Sao Tome & Principe, Senegal, Seychelles, Sierra Leone, South Africa, South Sudan, Tanzania, Togo, Uganda, Zambia, and Zimbabwe. 7 APR comprises of Australia, Bangladesh, Bhutan, Brunei Darussalam, Cambodia, China, Fiji, Korea, Hong-Kong India, Indonesia, Kiribati, Laos, Maldives, Marshall Islands, Micronesia, Mongolia, Myanmar, Nauru, Nepal, New Zealand. Palau, Papua New Guinea, Philippines, Samoa, Singapore Solomon Islands, Sri Lanka, Thailand, Timor-Leste, Taiwan Tonga, Tuvalu, Vanuatu, and Vietnam. 8 Brunei Darussalam, Cambodia, China, Indonesia, Japan, Korea, Lao People’s Democratic Republic, Malaysia, Myanmar, Philippines, Singapore, Thailand, Vietnam, and Hong Kong. 9 Bulgaria, Czech Republic, Denmark, Hungary, Poland, Romania, Sweden, and United Kingdom. 10 Austria, Belgium, Cyprus, Estonia, Finland, France, Germany, Greece, Ireland, Italy, Latvia, Lithuania, Luxembourg, Malta, Netherlands, Portugal, Slovakia, Slovenia, and Spain. 11 Members include Bolivia, Columbia, Costa Rica, Peru, Paraguay, Uruguay, and Venezuela. 12 EFSF disbursement dashboard. 13 https://www.imf.org/en/About/Factsheets/Sheets/2023/Flexible-Credit-Line-FCL. 14 Since CRP is calculated using the default spreads, we only include CRP in the regression analysis to avoid multicollinearity. 15 All 124 countries have not borrowed in a given year, and hence, the sample is an unbalanced panel. |
|||||||||||||||||||||||||||||||||||||||||||||||||||||||||||||||||||||||||||||||||||||||||||||||||||||||||||||||||||||||||||||||||||||||||||||||||||||||||||||||||||||||||||||

ਇਸ ਪੇਜ ਨੂੰ ਸ਼ੇਅਰ ਕਰੋ:


ਭਾਰਤੀ ਰਿਜ਼ਰਵ ਬੈਂਕ ਮੋਬਾਈਲ ਐਪਲੀਕੇਸ਼ਨ ਇੰਸਟਾਲ ਕਰੋ ਅਤੇ ਨਵੀਨਤਮ ਖਬਰਾਂ ਤੱਕ ਤੇਜ਼ ਐਕਸੈਸ ਪ੍ਰਾਪਤ ਕਰੋ!
ਸਾਡੀ ਐਪ ਇੰਸਟਾਲ ਕਰਨ ਲਈ QR ਕੋਡ ਸਕੈਨ ਕਰੋ।


ਪੇਜ ਅੰਤਿਮ ਅੱਪਡੇਟ ਦੀ ਤਾਰੀਖ:


