
South-West Monsoon 2006: An Overview - ਆਰਬੀਆਈ - Reserve Bank of India


South-West Monsoon 2006: An Overview
South-West Monsoon 2006: An Overview*
(June 1 to September 30, 2006)
INTRODUCTION
Agriculture in India continues to be monsoon dependent. There are two Indian monsoon seasons, viz., South-West, covering the period from June to September and North-East from October to December. However, the success or failure of the crops is more closely associated with the performance of the South-West monsoon, which accounts for 80 per cent of the country’s annual rainfall. The vagaries of the South-West monsoon with regard to the time of onset, as also its temporal and spatial distribution have a profound impact on the agricultural economy of the country. As two-thirds of the cultivated area is still unirrigated, agronomic potential is largely determined by the progress and performance of the South-West monsoon.
SOUTH-WEST MONSOON 2006 – HIGHLIGHTS
- During the year 2006, the South-West monsoon arrived over Kerala on May 26, almost a week prior to the normal date. Monsoon covered the entire country by July 24, with a delay of 9 days.
- There was a prolonged hiatus during the South-West monsoon 2006 from June 7 to June 22, 2006. The second hiatus lasted for 8 days (July 1 to July 8, 2006).
- The South-West monsoon rainfall over the country as a whole was 99 per cent of the Long Period Average (LPA), which was higher than India Meteorological Department (IMD) forecast.
- Five sub-divisions (Andaman and Nicobar Islands, Arunachal Pradesh, Assam and Meghalaya, West Uttar Pradesh and Haryana experienced moderate drought1 conditions (rainfall deficiency of 26 per cent to 50 per cent) at the end of the season.
- This year, the South-West monsoon withdrew from the entire country by October 17, 2006.
FORECAST OF SOUTH-WEST MONSOON
The IMD has been issuing two stage operational long range forecasts of the South-West monsoon rainfall since 2003 using statistical methods. The first forecast for South-West monsoon rainfall comes out in the month of April. IMD also issues updated forecasts by the end of June, which also includes forecast for the July rainfall over the country as a whole and seasonal rainfall over the four broad homogeneous regions2 of India.
As per the long range forecast of IMD issued in April 2006, the South-West monsoon 2006 rainfall for the country as a whole was expected to be near normal at 93 per cent of LPA with a model error of +/- 5 per cent. The updated forecast issued on June 30, 2006 placed it at 92 per cent of LPA with a model error of +/- 4 per cent. The actual rainfall during the South-West monsoon was 99 per cent of the normal, as compared with the forecast of 92 per cent of the normal made by the IMD. Incidentally, IMD’s forecast of South-West monsoon which has generally been off the mark turned out to be accurate in 2005 as the actual rainfall was 99 per cent of the normal, while the prediction was 98 per cent of normal (Table 1).
* Prepared in the Division of Rural Economics, Department of Economic Analysis and Policy.
1 According to India Meteorological Department, the departure of aridity index from the normal value is expressed in percentage and accordingly drought is categorised as severe (more than 50 per cent), moderate (26 per cent to 50 per cent) and mild (up to 25 per cent).
2 The four broad homogeneous regions are: 1) North-West India (UP, Rajasthan, Haryana, Chandigarh and Delhi, Punjab, Uttaranchal, Himachal Pradesh, and J&K); 2) Central India (Madhya Pradesh, Chhatisgarh, Orissa, Maharashtra and Gujarat); 3) South Peninsula (Andhra Pradesh, Karnataka, Tamil Nadu and Pondicherry, Kerala, Lakshadweep and Andaman and Nicobar Islands); and 4) North-East India (Bihar, Jharkhand, West Bengal, Sikkim, Assam, Arunachal Pradesh, Meghalaya, Nagaland, Manipur, Mizoram and Tripura).
| Table 1: IMD’s Forecast of South-West Monsoon |
||
| (As Per cent of Normal) |
||
| Year |
IMD’s Forecast |
Actual |
| 1997 |
92 |
102 |
| 1998 |
99 |
106 |
| 1999 |
111 |
96 |
| 2000 |
99 |
92 |
| 2001 |
98 |
92 |
| 2002* |
101 |
81 |
| 2003 |
96 |
102 |
| 2004 |
100 |
87 |
| 2005 |
98 |
99 |
| 2006 |
92 |
99 |
| * Drought year. |
||
CUMULATIVE RAINFALL 2006
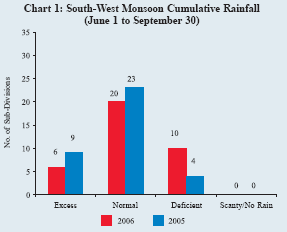
The cumulative area-weighted rainfall during the South-West monsoon (June 1 to September 30, 2006) turned out to be 1 per cent below normal, and was same as that during the corresponding period of the previous year (June 1 to September 30, 2005).
Of the 36 meteorological sub-divisions, cumulative rainfall was excess/normal3 in 26 sub-divisions (32 sub-divisions during last year) and deficient/scanty$/no rain in 10 sub-divisions (4 sub-divisions during last year) (Chart 1, Table 2 and Statement 1).
| Table 2: South -West Monsoon |
|||||
| Year |
Cumulative Rainfall: Above (+)/Below (-)Normal(per cent) |
Rainfall |
|||
| Excess |
Normal Deficient |
Scanty/ No Rain |
|||
| Number of Sub-Divisions (Total=36) |
|||||
| 1 |
2 |
3 |
4 |
5 |
6 |
| 2001 |
-8 |
1 |
30 |
5 |
0 |
| 2002 |
-19 |
1 |
14 |
19 |
2 |
| 2003 |
2 |
7 |
26 |
3 |
0 |
| 2004 |
-13 |
0 |
23 |
13 |
0 |
| 2005 |
-1 |
9 |
23 |
4 |
0 |
| 2006 |
-1 |
6 |
20 |
10 |
0 |
| Source: IMD. |
|||||
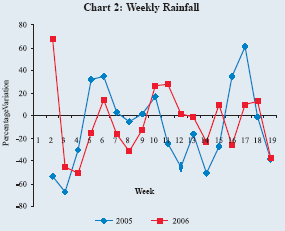
During the season, rainfall was not well distributed in time and space. Large rainfall deficiency was observed from the second to the fourth week of June and July, last week of August and during the middle of September, 2006 (Chart 2). The rainfall over the country as a whole was below normal in June (13 per cent below LPA) and near normal in July (2 per cent below LPA) and September (1 per cent below LPA). However, monsoon was active in August with excess rainfall (5 per cent above LPA) (Table 3). The excess rainfall during the first three weeks of August, especially over Central India, was responsible for the revival of the rainfall scenario over the country.
3 Excess: + 20 per cent or more; Normal: + 19 per cent to –19 per cent.
$ Deficient: –20 per cent to –59 per cent; Scanty: –60 per cent to –99 per cent.
No Rain: -100 per cent (All with respect to the Long Period Average).
| Table 3: Month-wise Rainfall during South-West Monsoon |
||
| Month |
Per cent Departure from Normal |
|
| 2005 |
2006 |
|
| June |
-12 |
-13 |
| July |
14 |
-2 |
| August |
-28 |
5 |
| September |
17 |
-1 |
| Source : IMD. |
||
Among the four homogeneous regions, South-West monsoon rainfall over North-West India (6 per cent) and South Peninsula (5 per cent) was below its LPA. Further, the largest deficiency was observed over North-East India (17 per cent). The near normal performance of the monsoon rainfall over the country was contributed mainly by the excess rainfall observed over Central India (16 per cent) as may be seen from the Table 4.
| Table 4: Region-wise Rainfall during the South-West |
|||
| Region |
Actual (mm) |
Normal (mm) |
Percentage Departure |
| All-India |
886.6 |
892.2 |
-1 |
| North-West India |
573.7 |
611.6 |
-6 |
| Central India |
1152.2 |
993.9 |
16 |
| South Peninsula |
684.6 |
722.6 |
-5 |
| North-East India |
1177.6 |
1427.3 |
-17 |
| Source : IMD. |
|||
DISTRICT LEVEL CUMULATIVE RAINFALL DURING SOUTH-WEST MONSOON 2006
Out of 533 meteorological districts, 59 per cent of the meteorological districts received excess/normal rainfall, while the remaining 41 per cent received deficient/scanty rainfall during the season (Statement 2). Further, 130 districts (25 per cent) experienced moderate drought and 30 districts (6 per cent) experienced severe drought conditions at the end of the season.
RESERVOIR STATUS
The Central Water Commission monitors the total live water storage in the 76 major reservoirs accounting for around 63 per cent of the total reservoir capacity of the country. As on September 28, 2006, the total live water storage was 91 per cent of the Full Reservoir Level (FRL) and 111 per cent of last year’s level. The water storage
| Table 5: Reservoir Status |
||||
| Status As On |
28.09.2003 |
28.09.2004 |
28.09.2005 |
28.09.2006 |
| Total Live Storage (BCM) |
77.706 |
83.832 |
108.062 |
120.451 |
| Percentage to Live Capacity at FRL |
58 |
63 |
81 |
91 |
| Source : Ministry of Water Resources, Government of India. |
||||
position during the corresponding period of last year stood at 81 per cent of FRL (Table 5).
PROGRESS OF SOWING
Agricultural production in India continues to be heavily dependent on the performance of South-West monsoon as it is crucial for production of major kharif crops, such as rice, coarse cereals, kharif pulses and oilseeds (mainly groundnut and soyabean). Kharif sowing during 2006 was affected due to uneven and delayed rainfall in some parts of the country. As a result, area coverage under kharif crops up to September 29, 2006 was around 2.1 per cent lower than a year ago (Table 6). The decline in area coverage was mainly on account of decline in sowing under coarse cereals and oilseeds. Rice witnessed only a marginal decline in area sown.
| Table 6: Summary of Progress of Kharif Crop |
|||||
| (Area in Million Hectares) |
|||||
| Crop |
Normal Area |
Area Coverage (as reported on 29.9.06) |
|||
| 2006-07 |
2005-06 |
Difference |
% change |
||
| Rice |
38.2 |
36.1 |
36.3 |
-0.2 |
-0.5 |
| Coarse Cereals |
22.9 |
20.6 |
22.2 |
-1.5 |
-6.8 |
| Of which |
|||||
| Jowar |
4.4 |
3.6 |
3.8 |
-0.1 |
-3.8 |
| Maize |
6.2 |
7.2 |
6.8 |
0.4 |
6.6 |
| Bajra |
9.4 |
8.0 |
9.4 |
-1.4 |
-14.6 |
| Total Pulses |
10.9 |
11.2 |
11.2 |
0.0 |
0.3 |
| Total Kharif Oilseeds |
15.4 |
16.4 |
17.4 |
-1.0 |
-5.6 |
| Of which |
|||||
| Sunflower |
0.5 |
0.8 |
0.9 |
-0.1 |
-9.6 |
| Sesamum |
1.5 |
1.7 |
1.8 |
0.0 |
-2.3 |
| Groundnut |
5.5 |
4.7 |
5.6 |
-0.9 |
-15.3 |
| Soyabean |
6.6 |
8.1 |
7.8 |
0.3 |
4.0 |
| Sugarcane |
4.2 |
4.4 |
4.3 |
0.2 |
3.9 |
| Cotton |
8.3 |
8.9 |
8.4 |
0.4 |
5.1 |
| All Crops |
99.8 |
97.7 |
99.8 |
-2.0 |
-2.1 |
| Source : Ministry of Agriculture, Government of India. |
|||||
| Statement 1 : Cumulative Rainfall |
||||||||
| Sub-Divisions |
June 1 to September 30, 2006 |
June 1 to September 30, 2005 |
||||||
| Actual (mm) |
Normal (mm) |
% deviation from Normal |
Actual (mm) |
Normal (mm) |
% deviation from Normal |
|||
| Andaman & Nicobar Islands |
1304.5 |
1755.2 |
-26 |
D |
1555.0 |
1755.2 |
-11 |
N |
| Arunachal Pradesh |
1294.6 |
1834.9 |
-29 |
D |
1602.9 |
1834.9 |
-13 |
N |
| Assam & Meghalaya |
1188.9 |
1885.3 |
-37 |
D |
1440.8 |
1885.3 |
-24 |
D |
| Nagaland, Manipur, |
979.2 |
1240.9 |
-21 |
D |
956.4 |
1240.9 |
-23 |
D |
| Mizoram & Tripura |
||||||||
| Sub-Himalayan West |
1708.3 |
1955.4 |
-13 |
N |
1813.1 |
1955.4 |
-7 |
N |
| Bengal and Sikkim |
||||||||
| Gangetic West Bengal |
1334.7 |
1136.3 |
17 |
N |
972.2 |
1136.3 |
-14 |
N |
| Orissa |
1550.1 |
1164.9 |
33 |
E |
1158.4 |
1160.0 |
0 |
N |
| Jharkhand |
1209.1 |
1092.5 |
11 |
N |
716.1 |
1104.6 |
-35 |
D |
| Bihar |
910.2 |
1039.2 |
-12 |
N |
819.0 |
1048.2 |
-22 |
D |
| East Uttar Pradesh |
701.1 |
913.6 |
-23 |
D |
747.1 |
913.6 |
-18 |
N |
| West Uttar Pradesh |
440.8 |
772.8 |
-43 |
D |
694.4 |
772.8 |
-10 |
N |
| Uttaranchal |
955.3 |
1223.1 |
-22 |
D |
1333.9 |
1223.1 |
9 |
N |
| Haryana, Chandigarh & Delhi |
288.4 |
470.0 |
-39 |
D |
474.8 |
470.0 |
1 |
N |
| Punjab |
437.3 |
501.8 |
-13 |
N |
464.1 |
501.8 |
-8 |
N |
| Himachal Pradesh |
592.6 |
773.7 |
-23 |
D |
709.4 |
773.7 |
-8 |
N |
| Jammu & Kashmir |
678.9 |
513.6 |
32 |
E |
449.8 |
513.6 |
-12 |
N |
| West Rajasthan |
333.4 |
262.8 |
27 |
E |
218.4 |
262.8 |
-17 |
N |
| East Rajasthan |
689.7 |
623.6 |
11 |
N |
584.5 |
623.6 |
-6 |
N |
| West Madhya Pradesh |
1062.2 |
904.3 |
17 |
N |
761.1 |
904.3 |
-16 |
N |
| East Madhya Pradesh |
903.4 |
1097.4 |
-18 |
N |
1312.7 |
1097.4 |
20 |
E |
| Gujarat Region, Daman, |
1448.9 |
933.6 |
55 |
E |
1384.1 |
933.6 |
48 |
E |
| Dadra & Nagar Haveli |
||||||||
| Saurashtra & Kutch |
699.8 |
485.7 |
44 |
E |
637.2 |
485.7 |
31 |
E |
| Konkan and Goa |
2997.4 |
2802.1 |
7 |
N |
3485.5 |
2802.1 |
24 |
E |
| Madhya Maharashtra |
1112.5 |
700.1 |
59 |
E |
1011.1 |
700.1 |
44 |
E |
| Marathwada |
723.7 |
704.3 |
3 |
N |
758.3 |
704.3 |
8 |
N |
| Vidarbha |
1056.1 |
976.2 |
8 |
N |
1049.8 |
976.2 |
8 |
N |
| Chhattisgarh |
1077.5 |
1205.8 |
-11 |
N |
1080.8 |
1205.8 |
-10 |
N |
| Coastal Andhra Pradesh |
576.4 |
575.2 |
0 |
N |
634.7 |
575.2 |
10 |
N |
| Telangana |
829.9 |
767.3 |
8 |
N |
966.9 |
767.3 |
26 |
E |
| Rayalaseema |
320.3 |
380.9 |
-16 |
N |
463.7 |
380.9 |
22 |
E |
| Tamil Nadu & Pondicherry |
248.2 |
315.6 |
-21 |
D |
294.2 |
315.6 |
-7 |
N |
| Coastal Karnataka |
3092.4 |
3173.9 |
-3 |
N |
2941.6 |
3173.9 |
-7 |
N |
| North Interior Karnataka |
433.1 |
490.9 |
-12 |
N |
609.4 |
490.9 |
24 |
E |
| South Interior Karnataka |
613.6 |
659.3 |
-7 |
N |
842.1 |
659.3 |
28 |
E |
| Kerala |
2021.3 |
2143.0 |
-6 |
N |
2245.1 |
2143.0 |
5 |
N |
| Lakshadweep |
928.2 |
985.2 |
-6 |
N |
1011.0 |
985.2 |
3 |
N |
| All India |
886.6 |
892.2 |
-1 |
N |
879.3 |
892.5 |
-1 |
N |
| Number of Sub-Divisions |
||||||||
| Excess |
6 |
9 |
||||||
| Normal |
20 |
23 |
||||||
| Deficient |
10 |
4 |
||||||
| Scanty |
0 |
0 |
||||||
| No Rain |
0 |
0 |
||||||
| Total |
36 |
36 |
||||||
| Excess: + 20 per cent or more; Normal: + 19 per cent to –19 per cent. |
||||||||
| Statement 2 : State-wise Distribution of No. of Districts according to Quantum of Rainfall |
|||||||||||||
| June 1, 2006 to September 30, 2006 |
|||||||||||||
| STATE/UT |
E |
N |
D |
S |
NR |
ND |
TOTAL |
||||||
| A & N Islands (UT) |
0 |
1 |
1 |
0 |
0 |
0 |
2 |
||||||
| Arunachal Pradesh |
2 |
3 |
5 |
3 |
0 |
0 |
13 |
||||||
| Assam |
0 |
9 |
12 |
0 |
0 |
1 |
22 |
||||||
| Meghalaya |
0 |
1 |
1 |
1 |
0 |
0 |
3 |
||||||
| Nagaland |
0 |
0 |
3 |
1 |
0 |
0 |
4 |
||||||
| Manipur |
0 |
1 |
1 |
0 |
0 |
1 |
3 |
||||||
| Mizoram |
1 |
1 |
0 |
0 |
0 |
0 |
2 |
||||||
| Tripura |
0 |
2 |
1 |
0 |
0 |
0 |
3 |
||||||
| Sikkim |
0 |
1 |
0 |
0 |
0 |
0 |
1 |
||||||
| West Bengal |
3 |
12 |
2 |
0 |
0 |
0 |
17 |
||||||
| Orissa |
21 |
8 |
1 |
0 |
0 |
0 |
30 |
||||||
| Jharkhand |
5 |
4 |
1 |
1 |
0 |
4 |
15 |
||||||
| Bihar |
1 |
14 |
10 |
0 |
0 |
7 |
32 |
||||||
| Uttar Pradesh |
0 |
18 |
41 |
5 |
0 |
0 |
64 |
||||||
| Uttaranchal |
0 |
5 |
5 |
2 |
0 |
0 |
12 |
||||||
| Haryana |
0 |
1 |
15 |
3 |
0 |
0 |
19 |
||||||
| Chandigarh (UT) |
0 |
0 |
1 |
0 |
0 |
0 |
1 |
||||||
| Delhi (UT) |
0 |
0 |
1 |
0 |
0 |
0 |
1 |
||||||
| Punjab |
3 |
4 |
8 |
0 |
0 |
1 |
16 |
||||||
| Himachal Pradesh |
1 |
5 |
5 |
1 |
0 |
0 |
12 |
||||||
| Jammu & Kashmir |
5 |
4 |
1 |
0 |
0 |
1 |
11 |
||||||
| Rajasthan |
10 |
6 |
16 |
0 |
0 |
0 |
32 |
||||||
| Madhya Pradesh |
15 |
13 |
17 |
0 |
0 |
0 |
45 |
||||||
| Chhattisgarh |
0 |
9 |
7 |
0 |
0 |
0 |
16 |
||||||
| Gujarat |
22 |
3 |
0 |
0 |
0 |
0 |
25 |
||||||
| Dadra and Nagar Haveli & Daman (UTs) |
0 |
1 |
0 |
0 |
0 |
0 |
1 |
||||||
| Diu (UT) |
0 |
0 |
0 |
0 |
0 |
1 |
1 |
||||||
| Goa |
0 |
1 |
0 |
0 |
0 |
0 |
1 |
||||||
| Maharashtra |
12 |
20 |
1 |
0 |
0 |
0 |
33 |
||||||
| Andhra Pradesh |
6 |
11 |
6 |
0 |
0 |
0 |
23 |
||||||
| Tamilnadu |
2 |
11 |
17 |
0 |
0 |
0 |
30 |
||||||
| Pondicherry (UT) |
0 |
0 |
1 |
0 |
0 |
0 |
1 |
||||||
| Karnataka |
3 |
10 |
14 |
0 |
0 |
0 |
27 |
||||||
| Kerala |
0 |
13 |
1 |
0 |
0 |
0 |
14 |
||||||
| Lakshadweep (UT) |
0 |
1 |
0 |
0 |
0 |
0 |
1 |
||||||
| Total |
112 |
193 |
195 |
17 |
0 |
16 |
533 |
||||||
| Percent Distribution of Districts |
|||||||||||||
| according to Category of Rainfall |
22 |
37 |
38 |
3 |
0 |
0 |
100 |
||||||
| E:Excess. N: Normal. D: Deficient. |
|||||||||||||

ਇਸ ਪੇਜ ਨੂੰ ਸ਼ੇਅਰ ਕਰੋ:


ਭਾਰਤੀ ਰਿਜ਼ਰਵ ਬੈਂਕ ਮੋਬਾਈਲ ਐਪਲੀਕੇਸ਼ਨ ਇੰਸਟਾਲ ਕਰੋ ਅਤੇ ਨਵੀਨਤਮ ਖਬਰਾਂ ਤੱਕ ਤੇਜ਼ ਐਕਸੈਸ ਪ੍ਰਾਪਤ ਕਰੋ!


