Global financial markets witnessed further improvement in Q4 of 2009, driven by traction gained from the global economic recovery, notwithstanding concerns about the shape of the global recovery, the uncertainties arising from the timing and speed of withdrawal of monetary accommodation and fiscal stimulus and large overhang of public debt in advanced economies. In the domestic markets, the overall financial market conditions in Q3 of 2009-10 were characterised by relatively low risk spreads, higher volume and a modest decline in the cost of funds. Interest rates in money markets remained low; medium to long term bond yields, however, hardened on concerns of fiscal deficit and inflationary expectations. The stock markets further consolidated the gains and the primary market witnessed considerable pickup in mobilisation of funds. The rupee appreciated against major currencies on revival of capital inflows. V.1 Global financial markets remained largely stable in Q4 of 2009 but for a temporary period of uncertainty associated with Dubai World incident and subsequent greater emphasis of the markets on sovereign risks. The financial markets, though have become increasingly sensitive to uncertainties arising from uneven recoveries across regions, jobless recovery and its impact on demand, the shape of the global recovery, public policy stance on financial support to entities affected by the crisis, and the consequences of eventual withdrawal of monetary accommodation (i.e., low interest rates and easy liquidity) and fiscal stimulus (i.e., high public expenditures and tax cuts). Furthermore, financial markets seem to be concerned about the long-term costs associated with excessively high public debt, particularly in the advanced economies, and their future sustainability. Credit default swap (CDS) spreads on corporate bonds in the US and Europe eased further. Recent developments such as the payment default by Dubai World on its debt obligations, however, suggest that there could be risk re-pricing of the bonds issued by public entities with only implicit guarantees. The liquidity in money markets remained easy with subdued spreads. Yields on government bonds also remained moderate, although witnessed some pressure due to concerns of high public debt in the advanced economies. The global stock markets continued to be conditioned by the positive economic data flowing through Q4 of 2009, with further gains seen in both the advanced and the emerging market stocks, albeit marked by some volatility. The uneven pace of recovery in asset prices vis-à-vis the real economy remains a concern for the policy makers. The US dollar, aided by low policy rates, remains weak against major international currencies.
V.2 As the Indian economy remained ahead of the advanced economies in the recovery cycle, the domestic financial markets witnessed greater stability, and risk levels generally remained low in relation to the global markets. Short-term interest rates, reflected in money market rates, remained low and stable within the LAF corridor. The liquidity conditions continued to remain easy. However, there was some decline in the surplus liquidity in the financial markets towards the end of Q3 of 2009-10 owing to advance tax outflows. The long-term government bond yields, however, rose steadily reflecting the large government borrowings. The concerns from large fiscal deficit and potential inflationary pressures were also reflected in the continuous upward shift in the yield curve in the medium to long spectrum of the maturity. The government borrowing programme was front loaded in order to provide space for private credit demand later in the year. The corporate bond yields also showed some hardening as the pace of economic activity accelerated in Q3 of 2009-10. The lending rates of banks, however, moderated, reflecting lagged transmission of policy rates. The equity prices witnessed further gains in Q3 of 2009-10, albeit only marginally over Q2. The primary capital market activity gained traction with substantial rise in private placement by the non-financial companies and sharp growth in funds mobilised by the mutual funds. The significant rise in the resources raised by the corporates through commercial papers indicated investment activities gaining further strength.
International Financial Markets
V.3 The activities in global financial markets in Q4 were significantly conditioned by the pace and shape of global economic recovery that mainly drove investor expectations. With steady flow of positive economic data indicating that the major emerging market economies (EMEs) were clearly on course to a higher growth trajectory and that the US, the EU and Japan witnessed dramatic improvement in GDP growth in 2009:Q3, investors’ risk perceptions further receded. Nevertheless,markets remained apprehensive due to potential risks posed by uncertainties about the pace and shape of recovery, timing and speed of exit from fiscal-monetary stimulus and the lack of synchronisation of recovery across regions and the potential for buildup of imbalances. With the global economy on course to recovery, the focus of markets has shifted to potential inflationary pressures, particularly from commodity prices. As the actual output remains significantly below the capacity output in advanced economies, concerns about inflation remain largely contained. However, inflation is emerging a concern for many EMEs.
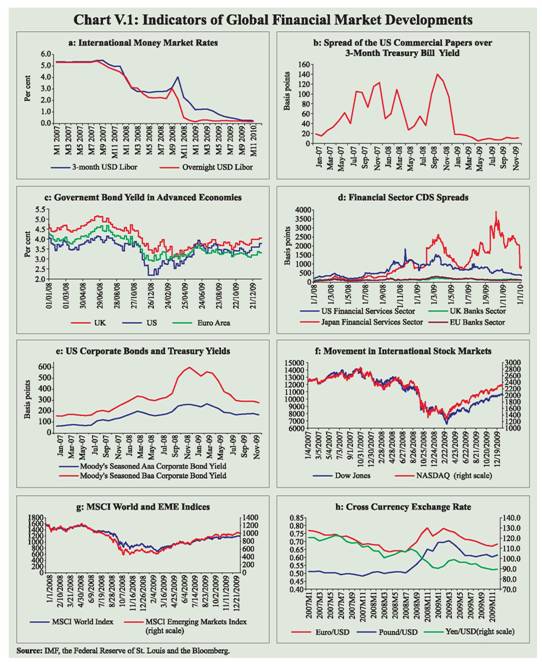
V.4 The continuance of easy liquidity conditions in money markets in Q4 of 2009 was evident from the significant and sustained low inter-bank rates in relation to the peak seen during the early phase of the global crisis and narrow spreads (Charts V.1a and b). With signals from the major central banks in the advanced economies that the interest rates may remain low for some time, the bond yields remained subdued (Chart V.1c). CDS on government bonds have, however, increased over time. The risk perception on financial sector and corporate bonds generally receded in Q4, reflected in lower CDS spreads for financial sector and further reduction in the corporate bond spreads (Chart V.1d and e).
V.5 The US stocks recorded gains of 7 per cent over Q3 of 2009, which were relatively moderate (Chart V.1f). Although the gains in equity prices in both the advanced economies and EMEs were relatively lower in Q4 as compared to Q3 (Chart V.1g), EMEs witnessed larger gains as compared to the advanced economies.
The gains in EME asset prices were aided by a number of factors such as a robust economic recovery, reduced risks, low interest rates in the advanced economies and associated arbitrage in the form of carry trade from low yielding currencies to high yielding EME currencies and strong capital flows to emerging market equities in search for higher yield. The MSCI for EMEs recorded 8 per cent increase at the end of Q4 over Q3. The MSCI for EMEs increased by 74 per cent between end-March and end-December 2009 with variations across EMEs (Table 5.1). The largest bout of volatility in equity prices across markets was caused by the announcement on November 25, 2009 that the Dubai World was seeking ‘standstill’ on its maturing liabilities. The risks from Dubai crisis led to jump in CDS premia across the Middle East countries.
Table 5.1: Currency and Stock Price Movement in EMEs |
(Per cent) |
Items |
End-
March 08 @ |
End-
March 09 @ |
Jan 20, 2010* |
Items |
End-@ March 08 |
End-09 March @ |
End-Dec. 2009* |
1 |
2 |
3 |
4 |
1 |
5 |
6 |
7 |
Appreciation (+)/Depreciation (-) of the US Dollar |
Stock Price Variations |
Chinese Yuan |
-9.3 |
-2.6 |
-0.1 |
Indonesia |
33.7 |
-41.4 |
76.7 |
Russian Ruble |
-9.7 |
44.3 |
-12.9 |
(Jakarta Composite) |
|
|
|
Turkish Lira |
-5.8 |
27.7 |
-12.7 |
Brazil (Bovespa) |
33.1 |
-32.9 |
67.6 |
Indian Rupee |
-8.3 |
27.5 |
-10.5 |
Thailand (SET Composite) |
21.3 |
-47.2 |
70.2 |
Indonesian Rupiah |
1.1 |
25.6 |
-20.3 |
India (BSE Sensex) |
19.7 |
-37.9 |
79.9 |
Malaysian Ringgit |
-7.8 |
14.4 |
-8.5 |
South Korea (KOSPI) |
17.3 |
-29.2 |
39.5 |
South Korea Won |
5.5 |
38.9 |
-18.2 |
|
|
|
|
Thai Baht |
-10.2 |
12.9 |
-7.4 |
China (Shanghai SE Composite) |
9.1 |
-31.7 |
38.1 |
Argentine Peso |
2.1 |
17.3 |
2.4 |
Taiwan (Taiwan Index) |
8.7 |
-39.2 |
57.1 |
Brazilian Real |
-17.0 |
31.2 |
-20.8 |
Russia (RTS) |
6.1 |
-66.4 |
109.5 |
Mexican Peso |
-3.5 |
32.9 |
-10.6 |
Malaysia (KLSE Composite) |
0.1 |
-30.1 |
45.9 |
South African Rand |
11.3 |
17.2 |
-21.8 |
Singapore (Straits Times) |
-4.9 |
-43.5 |
70.4 |
@: Year-on-year variation. *: Variation over end-March 2009. |
V.6 In the foreign exchange market, the depreciating trend of the US dollar witnessed during the first half of 2009-10, generally continued during Q3 as well on the back of declining safe haven flows to the US, continuation of easy monetary policy and change in market sentiment against the dollar. However, the dollar gained some strength against major currencies, especially in December 2009, on the back of various indicators suggesting a pick-up in economic activity, followed by a spell of weakness in January 2010. Between end-March 2009 and January 20, 2010, the US dollar depreciated by 6.8 per cent against the euro, 12.2 per cent against the pound sterling and 7.7 per cent against the Japanese yen (chart V.1h). The US dollar also generally depreciated against the EME currencies (Table 5.1). The appreciating pressures on the currencies of several EMEs, led countries such as Brazil and Taiwan to resort to variants of Tobin tax to contain capital inflows.
Domestic Financial Markets
V.7 The domestic financial markets continued to witness low risks and greater volumes in various market segments (Table 5.2). During Q3 of 2009-10, the call money market rate continued to remain towards the lower bound of the LAF corridor, albeit with some increase in December 2009 and January 2010. Moderation in liquidity, reflected in relatively lower balances parked by the commercial banks in the reverse repo facility, was essentially a result of advance tax payments and is, hence, temporary. The long-term yield, in contrast, witnessed some increase, emanating from large supply of government bonds. The gains in equity prices strengthened further in Q3 of 2009-10 over Q2, albeit marginally, with sporadic volatility caused by news about fundamentals and external shocks. In the foreign exchange market, transactions volume remained steady, including steady growth in currency future volumes, and the rupee appreciated in Q3 of 2009-10 as capital inflows turned robust.
Table 5.2: Domestic Financial Markets at a Glance |
Year/ Month |
Call Money |
Government Securities |
Foreign Exchange |
Liquidity Management |
Equity |
Aver
age
Daily
Turnover
(Rs.
crore) |
Aver
age
Call
Rates*
(Per
cent) |
Aver
age Turn
over in Govt. Securities (Rs. crore)^ |
Aver
age
10-
Year
Yield
@
(Per
cent) |
Aver
age Daily Inter
bank
Turn
over
(US$
million) |
Aver
age
Exchange
Rate
(Rs. per
US$) |
RBI’s
Net
Foreign
Currency
Sales
(-)/
Pur
chases
(+)
(US$
million) |
Aver
age
MSS
Out-
stan
ding
# (Rs.
crore) |
Aver
age Daily Rev
erse Repo
(LAF) Out
stan
ding
(Rs. crore) |
Aver
age
Daily
BSE
Turn
over
(Rs.
crore) |
Aver
age
Daily
NSE
Turn
over
(Rs.
crore) |
Aver
age
BSE
Sensex
** |
Aver
age
S&P CNX
Nifty
** |
1 |
2 |
3 |
4 |
5 |
6 |
7 |
8 |
9 |
10 |
11 |
12 |
13 |
14 |
2006-07 |
21,725 |
7.22 |
4,863 |
7.78 |
18,717 |
45.28 |
26,824† |
37,698 |
21,973 |
3,866 |
7,812 |
12277 |
3572 |
2007-08 |
21,393 |
6.07 |
8,104 |
7.91 |
34,044 |
40.24 |
78,203† |
1,28,684 |
4,677 |
6,275 |
14,148 |
16569 |
4897 |
2008-09 |
22,436 |
7.06 |
10,879 |
7.54 |
34,812 |
45.92 |
-2,910† |
1,48,889 |
2,885 |
4,498 |
11,272 |
12303 |
3713 |
Apr 2008 |
19,516 |
6.11 |
6,657 |
8.10 |
37,580 |
40.02 |
4,325 |
1,70,726 |
26,359 |
5,773 |
13,561 |
16291 |
4902 |
May 2008 |
19,481 |
6.62 |
8,780 |
7.94 |
32,287 |
42.13 |
148 |
1,75,565 |
11,841 |
6,084 |
13,896 |
16946 |
5029 |
Jun 2008 |
21,707 |
7.75 |
6,835 |
8.41 |
38,330 |
42.82 |
-5,229 |
1,74,433 |
-8,622 |
5,410 |
12,592 |
14997 |
4464 |
Jul 2008 |
24,736 |
8.76 |
5,474 |
9.18 |
37,173 |
42.84 |
-6,320 |
1,72,169 |
-27,961 |
5,388 |
12,862 |
13716 |
4125 |
Aug 2008 |
23,408 |
9.10 |
7,498 |
9.06 |
38,388 |
42.94 |
1,210 |
1,71,944 |
-22,560 |
4,996 |
11,713 |
14722 |
4417 |
Sep 2008 |
23,379 |
10.52 |
10,418 |
8.38 |
44,700 |
45.56 |
-3,784 |
1,75,666 |
-42,591 |
5,147 |
12,489 |
13943 |
4207 |
Oct 2008 |
28,995 |
9.90 |
8,641 |
7.84 |
36,999 |
48.66 |
-18,666 |
1,69,123 |
-45,612 |
3,911 |
10,810 |
10550 |
3210 |
Nov 2008 |
21,812 |
7.57 |
11,732 |
7.41 |
31,322 |
49.00 |
-3,101 |
1,47,648 |
-8,017 |
3,539 |
9,618 |
9454 |
2835 |
Dec 2008 |
21,641 |
5.92 |
22,903 |
5.88 |
34,874 |
48.63 |
-318 |
1,24,848 |
22,294 |
3,851 |
10,141 |
9514 |
2896 |
Jan 2009 |
18,496 |
4.18 |
19,136 |
5.84 |
27,895 |
48.83 |
-29 |
1,13,535 |
45,474 |
3,526 |
9,559 |
9350 |
2854 |
Feb 2009 |
22,241 |
4.16 |
11,831 |
5.98 |
25,068 |
49.26 |
230 |
1,02,934 |
50,649 |
2,859 |
7,887 |
9188 |
2819 |
Mar 2009 |
23,818 |
4.17 |
10,644 |
6.58 |
33,126 |
51.23 |
-3,388 |
88,077 |
33,360 |
3,489 |
10,140 |
8966 |
2802 |
Apr 2009 |
21,820 |
3.28 |
15,997 |
6.55 |
27,796 |
50.06 |
-2,487 |
75,146 |
1,01,561 |
5,232 |
15,688 |
10911 |
3360 |
May 2009 |
19,037 |
3.17 |
14,585 |
6.41 |
32,227 |
48.53 |
-1,437 |
45,955 |
1,25,728 |
6,427 |
19,128 |
13046 |
3958 |
Jun 2009 |
17,921 |
3.21 |
14,575 |
6.83 |
32,431 |
47.77 |
1,044 |
27,140 |
1,23,400 |
7,236 |
21,928 |
14782 |
4436 |
Jul 2009 |
14,394 |
3.21 |
17,739 |
7.01 |
30,638 |
48.48 |
-55 |
22,159 |
1,30,891 |
6,043 |
18,528 |
14635 |
4343 |
Aug 2009 |
15,137 |
3.22 |
9,699 |
7.18 |
27,306 |
48.34 |
181 |
19,804 |
1,28,275 |
5,825 |
17,379 |
15415 |
4571 |
Sep 2009 |
16,118 |
3.31 |
16,988 |
7.25 |
27,824 |
48.44 |
80 |
18,773 |
1,21,083 |
6,211 |
18,253 |
16338 |
4859 |
Oct 2009 |
15,776 |
3.17 |
12,567 |
7.33 |
28,402 |
46.72 |
75 |
18,773 |
1,01,675 |
5,700 |
18,148 |
16826 |
4994 |
Nov 2009 |
13,516 |
3.19 |
17,281 |
7.33 |
27,303 |
46.57 |
-36 |
18,773 |
1,01,719 |
5,257 |
16,224 |
16684 |
4954 |
Dec 2009 |
13,302 |
3.24 |
14,110 |
7.57 |
27,431 |
46.63 |
- |
18,773 |
68,522 |
4,671 |
13,948 |
17090 |
5100 |
* : Average of daily weighted call money borrowing rates. ^ : Average of daily outright turnover in Central Government dated securities.
@ : Average of daily closing rates. # : Average of weekly outstanding MSS.
** : Average of daily closing indices. † : Cumulative for the financial year.
LAF : Liquidity Adjustment Facility. MSS : Market Stabilisation Scheme. BSE : Bombay Stock Exchange Limited.
NSE : National Stock Exchange of India Limited. - : Not available.
Note : In column 10, (-) indicates injection of liquidity, while (+) indicates absorption of liquidity. |
Liquidity Management
V.8 Liquidity conditions remained easy during Q3 of 2009-10, even though the daily absorption under LAF declined during Q3 in comparison with that of Q2 (Table 5.3). The total MSS unwinding and auction-based open market operation (OMO) purchases during 2009-10 so far amounted to Rs.81,036 crore and Rs.57,487 crore, respectively. The decline in the average LAF absorption in Q3 of 2009-10 as compared with Q2 was mainly on account of the absence of MSS redemptions and OMO auctions. In addition, increases in cash balances of the Central Government with the Reserve Bank contributed to decline in daily absorption under LAF. The absorption through the reverse repo window declined significantly during the second half of December 2009, mainly on account of advance tax outflows. The liquidity conditions have eased in January 2010 so far on account of decline in cash balances of the Central Government and redemptions under MSS.
Table 5.3: Liquidity Position |
(Rupees crore) |
Outstanding as on Last Friday |
LAF |
MSS |
Centre’s
Surplus
@ |
Total
(2 to 4) |
Outstanding as on Last Friday |
LAF |
MSS |
Centre’s
Surplus
@ |
Total
(6 to 8) |
1 |
2 |
3 |
4 |
5 |
1 |
6 |
7 |
8 |
9 |
2008 |
|
|
|
|
2009 |
|
|
|
|
January |
985 |
1,66,739 |
70,657 |
2,38,381 |
January |
54,605 |
1,08,764 |
-9,166 |
1,54,203 |
February |
8,085 |
1,75,089 |
68,538 |
2,51,712 |
February |
59,820 |
1,01,991 |
-9,603 |
1,52,208 |
March * |
-50,350 |
1,68,392 |
76,586 |
1,94,628 |
March* |
1,485 |
88,077 |
16,219 |
1,05,781 |
April |
32,765 |
1,72,444 |
36,549 |
2,41,758 |
April |
1,08,430 |
70,216 |
-40,412 |
1,38,234 |
May |
-9,600 |
1,75,362 |
17,102 |
1,82,864 |
May |
1,10,685 |
39,890 |
-6,114 |
1,44,461 |
June |
-32,090 |
1,74,433 |
36,513 |
1,78,856 |
June |
1,31,505 |
22,890 |
12,837 |
1,67,232 |
July |
-43,260 |
1,71,327 |
15,043 |
1,43,110 |
July |
1,39,690 |
21,063 |
26,440 |
1,87,193 |
August |
-7,600 |
1,73,658 |
17,393 |
1,83,451 |
August |
1,53,795 |
18,773 |
45,127 |
2,17,695 |
September |
-56,480 |
1,73,804 |
40,358 |
1,57,682 |
September |
1,06,115 |
18,773 |
80,775 |
2,05,663 |
October |
-73,590 |
1,65,187 |
14,383 |
1,05,980 |
October |
84,450 |
18,773 |
69,391 |
1,72,614 |
November |
-9,880 |
1,32,531 |
7,981 |
1,30,632 |
November |
94,070 |
18,773 |
58,460 |
1,71,303 |
December |
14,630 |
1,20,050 |
3,804 |
1,38,484 |
December |
19,785 |
18,773 |
1,03,438 |
1,41,996 |
|
|
|
|
|
2010 |
|
|
|
|
|
|
|
|
|
January (15) |
80,780 |
7,737 |
60,121 |
1,48,638 |
@ : Excludes minimum cash balances with the Reserve Bank in case of surplus.
* : Data pertain to March 31.
Note : 1. Negative sign under LAF indicates injection of liquidity through LAF.
2.The Second LAF, conducted on a daily basis from September 17, 2008 to May 5, 2009 is being conducted only on
reporting Fridays from May 8, 2009.
3. Negative sign under centre’s surplus indicates WMA/OD. |
V.9 The key drivers of liquidity in Q3 of 2009-10 were uptick in seasonal currency demand and build up of Centre’s surplus balances (Table 5.4). Keeping in view the persistence of comfortable liquidity conditions, the Reserve Bank, in its Second Quarter Review of Monetary Policy 2009-10, restored the SLR for SCBs to 25 per cent with effect from the fortnight beginning November 7, 2009. Keeping the utilisation of the various facilities in view and taking into account the liquidity conditions in the market, the special term repo facility and the forex swap facility for banks were discontinued with immediate effect; there are no outstanding balances under these facilities since August 17, 2009 and November 16, 2009, respectively.
Table 5.4: Reserve Bank's Liquidity Management Operations |
(Rupees crore) |
Item |
2008-09 |
2008-09 |
2009-10 |
|
Q1 |
Q2 |
Q3 |
Q4 |
Apr-Mar |
Q1 |
Q2 |
Q3
|
1 |
2 |
3 |
4 |
5 |
6 |
7 |
8 |
9 |
A. |
Drivers of Liquidity (1+2+3+4) |
6,061 |
-18,851 - |
1,01,278 |
-53,641 |
-1,67,709 |
-44,600 |
-46,367 |
-89,870 |
1. |
RBI’s net Purchase from Authorised Dealers |
-8,555 |
-40,249 - |
1,12,168 |
-17,620 |
-1,78,592 |
-15,874 |
2,523 |
436 |
2. |
Currency with the Public |
-30,063 |
12,360 |
-40,070 |
-40,147 |
-97,921 |
-18,180 |
-8,874 |
-43,256 |
3. |
a. Surplus Cash balances of the |
|
|
|
|
|
|
|
|
|
Centre with RBI |
40,073 |
-3,845 |
36,554 |
-12,415 |
60,367 |
3,382 |
-67,938 |
-22,663 |
|
b. WMA and OD |
0 |
0 |
0 |
0 |
0 |
0 |
0 |
0 |
4. |
Others (residual) |
4,606 |
12,884 |
14,406 |
16,541 |
48,437 |
-13,928 |
29,921 |
-24,346 |
B. |
Management of Liquidity (5+6+7+8) |
-37,659 |
7,217 |
1,33,325 |
1,32,326 |
2,35,209 |
-21,674 |
62,376 |
1,12,734 |
5. |
Liquidity impact of LAF Repos |
-18,260 |
24,390 |
-71,110 |
13,145 |
-51,835- |
1,30,020 |
25,390 |
86,330 |
6. |
Liquidity impact of OMO* (net) |
14,642 |
11,949 |
10,681 |
67,208 |
1,04,480 |
43,159 |
32,869 |
3,540 |
7. |
Liquidity impact of MSS |
-6,041 |
628 |
53,754 |
31,973 |
80,314 |
65,187 |
4,117 |
0 |
8. |
First round liquidity impact |
|
|
|
|
|
|
|
|
|
due to CRR change |
-28,000 |
-29,750 |
1,40,000 |
20,000 |
1,02,250 |
0 |
0 |
0 |
C. |
Bank Reserves # (A+B) |
-31,598 |
-11,634 |
32,047 |
78,685 |
67,500 |
-66,274 |
18,009 |
22,865 |
(+): Indicates injection of liquidity into the banking system.
(-) : Indicates absorption of liquidity from the banking system.
* : Includes oil bonds but excludes purchases of government securities on behalf of State Governments.
# : Includes vault cash with banks and adjusted for first round liquidity impact due to CRR change.
Note : Data pertain to March 31 and last Friday for all other months. |
V.10 For managing the government market borrowings in a non-disruptive manner, the Reserve Bank had expressed its intention to purchase government securities amounting to Rs.80,000 crore under the OMO programme for the first half of 2009-10, of which Rs. 57,487 crore were purchased till September 2009. For the second half of 2009-10, the Reserve Bank decided to conduct OMOs as and when considered necessary.
Money Market
V.11 The money market continued to remain orderly during Q3 of 2009-10. Reflecting the surplus liquidity conditions, the call rate hovered around the lower bound of the informal LAF corridor during Q3 of 2009-10 (Chart V.2a). Interest rates in the collateralised segments of the money market- the market repo (outside the LAF) and the collateralised borrowing and lending obligation (CBLO) – moved in tandem with the call rate during Q3 of 2009-10 but remained below it (Chart V.2b). V.12 Transaction volumes in the CBLO and market repo segments continued to remain high during Q3 of 2009-10 reflecting the easy liquidity and active market conditions (Table 5.5). Banks as a group continue to be the major borrowers in the collateralised segment whereas mutual funds (MFs) remain the single largest lender of funds in that segment. In fact, more than 75 per cent of the lending in the collateralised segment was contributed by the MFs in Q3, reflecting their continued enhanced lending capacity. The collateralised market continued to remain the predominant segment of the money market, accounting for more than 80 per cent of the total volume in the money market in Q3 of 2009-10.
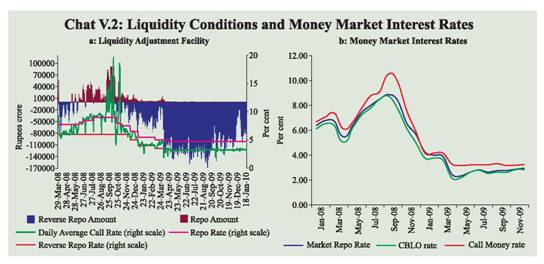 |
Table 5.5: Activity in Money Market Segments |
(Rupees crore) |
Year/Month |
Call |
Average Daily Volume (One Leg) |
Commercial Paper |
Certificates of Deposit |
Market Repo |
CBLO |
Total
(2 to 4) |
Money
Market
Rate*
(per cent) |
Term Money |
Outstanding |
WADR (Per cent) |
Outstanding |
WADR (Per cent) |
1 |
2 |
3 |
4 |
5 |
6 |
7 |
8 |
9 |
10 |
11 |
Apr-08 |
9,758 |
14,966 |
38,828 |
63,552 |
5.31 |
374 |
37,584 |
8.85 |
1,50,865 |
8.49 |
May-08 |
9,740 |
14,729 |
36,326 |
60,795 |
6.29 |
420 |
42,032 |
9.02 |
1,56,780 |
8.95 |
Jun-08 |
10,854 |
11,262 |
35,774 |
57,890 |
7.35 |
253 |
46,847 |
10.03 |
1,63,143 |
9.16 |
Jul-08 |
12,368 |
8,591 |
23,669 |
44,628 |
8.09 |
226 |
51,569 |
10.95 |
1,64,892 |
10.23 |
Aug-08 |
11,704 |
10,454 |
22,110 |
44,268 |
8.65 |
501 |
55,036 |
11.48 |
1,71,966 |
10.98 |
Sep-08 |
11,690 |
10,654 |
20,547 |
42,891 |
9.26 |
335 |
52,038 |
12.28 |
1,75,522 |
11.56 |
Oct-08 |
14,497 |
9,591 |
16,818 |
40,906 |
8.66 |
345 |
48,442 |
14.17 |
1,58,562 |
10.00 |
Nov-08 |
10,906 |
15,191 |
24,379 |
50,476 |
6.58 |
319 |
44,487 |
12.42 |
1,51,493 |
10.36 |
Dec-08 |
10,820 |
16,943 |
32,261 |
60,024 |
5.37 |
415 |
40,391 |
10.70 |
1,51,214 |
8.85 |
Jan-09 |
9,248 |
18,053 |
31,794 |
59,095 |
3.99 |
454 |
51,668 |
9.48 |
1,64,979 |
7.33 |
Feb-09 |
11,121 |
19,929 |
38,484 |
69,534 |
3.89 |
669 |
52,560 |
8.93 |
1,75,057 |
6.73 |
Mar-09 |
11,909 |
21,593 |
48,319 |
81,821 |
3.76 |
451 |
44,171 |
9.79 |
1,92,867 |
7.53 |
Apr-09 |
10,910 |
20,545 |
43,958 |
75,413 |
2.41 |
332 |
52,881 |
6.29 |
2,10,954 |
6.48 |
May-09 |
9,518 |
22,449 |
48,505 |
80,472 |
2.34 |
338 |
60,740 |
5.75 |
2,18,437 |
6.20 |
Jun-09 |
8,960 |
21,694 |
53,553 |
84,207 |
2.69 |
335 |
68,721 |
5.00 |
2,21,491 |
4.90 |
Jul-09 |
7,197 |
20,254 |
46,501 |
73,952 |
2.83 |
389 |
79,582 |
4.71 |
2,40,395 |
4.96 |
Aug-09 |
7,569 |
23,305 |
57,099 |
87,973 |
2.62 |
461 |
83,026 |
5.05 |
2,32,522 |
4.91 |
Sep-09 |
8,059 |
27,978 |
62,388 |
98,425 |
2.73 |
381 |
79,228 |
5.04 |
2,16,691 |
5.30 |
Oct-09 |
7,888 |
23,444 |
58,313 |
89,645 |
2.70 |
225 |
98,835 |
5.06 |
2,27,227 |
4.70 |
Nov-09 |
6,758 |
22,529 |
54,875 |
84,162 |
2.87 |
191 |
1,03,915 |
5.17 |
2,45,101 |
4.86 |
Dec-09 |
6,651 |
20,500 |
55,338 |
82,489 |
2.91 |
289 |
- |
- |
2,43,584 + |
4.84 + |
WADR : Weighted Average Discount Rate
*: Weighted average rate of call, market repo and CBLO. +: As on December 4, 2009. |
Certificates of Deposit
V.13 With the easing of liquidity conditions, the fortnightly average issuance of certificates of deposit (CD) has picked up in 2009-10 so far (refer Table V.5). Most of the CDs issued were of more than six month duration.
Commercial Paper
V.14 During 2009-10, the commercial paper (CP) market also picked up and the size of fortnightly issuances also increased significantly as easy liquidity conditions prevailed and corporates’ demand for working capital rose (refer Table 5.5 and 5.6). Treasury Bills
V.15 The Treasury Bills, which were issued for enhanced amounts in the fiscal year 2008-09, were partly or fully rolled over in the first three quarters of 2009-10. For the fourth quarter it has been decided to roll over the entire notified amount of maturing Treasury Bills. The primary market yields that remained low during the first half, reflecting the impact of soft policy rate and ample liquidity in the money market, however, have increased subsequently reflecting the continued large supply of government securities and market conditions (Table 5.7).
Table 5.6: Commercial Paper-Major Issuers |
(Rupees crore) |
Category of Issuer |
End of |
Jun-08 |
Sep-08 |
Dec-08 |
Mar-09 |
Jun-09 |
Sep-09 |
Nov-09 |
1 |
2 |
3 |
4 |
5 |
6 |
7 |
8 |
Leasing and Finance |
34,957 |
39,053 |
27,965 |
27,183 |
34,437 |
31,648 |
39,514 |
|
(76.6) |
(75.0) |
(73.5) |
(61.5) |
(50.1) |
(40.0) |
(38.0) |
Manufacturing |
8,150 |
9,925 |
6,833 |
12,738 |
23,454 |
31,509 |
46,455 |
|
(17.4) |
(19.1) |
(18.0) |
(28.9) |
(34.1) |
(40.0) |
(44.7) |
Financial Institutions |
3,740 |
3,060 |
3,257 |
4,250 |
10,830 |
16,071 |
17,946 |
|
(8.0) |
(5.9) |
(8.5) |
(9.6) |
(15.8) |
(20.0) |
(17.3) |
Total |
46,847 |
52,038 |
38,055 |
44,171 |
68,721 |
79,228 |
1,03,915 |
Note : Figures in parentheses are percentage share in total. |
Government Securities Market
V.16 During 2009-10 (up to January 22, 2010), the Central Government completed a large part (95.5 percent) of the budgeted borrowing programme through issuance of dated securities (including amount raised through de-sequestering of MSS balances). In view of the increase in government’s borrowing requirements and the expected pick-up in credit during the second half, the market borrowing programme was front loaded. The cut-off yields were lower during 2009-10 (April 2009-January 22, 2010), reflecting ample market liquidity (Table 5.8). Intra-year,there has been a steady increase in the cutoff yields, reflecting the continued large supply of government securities. After a gap of five years, the Reserve Bank issued floating rate bonds in December 2009 for a notified amount of Rs. 2,000 crore.
Table 5.7: Treasury Bills in the Primary Market |
Year/ Month |
Notified Amount (Rupees crore) |
Average Implicit Yield at Minimum
Cut-off Price (Per cent) |
Average Bid-Cover Ratio |
91-day |
182-day |
364-day |
91-day |
182-day |
364-day |
1 |
2 |
3 |
4 |
5 |
6 |
7 |
8 |
2007-08 |
2,24,500 |
7.10 |
7.40 |
7.42 |
2.84 |
2.79 |
3.21 |
2008-09 |
2,99,000 |
7.10 |
7.22 |
7.15 |
3.43 |
2.91 |
3.47 |
Apr 2008 |
26,000 |
7.28 |
7.41 |
7.53 |
2.64 |
3.17 |
2.36 |
May 2008 |
17,000 |
7.41 |
7.55 |
7.61 |
2.92 |
2.73 |
3.43 |
Jun 2008 |
11,500 |
8.01 |
8.42 |
7.93 |
2.45 |
2.76 |
2.80 |
Jul 2008 |
21,000 |
9.07 |
9.33 |
9.39 |
2.84 |
2.72 |
3.52 |
Aug 2008 |
18,500 |
9.15 |
9.31 |
9.24 |
2.99 |
2.86 |
4.24 |
Sept 2008 |
25,000 |
8.74 |
8.92 |
8.83 |
3.06 |
3.04 |
3.57 |
Oct 2008 |
35,000 |
8.13 |
8.36 |
7.92 |
1.95 |
2.42 |
4.00 |
Nov 2008 |
28,000 |
7.30 |
7.13 |
7.23 |
2.40 |
2.97 |
3.51 |
Dec 2008 |
18,000 |
5.49 |
5.35 |
5.47 |
7.01 |
4.67 |
5.59 |
Jan 2009 |
37,000 |
4.69 |
4.60 |
4.55 |
2.30 |
3.22 |
3.54 |
Feb 2009 |
32,000 |
4.78 |
4.71 |
4.62 |
2.81 |
1.86 |
2.62 |
Mar 2009 |
30,000 |
4.77 |
4.86 |
5.25 |
2.60 |
2.67 |
1.44 |
2009-10 |
|
|
|
|
|
|
|
Apr 2009 |
39,000 |
3.81 |
4.11 |
4.07 |
3.22 |
2.79 |
5.07 |
May 2009 |
29,000 |
3.26 |
3.54 |
3.58 |
3.18 |
2.25 |
3.14 |
Jun 2009 |
22,500 |
3.35 |
3.56 |
3.99 |
3.37 |
5.65 |
2.86 |
Jul 2009 |
40,000 |
3.23 |
3.45 |
3.76 |
3.92 |
2.86 |
3.90 |
Aug 2009 |
28,000 |
3.35 |
3.84 |
4.25 |
3.04 |
2.18 |
3.76 |
Sept 2009 |
32,000 |
3.35 |
3.94 |
4.47 |
3.67 |
4.17 |
4.05 |
Oct 2009 |
36,000 |
3.23 |
4.01 |
4.57 |
3.15 |
3.88 |
2.86 |
Nov 2009 |
30,000 |
3.28 |
3.78 |
4.49 |
3.50 |
3.59 |
3.36 |
Dec 2009 |
26,500 |
3.57 |
4.08 |
4.63 |
3.12 |
2.99 |
4.10 |
Jan 2010 * |
25,000 |
3.81 |
4.13 |
4.67 |
1.86 |
3.60 |
4.50 |
* : Up to January 22, 2010.
Note: Notified amounts are inclusive of issuances under the MSS. |
Table 5.8: Issuances of Central and State Government Dated Securities |
|
2007-08 |
2008-09 |
2008-09* |
2009-10# |
1 |
2 |
3 |
4 |
5 |
Central Government |
|
|
|
|
Gross amount raised (Rupees crore) |
1,56,000 |
2,73,000 |
1,90,000 |
4,03,000 |
Re-issuances |
34 |
52 |
36 |
95 |
New issues |
1 |
4 |
3 |
7 |
Bid-cover ratio (Range) |
1.6-4.8 |
1.7-4.5 |
1.2-3.9 |
1.4-4.3 |
Weighted average maturity (years) |
14.9 |
13.8 |
14.6 |
11.2 |
Weighted average yield (per cent) |
8.12 |
7.69 |
8.03 |
7.23 |
Devolvement on Primary Dealers (Rupees crore) |
957 |
10,773 |
4,764 |
7,220 |
State Governments |
|
|
|
|
Gross amount raised (Rupees crore) |
67,779 |
1,18,138 |
52,843 |
1,08,267 |
Cut-off yield |
7.84-8.90 |
5.80-9.90 |
5.80-9.90 |
7.04-8.49 |
Weighted average yield (per cent) |
8.25 |
7.87 |
7.74 |
8.04 |
#: Up to January 22, 2010. *: Up to January 22, 2009. |
V.17 The sanction (gross) from the Government of India for market borrowings for twenty seven State Governments received during 2009-10 (up to January 21, 2010) was placed at Rs. 1,28,116 crore. The Annual Policy Statement for 2009-10 had projected States’ net market borrowings at Rs.1,26,000 crore, subsequently raised to Rs. 1,40,000 crore. A large part of the borrowing programme has already been smoothly completed (refer Table 5.8).
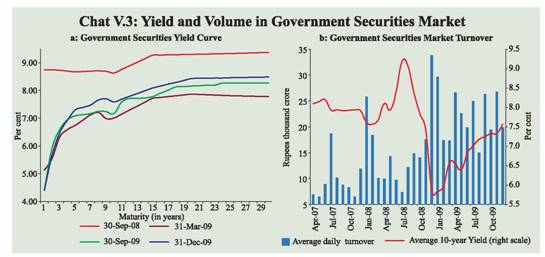
V.18 The yields moved in a broad range with a hardening bias on concerns of large fiscal deficit and inflationary pressures (Chart V.3a). The benchmark 10-year yield on government securities hardened during Q3 marked by increased turnover in the government securities market due to the large supply of government bonds (Chart V.3b). V.19 In tandem with the increase in the government bond yields, yield on 5-year AAA-rated corporate bonds, that had started hardening in Q2, continued the trend in Q3 of 2009-10. The risk spreads on corporate bonds, however, declined to the pre-crisis level.
Credit Market
V.20 In response to the prevailing ample market liquidity and the lower policy interest rate environment, the SCBs softened their deposit rates for various maturities by 25-275 basis points during March 2009-January 15, 2010 (Table 5.9). The impact of the lower cost of funds for banks was also transmitted to the interest rates on bank loans with benchmark prime lending rates (BPLRs) of SCBs declining by 25-100 basis points during the same period. The share of sub-BPLR lending for all SCBs (excluding export credit and small loans) increased from 66.9 per cent in March 2009 to 70.4 per cent in September 2009.
V.21 Despite the overall favourable interest rate environment, the growth in banks’ credit to commercial sector continued to decelerate in the first three quarters of 2009-10 due to a number of factors such as weak consumption and investment demand in the economy, substitution of funds by corporates in favour of non-banks funds and external borrowings and utilisation of internal resources of corporates. Nevertheless, there seems to be a turnaround in credit growth since November 2009.
Table 5.9: Deposit and Lending Rates |
(Per cent) |
|
March 2008 |
March 2009 |
June 2009 |
September 2009 |
December 2009 |
January 2010@ |
1 |
2 |
3 |
4 |
5 |
6 |
7 |
1. |
Domestic Deposit Rate |
|
|
|
|
|
|
|
Public Sector Banks |
|
|
|
|
|
|
|
Up to 1 year |
2.75-8.50 |
2.75-8.25 |
1.00-7.00 |
1.00-6.75 |
1.00-6.25 |
1.00-6.25 |
|
> 1 year-3 years |
8.25-9.25 |
8.00-9.25 |
6.50-8.00 |
6.50-7.50 |
6.00-7.25 |
6.00-7.25 |
|
> 3 years |
8.00-9.00 |
7.50-9.00 |
7.00-8.50 |
6.50-8.00 |
6.25-7.75 |
6.25-7.75 |
|
Private Sector Banks |
|
|
|
|
|
|
|
Up to 1 year |
2.50-9.25 |
3.00-8.75 |
2.00-7.50 |
2.00-7.00 |
2.00-6.75 |
2.00-6.50 |
|
> 1 year-3 years |
7.25-9.25 |
7.50-10.25 |
6.00-8.75 |
5.25-8.00 |
5.25-7.50 |
5.25-7.50 |
|
> 3 years |
7.25-9.75 |
7.50-9.75 |
6.00-9.00 |
5.75-8.25 |
5.75-8.00 |
5.75-8.00 |
|
Foreign Banks |
|
|
|
|
|
|
|
Up to 1 year |
2.25-9.25 |
2.50-8.50 |
1.80-8.00 |
1.25-8.00 |
1.25-7.00 |
1.25-7.00 |
|
> 1 year-3 years |
3.50-9.75 |
2.50-9.50 |
2.25-8.50 |
2.25-8.50 |
2.25-7.75 |
2.25-7.75 |
|
> 3 years |
3.60-9.50 |
2.50-10.00 |
2.25-9.50 |
2.25-8.50 |
2.25-8.50 |
2.25-8.50 |
2. |
BPLR |
|
|
|
|
|
|
|
1. Public Sector Banks |
12.25-13.50 |
11.50-14.00 |
11.00-13.50 |
11.00-13.50 |
11.00-13.50 |
11.00-13.50 |
|
2. Private Sector Banks |
13.00-16.50 |
12.75-16.75 |
12.50-16.75 |
12.50-16.75 |
12.50-16.75 |
12.50-16.75 |
|
3. Foreign Banks |
10.00-15.50 |
10.00-17.00 |
10.50-16.00 |
10.50-16.00 |
10.50-16.00 |
10.50-16.00 |
3. |
Actual Lending Rate* |
|
|
|
|
|
|
|
1. Public Sector Banks |
4.00-17.75 |
3.50-18.00 |
3.50-17.50 |
4.25-18.00 |
- |
- |
|
2. Private Sector Banks |
4.00-24.00 |
4.75-26.00 |
4.10-26.00 |
3.00-29.50 |
- |
- |
|
3. Foreign Banks |
5.00-28.00 |
5.00-25.50 |
2.76-25.50 |
3.73-21.99 |
- |
- |
* : Interest rate on non-export demand and term loans above Rs.2 lakh, excluding lending rates at the extreme five per cent on both sides. @ : As on January 15, 2010.
– : Not Available. |
Foreign Exchange Market
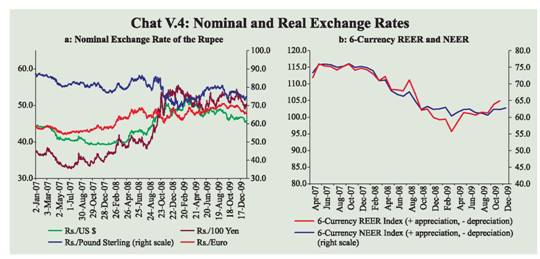
V.22 During 2009-10 so far (up to January 21, 2010), the rupee generally strengthened against the US dollar on the back of continued capital inflows, revival in growth performance of the Indian economy and general weakening of the US dollar in the international markets (Chart V.4-a).
V.23 The average 6-currency trade-based REER (base: 1993-94=100) appreciated by 9.7 per cent during April-November 2009, mainly on account of appreciation of the rupee against the US dollar and increase in inflation differential between India and its trading partners (Chart V.4-b). In terms of the broader measure, the 36-currency trade-based REER appreciated by 5.6 per cent during the period (Table 5.10). The 6-currency REER stood at 109.3 on January 21, 2010.
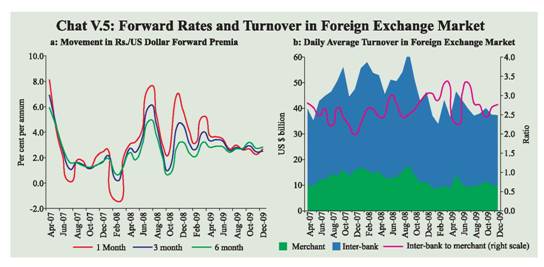
V.24 Reflecting the easing supply conditions in the market led by strong capital flows, forward premia generally exhibited declining trend during April-January 2009-10 (up to January 15) with intermittent hardening during August, October and December 2009, reflecting underlying demand conditions (Chart V.5a). Daily average forex market turnover generally registered a decline during the period June-December 2009 (Chart V.5b).
Table 5.10: Nominal and Real EffectiveExchange Rate of the Indian Rupee
(Trade based Weights, Base :
1993-94 = 100) |
Year/Month |
6-Currency Weights |
36-Currency Weights |
|
NEER |
REER |
NEER |
REER |
1 |
2 |
3 |
4 |
5 |
2007-08 |
74.76 |
114.23 |
93.91 |
104.81 |
2008-09 (P) |
64.87 |
104.47 |
84.67 |
94.32 |
Dec 2008(P) |
62.35 |
99.93 |
82.47 |
90.01 |
Jan 2009(P) |
62.49 |
99.23 |
82.27 |
89.80 |
Feb 2009(P) |
62.97 |
99.43 |
83.84 |
90.59 |
Mar 2009(P) |
60.35 |
95.68 |
80.75 |
88.05 |
Apr 2009(P) |
61.49 |
98.58 |
83.61 |
87.67 |
May 2009(P) |
62.31 |
101.37 |
84.43 |
89.75 |
June 2009(P) |
62.43 |
101.11 |
84.77 |
90.26 |
July 2009(P) |
61.36 |
100.64 |
83.39 |
89.76 |
Aug 2009(P) |
61.22 |
101.52 |
83.08 |
90.27 |
Sept 2009(P) |
60.61 |
101.25 |
82.12 |
90.06 |
Oct 2009(P) |
62.40 |
103.84 |
84.29 |
92.00 |
Nov 2009(P) |
62.30 |
104.94 |
84.25 |
92.98 |
Per cent Change |
|
2007-08 |
2008-09 (P) |
2008-09 (Apr-Nov) |
2009-10 (Apr-Nov) |
36-REER |
6.4 |
-10.0 |
-9.6 |
5.6 |
36-NEER |
9.3 |
-9.8 |
-7.4 |
4.3 |
6-REER |
8.2 |
-8.5 |
-7.7 |
9.7 |
6-NEER |
7.6 |
-13.2 |
-10.8 |
3.2 |
Rs/USD |
12.5 |
-12.4 |
-18.3 * |
10.8 * |
NEER : Nominal Effective Exchange Rate.
REER : Real Effective Exchange Rate.
P : Provisional. *: Up to January 21.
Note: 1. Data from 2008-09 onwards are provisional.
2. Rise in indices indicates appreciation of the rupee and vice versa |
Equity Market
V.25 During the financial year so far, the Indian equity market outperformed most EMEs by registering an increase of 80 per cent and relatively lower volatility (Table 5.11).
Primary Market
V.26 The activity in the primary market segment of the domestic capital market, after remaining subdued in Q1, displayed signs of revival in Q2 and Q3 of 2009-10. Cumulatively, resources raised through public issues increased considerably during April-December 2009 (Table 5.12). Mobilisation of resources through private placement increased by 69.0 per cent to Rs.1,67,244 crore during April-September 2009.
V.27 During April-December 2009, net resource mobilisation by mutual funds also increased substantially with liquidity conditions remaining comfortable and stock markets witnessing considerable gains (Table 5.13).
Table 5.11: Stock Market Indicators |
Indicator |
BSE |
NSE |
2007-08 |
2008-09 |
April-December |
2007-08 |
2008-09 |
April-December |
2008-09 |
2009-10 |
2008-09 |
2009-10 |
1 |
2 |
3 |
4 |
5 |
6 |
7 |
8 |
9 |
1. |
BSE Sensex / S&P CNX Nifty |
|
|
|
|
|
|
|
|
|
(i) End-period |
15644 |
9709 |
9647 |
17465 |
4735 |
3021 |
2959 |
5201 |
|
(ii) Average |
16569 |
12366 |
13388 |
15151 |
4897 |
3731 |
4021 |
4527 |
2. |
Coefficient of Variation |
13.7 |
24.2 |
20.4 |
12.6 |
14.5 |
23.2 |
19.8 |
11.9 |
3. |
Price-Earning Ratio (end-period) |
20.1 |
13.7 |
12.4 |
22.4 |
20.6 |
14.3 |
13.0 |
23.2 |
4. |
Price-Book Value Ratio (end-period) |
5.2 |
2.7 |
2.6 |
4.2 |
5.1 |
2.5 |
2.4 |
3.7 |
5. |
Yield (per cent per annum) (end-period) |
1.1 |
1.8 |
1.8 |
1.1 |
1.1 |
1.9 |
1.9 |
1.0 |
6. |
Listed Companies |
4,887 |
4,929 |
4,921 |
4,955 |
1,381 |
1,432 |
1,428 |
1,453 |
7. |
Cash Segment Turnover (Rupees crore) |
15,78,856 |
11,00,074 |
9,05,445 |
10,79,436 |
35,51,038 |
27,52,023 |
22,08,183 |
32,68,192 |
8. |
Derivative Segment Turnover (Rupees crore) |
2,42,308 |
12,268 |
12,245 |
14 |
1,30,90,478 |
1,10,10,482 |
84,80,063 |
1,30,35,344 |
9. |
Market Capitalisation (Rupees crore) @ |
51,38,015 |
30,86,076 |
31,44,768 |
60,79,892 |
48,58,122 |
28,96,194 |
29,16,768 |
56,99,637 |
10. |
Market Capitalisation to GDP Ratio (per cent) |
108.8 |
58.0 |
59.1 |
103.8 |
102.9 |
54.4 |
54.8 |
97.3 |
@: As at end-period.
Source : Bombay Stock Exchange Ltd. and National Stock Exchange Ltd. |
Table 5.12: Mobilisation of Resources from the Primary Market |
(Amount in Rupees crore) |
Item |
No. of Issues |
Amount |
No. of Issues |
Amount |
2008-09 (April-December) |
2009-10 (April-December) |
1 |
2 |
3 |
4 |
5 |
A. |
Prospectus and Rights Issues* |
|
|
|
|
|
1. |
Private Sector (a+b) |
40 |
14,007 |
37 |
13,301 |
|
|
a) |
Financial |
1 |
448 |
2 |
313 |
|
|
b) |
Non-financial |
39 |
13,559 |
35 |
12,988 |
|
2. |
Public Sector (a+b+c) |
- |
- |
2 |
6,803 |
|
|
a) |
Public Sector Undertakings |
- |
- |
- |
- |
|
|
b) |
Government Companies |
- |
- |
2 |
6,803 |
|
|
c) |
Banks/Financial Institutions |
- |
- |
- |
- |
|
3. |
Total (1+2) |
40 |
14,007 |
39 |
20,104 |
|
|
of which: |
|
|
|
|
|
|
(i) |
Equity |
40 |
14,007 |
38 |
19,924 |
|
|
(ii) |
Debt |
- |
- |
1 |
180 |
Memo: |
|
|
|
|
B. |
Euro Issues |
12 |
4,686 |
13 |
15,164 |
* : Excluding offers for sale. – : Nil/Negligible. |
Secondary Market
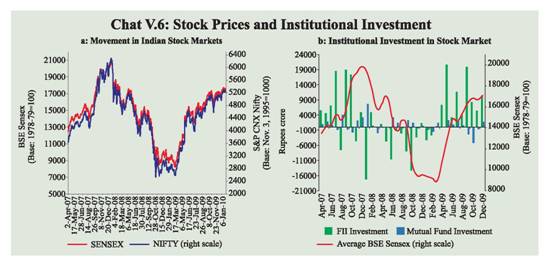
V.28 Market sentiments continued to remain positive during Q3 of 2009-10. After declining for a major part of December 2009, the markets moved up during the last week of December following optimism regarding growth and the Government’s disinvestment plans. As at end-December 2009, the BSE Sensex and the S&P CNX Nifty both registered gains of about 2 per cent over end-September 2009 and 79.9 per cent over end-March 2009(Chart V.6a).
Table 5.13: Resource Mobilisation by Mutual Funds |
(Rupees crore) |
Category |
April-March |
April-December |
2008-09 |
2008-09 |
2009-10 |
Net Mobilisation
@ |
Net Assets # |
Net Mobilisation
@ |
Net Assets
# |
Net Mobilisation
@ |
Net Assets # |
1 |
2 |
3 |
4 |
5 |
6 |
7 |
Private Sector |
-34,017 |
3,35,528 |
-39,942 |
3,30,731 |
1,08,170 |
5,24,391 |
Public Sector * |
5,721 |
81,772 |
9,510 |
82,634 |
33,469 |
1,40,755 |
Total |
-28,296 |
4,17,300 |
-30,432 |
4,13,365 |
1,41,639 |
6,65,146 |
@: Net of redemptions. #: End-period. *: Including UTI Mutual fund.
Note : Data exclude funds mobilised under Fund of Funds Schemes.
Source : Securities and Exchange Board of India. |
V.29 FIIs made net purchases in the stock markets in Q3 of 2009-10, while mutual funds were net sellers. FIIs made net purchases of US$ 19.0 billion in the Indian equity market during April-December 2009, as against net sales of US$ 9.1 billion in the comparable period of the previous year, as per the data released by the Securities and Exchange Board of India (SEBI) (Chart V.6b). In contrast, mutual funds’ net sales in stock markets during April-December 2009 amounted to Rs.4,421 crore as against net purchases of Rs.7,867 crore in the same period of previous year.
V.30 Overall, the domestic financial markets continued to remain stable and orderly in Q3 of 2009-10 with comfortable market liquidity and call rates staying close to the floor of the LAF corridor. Although the mobilisation of funds through CPs picked up significantly, the rates remained stable. The medium to long-term interest rates on government bonds, however, rose, reflecting large fiscal deficit and emerging inflationary pressures. The yield on benchmark 5-year corporate bonds also witnessed some upward movement with pick up in investment demand. The stock prices further consolidated the gains and primary market activity picked up, buoyed by private placements and mobilisation by the mutual funds. The rupee appreciated against major currencies reflecting revival of capital inflows. |