International Financial Markets During 2007-08, international financial markets remained volatile as uncertainties about the US sub-prime mortgage market and other credit markets exposures persisted. To ease liquidity conditions, major central banks continued to inject liquidity in a more collaborative manner. Elevated inflationary pressures in many economies reflected historical peaks in crude oil prices. Share prices in advanced economies fell, while those in emerging market economies (EMEs) recorded gains though with intermittent corrections due to country-specific factors. Long-term government bond yields in advanced economies softened, reflecting flight to safety by investors and easing of monetary policy in the US. In the currency markets, the US dollar depreciated against major currencies.
Financial markets in the recent period have witnessed heightened uncertainty, triggered by a sharp repricing of risk following problems in the US sub-prime mortgage market. Recent financial market developments have unfolded against the backdrop of an expanded period of strong broad-based global growth and overall financial stability. The congruence of favourable macroeconomic conditions, abundant liquidity and low nominal rates generated low perception of financial risks. Investor appetite for high returns in a low interest rate environment encouraged market participants to undertake progressively higher risks, stimulated further technological development for unbundling and distributing risks through financial markets and boosted demand for a range of high yielding and complex financial products. Greater appetite for structured instruments was evident in the rapid rise in the issuance of collateralised debt obligations (CDOs).
Delinquency rates on sub-prime mortgages (residential loans extended to individuals with poor credit histories) had started rising markedly after mid-2005. However, the trigger for deterioration in the credit market was provided by the news that two hedge funds, which were active in the structured markets for credit instruments that had sub-prime exposure, had suffered heavy losses and almost lost their capital. The market value of credit products based on sub-prime mortgages also declined1. These losses were aggravated by a sharp fall in financial market liquidity as investors became reluctant to invest in such products. These events resulted in a tightening in underwriting standards, with fewer households qualifying for sub-prime loans. Losses on mortgage exposures worsened following adverse developments in the US housing market. There was further downgrading of asset backed securities (ABS) with underlying assets as US sub-prime residential mortgages. Many issuers of asset-backed commercial paper (ABCP) programs found it extremely difficult to roll over maturing asset backed paper into new longer-term paper. The uncertainty over financial system exposures spread to banks and hedge funds outside the US as they indicated their exposures to this market. The rating agencies also announced that they would be downgrading ABSs with underlying pools of sub-prime mortgages.
In the credit market, the US five-year CDX high-yield index rose by 270 basis points to around 525 between end-May and late July 2007, while the corresponding US investment grade index widened by about 45 basis points to a high of 81 in early August 2007. In Europe, the five-year iTraxx Crossover CDS index climbed by 280 basis points to 471 in late July, 2007, while the headline iTraxx Europe investment grade index increased by 48 basis points to a high of 68. These increases in credit spreads coincided with a significant reduction in investor risk tolerance.
In the wake of these events, activity in ABCP dwindled, while concerns about banks being forced to take ABCP exposures on to their balance sheets generated apprehensions about an impending credit crunch. Inability of commercial paper issuing vehicles to finance at longer maturities induced them to seek liquidity needs from their sponsor banks, which in turn, prompted banks to hoard liquidity. The uncertainty about the quality of counterparty assets also aggravated the situation. The disturbances, thus, spilled over into short-term money markets, causing steep increases in overnight interest rates in major economies in August 2007. The UK witnessed some of the sharpest increases in the inter-bank rates as liquidity problems at the mortgage lender Northern Rock became more pronounced eventually triggering a bank run. The government bond yields in industrialised countries declined sharply with the yield on the 10-year paper in the US dropping by around 65 basis points, and those in the euro area and Japan by around 40 basis points each by late August 2007 over first half of June 2007 as markets sold off and investors retreated from risky assets.
In August 2007, central banks in the US and other affected economies, therefore, injected liquidity to stabilise inter-bank markets. Open market operations of increased size and maturity were undertaken by the Bank of England, European Central Bank (ECB) and the US Federal Reserve System. The types of securities against which banks could borrow were broadened by the US Fed and ECB to include mortgage backed securities. The US Fed also decided to accept ABCP as collateral. On August 17, 2007, the US Federal Open Market Committee (FOMC) lowered its discount rate by 50 basis points to 5.75 per cent, bringing in some calmness in markets. The Bank of England provided emergency liquidity assistance to Northern Rock bank. The US FOMC, at its meeting held on September 18, 2007, decided to cut the fed funds target rate by 50 basis points from 5.25 per cent to 4.75 per cent and correspondingly the federal discount rate from 5.75 per cent to 5.25 per cent. While the primary concern of the FOMC till August 2007 was the existence of inflationary pressures, the risks to economic growth were indicated an added concern in its September 18, 2007 statement. As a consequence of successive central bank liquidity injections into the inter-bank money markets and lower policy rates in the US, the credit markets recovered briefly in early October 2007. Renewed concerns about the uncertainty in the US housing market and direct and indirect exposures to associated economic and financial risks from mid-October 2007 led to widening of credit spreads. Mirroring the developments in the US, the credit spreads widened in the Euro area. Market conditions weakened for structured instruments, reflecting the deteriorating asset quality and uncertainties about valuation of structured credit products. This also reflected worsening of sentiment in the money market beginning mid-October 2007 as liquidity conditions became adverse leading to rise in inter-bank rates. The swap spreads between three-month inter-bank interest rates and overnight index swaps rose sharply reflecting greater preference for liquidity and rising counterparty risk premia. Market participants evinced keen interest in government paper. Bond yields also fell in anticipation of weakening of economic activity and expectations of further monetary policy easing in the United States.
In order to improve liquidity, the US Federal Reserve Board reduced its fed funds target rate by 25 basis points each on October 31, 2007 and December 11, 2007. The Bank of England and the Bank of Canada also reduced their policy rates. In the situation of heightened tensions and serious impairment of functioning of the money markets, five central banks, viz., the Bank of Canada, the Bank of England, the European Central Bank, the US Federal Reserve System and the Swiss National Bank announced measures on December 12, 2007 in a collaborative manner to address elevated pressures. Actions taken by the US Federal Reserve included the establishment of a temporary Term Auction Facility (TAF) and the establishment of foreign exchange swap lines with the European Central Bank and the Swiss National Bank. The TAF allowed a potentially much larger pool of banks to bid for funds direct from the US Fed. The goal of the TAF was to reduce the incentive for banks to hold cash and increase their willingness to provide credits to households and firms. The ECB announced that the Eurosystem would conduct two US dollar liquidity-providing operations, in connection with the US dollar TAF, against ECB-eligible collateral for a maturity of 28 and 35 days. The Bank of England expanded the amount of reserves offered at three months maturity in its long-term repo open market operations scheduled on December 18, 2007 and January 15, 2008. It also widened the range of collateral accepted for funds advanced at this maturity. The Bank of Canada announced that it would enter into term purchase and resale agreements extending over the calendar year-end.
In the UK, the Government had to extend guarantees to depositors of Northern Rock bank to avoid contagion in the banking system. The Northern Rock bank was also provided a large loan by the Bank of England. Under a fresh rescue plan under current consideration of the authority, the money lent to Northern Rock bank could be converted into government bonds, a move that would allow a private buyer to reduce the burden of heavy loan repayment immediately. The downside risks to economic growth in the US are becoming increasingly more pronounced in the wake of likely softening in consumer spending due to higher energy prices, lower equity prices and housing downturn. Business investments in equipment and software as well as non-residential construction are also expected to slow down. In view of these concerns, equity markets in several countries in Asia declined sharply on January 21, 2008. In the wake of further worsening of the baseline outlook for real activity in 2008 and increasing downside risks to growth, the US Fed reduced the fed funds target rate sharply by 75 basis points to 3.50 per cent on January 22, 2008, taking the total reduction to 175 basis points beginning September 18, 2007. The Bank of Canada also lowered its benchmark overnight rate by 25 basis points to 4.0 per cent on January 22, 2008.
Recent financial market developments raise several issues and concerns. First, while the practices of increased use of innovative credit instruments and complex layering of risk diffusion have reduced information costs, they have also enabled the investor or risk taker to become progressively remote from the ultimate borrowers where the actual risks reside. With a host of intermediaries in the form of mortgage brokers, mortgage companies and societies, packaging their mortgage assets including non-conforming loans and selling down to different categories of investors, including Special Investment Vehicles (SIVs), and hedge funds, the identification and location of risks in the whole chain is becoming increasingly challenging.
Second, the role of rating agencies has also come under scrutiny. The issues such as small number of rating agencies and the possible conflict of interest clearly suggest that the reliance only on rating agencies for risk assessment needs to be avoided.
Third, the confidence is also falling in the strength of the insurers that guarantee payments on bonds (monoline industry). Two major bond insurers are reportedly have huge exposures in securities backed by assets, including sub-prime mortgages. Some of the bond insurers in fact, have already been downgraded by the rating agencies because of the losses on the sub-prime mortgage bonds they had insured. The cost of buying protection against defaults by US companies has also risen.
Fourth, as far as role of central banks is concerned, on one hand, there is a view that increased credibility of monetary policy has enhanced expectations for stability in both inflation and interest rates, which has led to the mispricing of risk and hence enhanced risk taking. On the other hand, another view is the repeated assurances of stability and guidance to markets about the future path of interest rates by the central banks, coupled with the availability of ample liquidity have led markets to underprice risks. Recent developments have highlighted the need for central banks to improve the understanding of the continuously evolving financial system. There is also a need to reassess the issue of separation of monetary policy and bank supervision with the growing impact of endogenous liquidity as such separation would inhibit rather than facilitate the conduct of monetary policy. Furthermore, there is a need to strengthen, directly or indirectly, scrutiny of financial activities that have migrated outside their formal jurisdiction. There is also a need for the central banks to operate monetary policy with varied instruments both rate and quantum at their disposal. The recent financial market developments have also highlighted the vulnerabilities created by off-balance sheet exposures, and issues relating to liquidity risk management by banks.
The spreads of even the investment grade corporate bonds in the international markets have widened significantly in the recent period. This would have implications for the corporate sector in India as they, in the recent period, have increased their reliance on external commercial borrowing (ECB).
The money and credit markets in India have so far remained relatively insulated from the international financial market developments. India's exposure to troubled sub-prime assets and related derivatives is negligible in comparison with many other economies. Notwithstanding some reports of accelerated emergence of non-performing assets with regard to consumer credit, housing and real estate in a few banks, preliminary assessment showed that they do not have systemic implications either in terms of solvency or liquidity. This has reflected the nuanced and gradual approach in India's financial sector reform process with building up of appropriate safeguards to ensure stability, while taking account of the prevailing governance standards, risk management systems and incentive frameworks in financial institutions in the country. Although the equity market in India has been impacted by global uncertainties and the trends in equity markets in advanced and other EMEs, the overall conditions in financial markets have, by and large, remained orderly. The Reserve Bank continues to maintain enhanced vigilance so as to respond appropriately to the prevailing uncertainties in global financial conditions. The policy challenge is to continue to ensure financial stability in India during the period of heightened uncertainties, while maintaining the momentum of high growth and ensuring price stability.
Developments during the Third Quarter of 2007-08
Short-term interest rates in the US declined during the third quarter of 2007-08 reflecting the monetary easing. Short-term interest rates in the EMEs witnessed a mixed trend, firming up in Argentina, China, South Korea and Thailand, while softening in Hong Kong and Philippines (Table 35). Bangko Sentral
Table 35 : Short-term Interest Rates |
(Per cent) |
Region/Country |
End of |
|
March
2006 |
March
2007 |
June
2007 |
September
2007 |
December
2007 |
January
2008* |
1 |
2 |
3 |
4 |
5 |
6 |
7 |
Advanced Economies |
Euro Area |
2.80 |
3.91 |
4.16 |
4.73 |
4.88 |
4.51 |
Japan |
0.04 |
0.57 |
0.63 |
0.73 |
0.73 |
0.74 |
Sweden |
1.99 |
3.21 |
3.42 |
3.54 |
4.02 |
4.02 |
UK |
4.58 |
5.55 |
5.92 |
6.28 |
6.41 |
5.58 |
US |
4.77 |
5.23 |
5.27 |
4.72 |
4.16 |
3.74 |
Emerging Market Economies |
Argentina |
9.63 |
9.63 |
9.25 |
12.31 |
14.50 |
12.94 |
Brazil |
16.54 |
12.68 |
11.93 |
11.18 |
11.18 |
11.18 |
China |
2.40 |
2.86 |
3.08 |
3.86 |
4.35 |
4.48 |
Hong Kong |
4.47 |
4.17 |
4.43 |
4.97 |
3.73 |
3.12 |
India |
6.11 |
7.98 |
7.39 |
7.19 |
7.35 |
7.10 |
Malaysia |
3.51 |
3.64 |
3.62 |
3.62 |
3.62 |
3.62 |
Philippines |
7.38 |
5.31 |
6.19 |
6.94 |
6.56 |
6.25 |
Singapore |
3.44 |
3.00 |
2.55 |
2.56 |
2.56 |
1.75 |
South Korea |
4.26 |
4.94 |
5.03 |
5.34 |
5.71 |
5.86 |
Thailand |
5.10 |
4.45 |
3.75 |
3.55 |
3.90 |
3.55 |
*: As on January 16, 2008.
Note : Data for India refer to 91-day Treasury Bills rate and for other countries 3-month money market rates.
Source : The Economist. |
ng Pilipinas (Philippines) lowered its key policy rates on December 20, 2007. The Bangko Sentral ng Pilipinas had earlier also reduced its key policy rates on October 4, 2007 and November 15, 2007. Central banks in China, Taiwan, South Africa and Norway, however, increased their policy rates during the quarter to contain inflation and stabilise inflationary expectations.
Long-term Government bond yields softened in major advanced economies during the third quarter of 2007-08, reflecting lower investor appetite for riskier assets in the wake of deteriorating housing market, turmoil in the credit market and monetary policy easing in the US (Chart 26). Between end-September 2007 and end-December 2007, 10-year yield declined by 49 basis points in the US, 33 basis points in the UK, 14 basis points in Japan and 6 basis points in the Euro area. Between end-March 2007 and end-December 2007, 10-year yield declined by 50 basis points in the US, 18 basis points in the UK and 16 basis points in Japan, while it increased by 29 basis points in the Euro area. Equity markets in the EMEs recorded further gains during the third quarter of 2007-08 amidst intermittent corrections due mainly to strong portfolio flows, buoyant merger and acquisition activity, continued higher GDP growth and healthy corporate earnings. Equity markets in the advanced economies, however, declined somewhat on account of sub-prime losses, credit squeeze, slump in the US home sales, concerns over slowdown in the US economy, depreciation of the US dollar against major currencies, dismal performance of 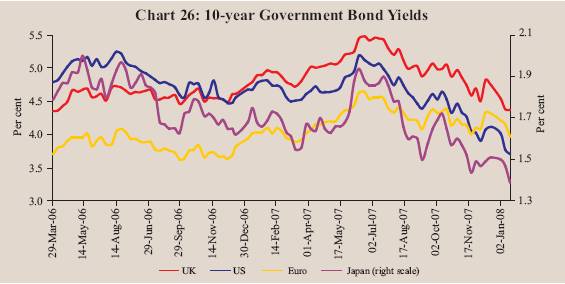
the financial sector and increase in international crude oil prices. Between end-March 2007 and January 16, 2008, the MSCI emerging market index increased by 25.6 per cent, while the MSCI world (developed) market index declined by 2.7 per cent. The gains in EMEs were led by stock markets in China (66.5 per cent), India (54.2 per cent), Egypt (51.0 per cent), Indonesia (44.0 per cent), Brazil (32.1 per cent) and Hong Kong (25.0 per cent) (Chart 27).
In the foreign exchange market, the US dollar depreciated against major currencies during 2007-08 (up to January 17, 2008) (Table 36). The sub-prime crisis, declining capital inflows to the US, fed rate cuts, weaker US housing 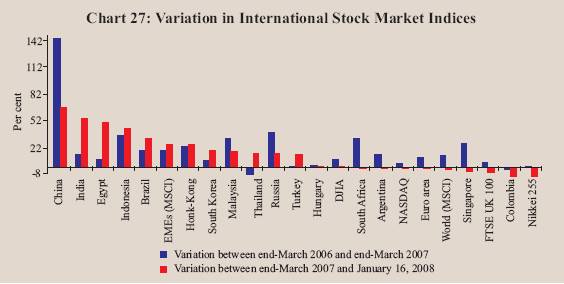
Table 36: Appreciation (+)/Depreciation (-) of the US dollar vis-à-vis other Currencies
|
(Per cent) |
Currency |
End-March 2006 @ |
End-March 07 @ |
January 17, 2008 * |
1 |
2 |
3 |
4 |
Euro |
7.1 |
-9.1 |
-9.3 |
Pound Sterling |
8.5 |
-11.4 |
-0.2 |
Japanese Yen |
9.4 |
0.2 |
-9.0 |
Chinese Yuan |
-3.1 |
-3.4 |
-6.2 |
Russian Rubble |
-0.6 |
-6.1 |
-5.8 |
Turkish Lira |
-2.0 |
3.2 |
-15.2 |
Indian Rupee |
2.2 |
-2.5 |
-9.9 |
Indonesian Rupiah |
-4.3 |
0.5 |
3.6 |
Malaysian Ringgit |
-3.0 |
-6.2 |
-5.1 |
South Korean Won |
-4.7 |
-3.7 |
-0.2 |
Thai Baht |
-0.7 |
-9.9 |
-5.4 |
Argentine Peso |
5.4 |
0.7 |
1.5 |
Brazilian Peso |
-18.1 |
-6.4 |
-14.2 |
Mexican Peso |
-2.6 |
1.3 |
-0.8 |
South African Rand |
-0.5 |
17.2 |
-3.6 |
@: Year-on-year variation. *: Variation over end-March 2007. |
data and lower consumer confidence led the US dollar to depreciate against other major currencies, touching a historic low against the euro during October 2007. The US dollar also weakened against the Canadian dollar and the Australian dollar mainly due to surge in crude oil prices. The US dollar's weakness against the Chinese yuan reflected widening of floating band from 0.3 per cent to 0.5 per cent by the Chinese authority in May 2007. The US dollar's weakness against the Thai baht reflected the Thai currency's appreciation largely due to the growing current account surpluses.
Domestic Financial Markets
Indian financial markets remained generally orderly for the most part of the third quarter of 2007-08 except for some volatility in overnight interest rates and in the equity market. Swings in cash balances of the Government and capital flows were the main drivers of liquidity conditions in the financial markets and volatility in overnight interest rates. Interest rates in the overnight money markets mostly remained within the informal corridor set by reverse repo and repo rates during the third quarter of 2007-08. Interest rates in the collateralised segment of the overnight money market hardened but remained below the call rate during the quarter. In the foreign exchange market, the Indian rupee generally appreciated during the quarter. Yields in the Government securities market remained range-bound. The stock markets remained buoyant and the benchmark indices reached new highs (Table 37). The stock markets, however, witnessed some volatility beginning mid-January 2008 reflecting, inter alia, global uncertainties. The primary market segment of the capital market witnessed increased activity in the third quarter of 2007-08.
Table 37: Domestic Financial Markets at a Glance |
Year/ Month |
Call Money |
Government Securities |
Foreign Exchange |
Liquidity Management |
Equity |
|
Ave
rage
Daily Turn
over (Rs. crore) |
Ave
rage
Call Rates*
(Per
cent) |
Ave
rage
Turn
over
in
Govt. Securi
ties (Rs. crore)+ |
Ave
rage
10-
year Yield
@ (Per cent) |
Ave
rage
Daily
Inter-
bank
Turn
over
(US $ million) |
Ave
rage
Ex-
change Rate
(Rs. per US $) |
RBI's
net
Foreign Currency Sales (-)/ Purchases
(+) (US
$ million) |
Ave
rage
3-
month Forward Premia (Per cent) |
Ave
rage
MSS
Out- standing
# (Rs.
crore) |
Ave
rage
Daily LAF
Out- stan
ding (Rs. crore) |
Ave
rage
Daily BSE Turn
over (Rs. crore) |
Ave
rage
Daily NSE Turn
over
(Rs. crore) |
Ave
rage
BSE Sen
sex** |
Ave
rage
S & P CNX Nifty** |
1 |
2 |
3 |
4 |
5 |
6 |
7 |
8 |
9 |
10 |
11 |
12 |
13 |
14 |
15 |
2004-05 |
14,170 |
4.65 |
4,826 |
6.22 |
8,892 |
44.93 |
20,847 ## |
1.66 |
46,445 |
35,592 |
2,050 |
4,506 |
5741 |
1805 |
2005-06 |
17,979 |
5.60 |
3,643 |
7.12 |
12,738 |
44.27 |
8,143 ## |
1.60 |
58,792 |
10,986 |
3,248 |
6,253 |
8280 |
2513 |
2006-07 |
21,725 |
7.22 |
4,863 |
7.78 |
18,540 |
45.25 |
26,824 ## |
2.14 |
37,698 |
21,973 |
3,832 |
7,812 |
12277 |
3572 |
Mar 2006 |
18,290 |
6.58 |
2,203 |
7.40 |
17,600 |
44.48 |
8,149 |
3.11 |
29,652 |
-6,319 |
5,398 |
9,518 |
10857 |
3236 |
Apr 2006 |
16,909 |
5.62 |
3,685 |
7.45 |
17,712 |
44.95 |
4,305 |
1.31 |
25,709 |
46,088 |
4,860 |
9,854 |
11742 |
3494 |
May 2006 |
18,074 |
5.54 |
3,550 |
7.58 |
18,420 |
45.41 |
504 |
0.87 |
26,457 |
59,505 |
4,355 |
9,155 |
11599 |
3437 |
Jun 2006 |
17,425 |
5.73 |
2,258 |
7.86 |
15,310 |
46.06 |
0 |
0.73 |
31,845 |
48,610 |
3,131 |
6,567 |
9935 |
2915 |
Jul 2006 |
18,254 |
5.86 |
2,243 |
8.26 |
14,325 |
46.46 |
0 |
0.83 |
36,936 |
48,027 |
2,605 |
5,652 |
10557 |
3092 |
Aug 2006 |
21,294 |
6.06 |
5,786 |
8.09 |
15,934 |
46.54 |
0 |
1.22 |
40,305 |
36,326 |
2,867 |
5,945 |
11305 |
3306 |
Sep 2006 |
23,665 |
6.33 |
8,306 |
7.76 |
18,107 |
46.12 |
0 |
1.31 |
40,018 |
25,862 |
3,411 |
6,873 |
12036 |
3492 |
Oct 2006 |
26,429 |
6.75 |
4,313 |
7.65 |
16,924 |
45.47 |
0 |
1.67 |
41,537 |
12,983 |
3,481 |
6,919 |
12637 |
3649 |
Nov 2006 |
25,649 |
6.69 |
10,654 |
7.52 |
20,475 |
44.85 |
3,198 |
2.07 |
38,099 |
9,937 |
4,629 |
8,630 |
13416 |
3869 |
Dec 2006 |
24,168 |
8.63 |
5,362 |
7.55 |
19,932 |
44.64 |
1,818 |
3.20 |
38,148 |
-1,713 |
4,276 |
8,505 |
13628 |
3910 |
Jan 2007 |
22,360 |
8.18 |
4,822 |
7.71 |
21,171 |
44.33 |
2,830 |
4.22 |
39,553 |
-10,738 |
4,380 |
8,757 |
13983 |
4037 |
Feb 2007 |
23,254 |
7.16 |
4,386 |
7.90 |
20,298 |
44.16 |
11,862 |
3.71 |
40,827 |
648 |
4,676 |
9,483 |
14143 |
4084 |
Mar 2007 |
23,217 |
14.07 |
2,991 |
8.00 |
25,992 |
44.03 |
2,307 |
4.51 |
52,944 |
-11,858 |
3,716 |
7,998 |
12858 |
3731 |
Apr 2007 |
29,689 |
8.33 |
4,636 |
8.10 |
28,131 P |
42.15 |
2,055 |
6.91 |
71,468 |
-8,937 |
3,935 |
8,428 |
13478 |
3947 |
May 2007 |
20,476 |
6.96 |
4,442 |
8.15 |
24,843 P |
40.78 |
4,426 |
4.58 |
83,779 |
-6,397 |
4,706 |
9,885 |
14156 |
4184 |
Jun 2007 |
16,826 |
2.42 |
6,250 |
8.20 |
30,122 P |
40.77 |
3,192 |
2.59 |
83,049 |
1,689 |
4,537 |
9,221 |
14334 |
4222 |
Jul 2007 |
16,581 |
0.73 |
13,273 |
7.94 |
32,119 P |
40.41 |
11,428 |
1.12 |
82,996 |
2,230 |
5,684 |
12,147 |
15253 |
4474 |
Aug 2007 |
23,603 |
6.31 |
6,882 |
7.95 |
33,445 P |
40.82 |
1,815 |
1.59 |
1,00,454 |
21,729 |
4,820 |
10,511 |
14779 |
4301 |
Sep 2007 |
21,991 |
6.41 |
5,859 |
7.92 |
36,557 P |
40.34 |
11,867 |
1.45 |
1,17,674 |
16,558 |
6,157 |
13,302 |
16046 |
4660 |
Oct 2007 |
18,549 |
6.03 |
5,890 |
7.92 |
39,453 P |
39.51 |
12,544 |
1.12 |
1,58,907 |
36,665 |
9,049 |
20,709 |
18500 |
5457 |
Nov 2007 |
20,146 |
6.98 |
4,560 |
7.94 |
30,677 P |
39.44 |
7,827 |
1.40 |
1,75,952 |
-2,742 |
7,756 |
18,837 |
19260 |
5749 |
Dec 2007 |
16,249 |
7.50 |
7,704 |
7.91 |
_ |
39.44 |
_ |
1.64 |
1,64,606 |
-10,804 |
8,606 |
19,283 |
19827 |
5964 |
* : Average of daily weighted call money borrowing rates. + : Average of daily outright turnover in Central Government dated securities.
@ : Average of daily closing rates. # : Average of weekly outstanding MSS.
** : Average of daily closing indices. # # : Cumulative for the financial year.
LAF : Liquidity Adjustment Facility. MSS : Market Stabilisation Scheme.
BSE : Bombay Stock Exchange Limited. NSE : National Stock Exchange of India Limited.
P : Provisional - : Not available.
Note: In column 11, (-) indicates injection of liquidity, while (+) indicates absorption of liquidity. |
Money Market
Following the withdrawal of the ceiling of Rs.3,000 crore on daily reverse repo acceptance under the LAF and the discontinuation of the Second LAF with effect from August 6, 2007, the weighted average rate in the call money market moved into the informal corridor set by reverse repo and repo rates till the first week of November 2007 (Chart 28). In the wake of relative tightness in the money market from the second week of November 2007, however, the call/ notice money market rates edged up and moved around the upper bound of the informal corridor. This was mainly because of festive season demand for currency, increase in Government cash balances with the Reserve Bank and hike in the cash reserve ratio (CRR) by 50 basis points to 7.5 per cent with effect from the fortnight beginning November 10, 2007. The average call/notice money market 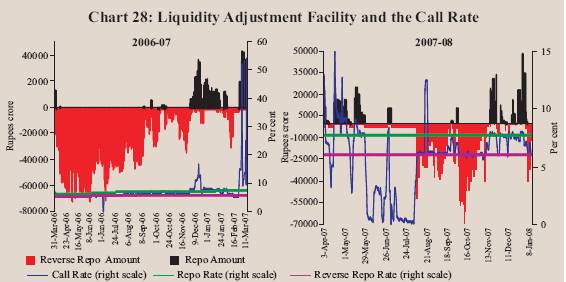
rate rose to 6.98 per cent in November 2007 from 6.03 per cent in October 2007. In December 2007, the call/notice rate moved around the repo rate and the average call/notice rate for December 2007 was at 7.50 per cent. Since the first week of January 2008 the call/notice money market rates softened hovering around the reverse repo rate as liquidity conditions eased. The average call/ notice rate was 6.22 per cent as on January 22, 2008. Interest rates in the collateralised segment of the money market _ market repo (outside the LAF) and collateralised borrowing and lending obligation (CBLO) _ increased in line with call rates, but remained below the call money rate during October-December 2007 (Chart 29). During October- 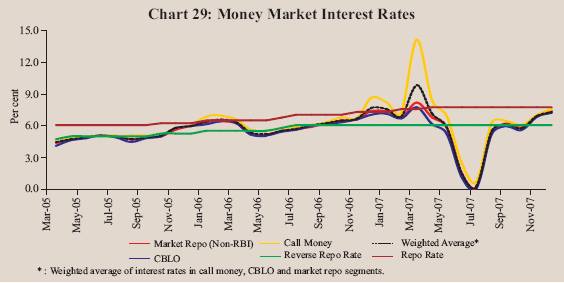
Table 38: Activity in Money Market Segments |
(Rupees crore) |
|
Average Daily Volume (One Leg) |
|
Commercial Paper |
Certificates of Deposit |
Year/ Month |
Call Money Market |
Repo Market
(Outside
the LAF) |
Collateralised
Borrowing and
Lending Obligation (CBLO) |
Total (2+3+4) |
Term Money Market |
Outstanding |
WADR (per cent) |
Outstanding |
WADR
(per cent) |
1 |
2 |
3 |
4 |
5 |
6 |
7 |
8 |
9 |
10 |
2004-05 |
7,085 |
4,284 |
3,349 |
14,718 |
263 |
11,723 |
5.34 |
6,052 |
- |
2005-06 |
8,990 |
5,296 |
10,020 |
24,306 |
417 |
17,285 |
6.46 |
27,298 |
- |
2006-07 |
10,863 |
8,419 |
16,195 |
35,477 |
506 |
21,372 |
8.08 |
65,021 |
8.23 |
Mar 2006 |
9,145 |
7,991 |
17,888 |
35,024 |
669 |
12,718 |
8.59 |
43,568 |
8.62 |
Apr 2006 |
8,455 |
5,479 |
16,329 |
30,263 |
447 |
16,550 |
7.30 |
44,059 |
7.03 |
May 2006 |
9,037 |
9,027 |
17,147 |
35,211 |
473 |
17,067 |
6.89 |
50,228 |
7.17 |
Jun 2006 |
8,713 |
10,563 |
13,809 |
33,085 |
628 |
19,650 |
7.10 |
56,390 |
7.19 |
Jul 2006 |
9,127 |
9,671 |
15,670 |
34,468 |
432 |
21,110 |
7.34 |
59,167 |
7.65 |
Aug 2006 |
10,647 |
7,764 |
15,589 |
34,000 |
510 |
23,299 |
7.31 |
65,621 |
7.77 |
Sep 2006 |
11,833 |
9,185 |
14,771 |
35,789 |
568 |
24,444 |
7.70 |
65,274 |
7.80 |
Oct 2006 |
13,214 |
9,721 |
16,964 |
39,899 |
466 |
23,171 |
7.77 |
65,764 |
7.73 |
Nov 2006 |
12,825 |
9,374 |
16,069 |
38,268 |
348 |
24,238 |
7.88 |
68,911 |
7.99 |
Dec 2006 |
12,084 |
7,170 |
15,512 |
34,766 |
481 |
23,536 |
8.52 |
68,619 |
8.28 |
Jan 2007 |
11,180 |
6,591 |
15,758 |
33,529 |
515 |
24,398 |
9.09 |
70,149 |
9.22 |
Feb 2007 |
11,627 |
7,794 |
19,063 |
38,484 |
467 |
21,167 |
10.49 |
72,795 |
9.87 |
Mar 2007 |
11,608 |
8,687 |
17,662 |
37,957 |
739 |
17,838 |
11.33 |
93,272 |
10.75 |
Apr 2007 |
14,845 |
7,173 |
18,086 |
40,104 |
440 |
18,759 |
10.52 |
95,980 |
10.75 |
May 2007 |
10,238 |
8,965 |
20,810 |
40,013 |
277 |
22,024 |
9.87 |
99,715 |
9.87 |
Jun 2007 |
8,413 |
10,295 |
20,742 |
39,450 |
308 |
26,256 |
8.93 |
98,337 |
9.37 |
Jul 2007 |
8,290 |
12,322 |
20,768 |
41,380 |
288 |
30,631 |
7.05 |
1,05,317 |
7.86 |
Aug 2007 |
11,802 |
16,688 |
26,890 |
55,380 |
319 |
31,527 |
8.30 |
1,09,224 |
8.67 |
Sep 2007 |
10,995 |
17,876 |
29,044 |
57,915 |
265 |
33,614 |
8.95 |
1,18,481 |
8.57 |
Oct 2007 |
9,275 |
15,300 |
29,579 |
54,154 |
221 |
42,183 |
7.65 |
1,24,232 |
7.91 |
Nov 2007 |
10,073 |
12,729 |
28,614 |
51,416 |
184 |
41,308 |
9.45 |
1,27,142 |
8.48 |
Dec 2007 |
8,124 |
13,354 |
30,087 |
51,565 |
509 |
41,425@ |
9.48 @ |
1,25,326 * |
8.60 * |
-: Not available.
*: As on December 7, 2007.
WADR: Weighted Average Discount Rate.
@: As on December 15, 2007. |
December 2007, interest rates averaged 6.84 per cent, 6.54 per cent and 6.73 per cent, respectively, in the call, CBLO and market repo segments (7.36 per cent, 6.64 per cent and 6.79 per cent, respectively, a year ago). The weighted average rate in all the three money market segments combined together was 6.64 per cent during October-December 2007 (6.92 per cent a year ago).
The collateralised market remained the predominant segment of the money market, accounting for about 83 per cent of the total volume during the third quarter of 2007-08 (Table 38). In both the CBLO and market repo segments, mutual funds have been the major lenders, while banks and primary dealers (PDs) have been the major borrowers.
Certificates of Deposit
The outstanding amount of certificates of deposit (CDs) increased to Rs. 1,25,326 crore (5.8 per cent of deposits of issuing banks) as on December 7, 2007 from Rs.93,272 crore at end-March 2007 (4.8 per cent of aggregate deposits) (see Table 38). Mutual funds were the major investors in CDs. As on December 7, 2007, the weighted average discount rate (WADR) declined to 8.60 per cent from 10.75 per cent as at end-March 2007 in tandem with the decline in other money market rates.
Table 39: Commercial Paper - Major Issuers |
(Rupees crore) |
Category of Issuer |
End of |
|
March 2006 |
March 2007 |
June 2007 |
September 2007 |
December 2007@ |
1 |
2 |
3 |
4 |
5 |
6 |
Leasing and Finance |
9,400 |
12,569 |
18,260 |
24,396 |
27,856 |
|
(73.9) |
(70.5) |
(69.5) |
(72.6) |
(67.2) |
Manufacturing |
1,982 |
2,754 |
3,956 |
5,538 |
9,804 |
|
(15.6) |
(15.4) |
(15.1) |
(16.5) |
(23.7) |
Financial Institutions |
1,336 |
2,515 |
4,040 |
3,680 |
3,765 |
|
(10.5) |
(14.1) |
(15.4) |
(10.9) |
(9.1) |
Total |
12,718 |
17,838 |
26,256 |
33,614 |
41,425 |
|
(100.0) |
(100.0) |
(100.00) |
(100.0) |
(100.0) |
@ : As on December 15, 2007.
Note: Figures in parentheses are percentage shares in the total outstanding. |
Commercial Paper
Issuances of commercial paper (CP) increased in the third quarter of 2007-08. Commercial paper outstanding rose to Rs.41,425 crore by December 15, 2007 from Rs. 17,838 crore at end-March 2007 (see Table 38). The weighted average discount rate (WADR) on CP declined to 9.48 per cent as on December 15, 2007 from 11.33 per cent at end-March 2007 following the easing of the liquidity conditions in the short-term money market. The most preferred maturity of CP was for period ranging from '6-month to 12-month'. Leasing and financing companies continued to be the major issuers of CP partly reflecting the policy decision to phase out the access of these companies to public deposits (Table 39).
Treasury Bills
The primary market yields on Treasury Bills (TBs) softened during the third quarter of 2007-08, especially in October 2007, reflecting easy liquidity conditions and cut in the fed funds target rate (Chart 30). Yields hardened again in November 2007 with hike in the CRR by 50 basis points with effect from November 10, 2007. The yield spread between 364-day and 91-day TBs declined to 28 basis points in December 2007 from 40 basis points in September 2007 (17 basis points in March 2007) (Table 40).
Foreign Exchange Market
During the third quarter of 2007-08, the Indian rupee generally appreciated vis-à-vis the US dollar. Between end-March 2007 and January 23, 
2008, the rupee moved in the range of Rs.39.26-43.15 per US dollar. The rupee's appreciation reflected, inter alia, large capital inflows, weakening of
Table 40: Treasury Bills in the Primary Market |
Month |
Notified |
Average Implicit Yield at |
Average Bid-Cover Ratio |
|
Amount
(Rupees crore) |
Minimum Cut-off Price
(Per cent) |
|
|
|
91-day |
182-day |
364-day |
91-day |
182-day |
364-day |
1 |
2 |
3 |
4 |
5 |
6 |
7 |
8 |
2004-05 |
1,38,500 @ |
4.91 |
- |
5.16 |
2.43 |
- |
2.52 |
2005-06 |
1,55,500 @ |
5.68 |
5.82 |
5.96 |
2.64 |
2.65 |
2.45 |
2006-07 |
1,86,500 @ |
6.64 |
6.91 |
7.01 |
1.97 |
2.00 |
2.66 |
Mar 2006 |
6,500 |
6.51 |
6.66 |
6.66 |
4.17 |
3.43 |
3.36 |
Apr 2006 |
5,000 |
5.52 |
5.87 |
5.98 |
5.57 |
4.96 |
2.02 |
May 2006 |
18,500 |
5.70 |
6.07 |
6.34 |
1.88 |
1.84 |
1.69 |
Jun 2006 |
15,000 |
6.15 |
6.64 |
6.77 |
1.63 |
1.35 |
2.11 |
Jul 2006 |
16,500 |
6.42 |
6.75 |
7.03 |
1.82 |
1.55 |
3.12 |
Aug 2006 |
19,000 |
6.41 |
6.70 |
6.96 |
2.03 |
2.71 |
3.48 |
Sep 2006 |
15,000 |
6.51 |
6.76 |
6.91 |
1.35 |
1.80 |
2.92 |
Oct 2006 |
15,000 |
6.63 |
6.84 |
6.95 |
1.31 |
1.20 |
2.02 |
Nov 2006 |
18,500 |
6.65 |
6.92 |
6.99 |
1.33 |
1.22 |
2.49 |
Dec 2006 |
15,000 |
7.01 |
7.27 |
7.09 |
1.19 |
1.29 |
3.34 |
Jan 2007 |
19,000 |
7.28 |
7.45 |
7.39 |
1.02 |
1.35 |
1.74 |
Feb 2007 |
15,000 |
7.72 |
7.67 |
7.79 |
2.48 |
2.56 |
3.16 |
Mar 2007 |
15,000 |
7.73 |
7.98 |
7.90 |
2.08 |
2.15 |
3.87 |
Apr 2007 |
15,000 |
7.53 |
7.87 |
7.72 |
2.87 |
3.36 |
3.16 |
May 2007 |
18,500 |
7.59 |
7.70 |
7.79 |
2.33 |
2.57 |
2.33 |
Jun 2007 |
35,000 |
7.41 |
7.76 |
6.67 |
3.23 |
4.11 |
3.97 |
Jul 2007 |
12,500 |
5.07 |
5.94 |
6.87 |
4.48 |
2.70 |
4.56 |
Aug 2007 |
20,500 |
6.74 |
7.37 |
7.42 |
2.11 |
1.41 |
2.46 |
Sep 2007 |
25,000 |
7.08 |
7.33 |
7.48 |
2.07 |
2.91 |
2.83 |
Oct 2007 |
28,500 |
7.11 |
7.45 |
7.37 |
2.16 |
1.73 |
3.23 |
Nov 2007 |
22,500 |
7.47 |
7.65 |
7.75 |
1.63 |
1.38 |
1.88 |
Dec 2007 |
7,500 |
7.41 |
7.60 |
7.69 |
4.41 |
4.61 |
3.67 |
@: Total for the financial year.
Note:1. 182-day TBs were reintroduced with effect from April 2005.
2. Notified amounts are inclusive of issuances under the Market Stabilisation Scheme (MSS). |
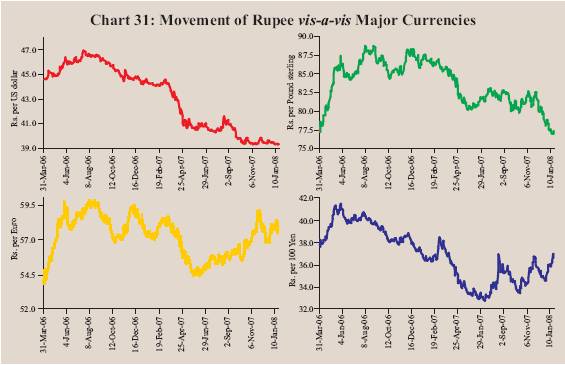
US dollar vis-à-vis other currencies and strong domestic stock markets. The exchange rate of the rupee was Rs.39.57 per US dollar as on January 23, 2008. At this level, the Indian rupee appreciated by 10.2 per cent over its level on March 31, 2007. Over the same period, the rupee appreciated by 10.5 per cent against the Pound sterling, 0.4 per cent against the Euro and 3.1 per cent against the Chinese yuan, while depreciated by 0.5 per cent against the Japanese yen (Chart 31).
On an average basis, the 36-currency trade weighted nominal effective exchange rate (NEER) and real effective exchange rate (REER) of Indian rupee appreciated by 7.5 per cent and 7.6 per cent, respectively, between March 2007 and October 2007. Over the same period, the 6-currency trade weighted NEER and REER appreciated by 7.5 per cent and 7.8 per cent, respectively (Table 41). The 6-currency NEER and REER, however, depreciated by 0.8 per cent and 1.3 per cent, respectively, between end-September 2007 and January 17, 2008.
Forward premia remained lower than their end-March 2007 levels (Chart 32'). However, the one-month and three-month forward premia increased from 0.75 per cent each at end-September 2007 to 2.60 per cent and 2.34 per cent, respectively, as on January 17, 2008.
The average daily turnover in the foreign exchange market increased to US $ 45.9 billion during April-November 2007 from US $ 23.8 billion in the
Table 41: Nominal and Real Effective Exchange Rate of the Indian Rupee (Trade Based Weights) |
Year/Month |
Base : 1993-94 (April-March) = 100 |
|
6-Currency Weights |
36-Currency Weights |
|
NEER |
REER |
NEER |
REER |
1 |
2 |
3 |
4 |
5 |
1993-94 |
100.00 |
100.00 |
100.00 |
100.00 |
2001-02 |
76.04 |
102.71 |
91.58 |
100.86 |
2002-03 |
71.27 |
97.68 |
89.12 |
98.18 |
2003-04 |
69.97 |
99.17 |
87.14 |
99.56 |
2004-05 |
69.58 |
101.78 |
87.31 |
100.09 |
2005-06 |
72.28 |
107.30 |
89.85 |
102.35 |
2006-07 (P) |
68.93 |
105.47 |
85.88 |
98.50 |
Mar |
2006 |
72.45 |
107.41 |
89.52 |
101.25 |
Apr |
2006 |
71.04 |
105.75 |
87.73 |
98.19 |
May |
2006 |
68.79 |
103.48 |
85.43 |
96.42 |
Jun |
2006 |
68.21 |
103.06 |
85.11 |
96.57 |
Jul |
2006 |
67.59 |
102.25 |
84.22 |
95.73 |
Aug |
2006 |
67.08 |
102.14 |
83.61 |
95.61 |
Sep |
2006 |
67.84 |
104.75 |
84.65 |
97.98 |
Oct |
2006 |
69.11 |
107.25 |
86.18 |
99.94 |
Nov |
2006 |
69.34 |
107.82 |
86.50 |
100.32 |
Dec |
2006 |
68.82 |
106.39 |
85.89 |
99.16 |
Jan |
2007 (P) |
69.77 |
107.70 |
87.05 |
100.73 |
Feb |
2007 (P) |
69.88 |
107.71 |
87.20 |
100.71 |
Mar |
2007 (P) |
69.70 |
107.41 |
87.11 |
100.75 |
Apr |
2007 (P) |
72.18 |
111.59 |
91.50 |
103.79 |
May |
2007 (P) |
74.64 |
115.67 |
94.38 |
107.22 |
Jun 2007 (P) |
74.83 |
115.28 |
93.24 |
107.28 |
Jul |
2007 (P) |
74.62 |
115.27 |
93.09 |
107.46 |
Aug |
2007 (P) |
73.91 |
114.24 |
92.64 |
106.90 |
Sep |
2007 (P) |
74.11 |
115.14 |
92.93 |
107.66 |
Oct |
2007 (P) |
74.92 |
115.80 |
93.68 |
108.43 |
Nov |
2007 (P) |
73.82 |
114.03 |
- |
- |
Dec 2007 (P) |
74.17 |
114.54 |
- |
- |
January 17, 2008 |
74.11 |
114.51 |
- |
- |
NEER: Nominal Effective Exchange Rate.
REER: Real Effective Exchange Rate.
P: Provisional. -: Not available.
Note: Rise in indices indicates appreciation of the rupee and vice versa. |
corresponding period of 2006. While inter-bank turnover increased to US $ 31.9 billion from US $ 17.2 billion, the merchant turnover increased to US $ 14.0 billion from US $ 6.6 billion (Chart 33). The ratio of inter-bank to merchant turnover was 2.4 during April-November 2007 as compared with 2.6 a year ago.
Credit Market
Interest rates of public sector banks (PSBs) on deposits of maturity of one year to three years were placed in the range of 8.00-9.25 per cent in January 2008 as compared with the range of 7.25-9.50 per cent in March 2007, while those on deposits of maturity of above three years were placed in the range of 8.00-9.00 per cent as compared with the range of 7.50-9.50 per cent during the same period. 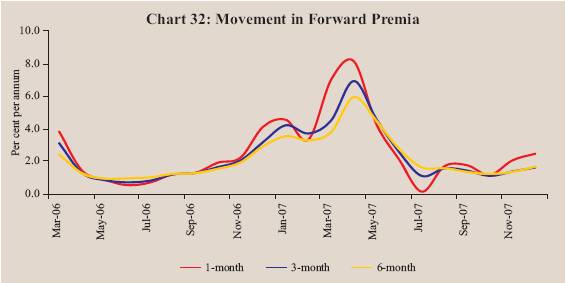
Benchmark Prime Lending Rates (BPLRs) of PSBs increased from the range of 12.25-12.75 per cent in March 2007 to the range of 12.50-13.50 per cent in January 2008. BPLRs of private sector banks also increased to the range of 13.00-16.50 per cent in January 2008 from 12.00-16.50 per cent in March 2007. The range of BPLRs of foreign banks, however, remained unchanged during this period (Table 42 and Chart 34).
The weighted average BPLR of PSBs and private sector banks increased from 12.43 per cent and 14.34 per cent, respectively, in March 2007 to 13.07 per cent 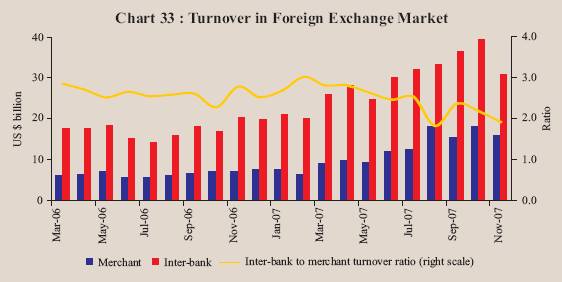
Table 42: Deposit and Lending Rates |
(Per cent) |
Item |
March |
March |
June |
September |
December |
January |
|
2006 |
2007 |
2007 |
2007 |
2007 |
2008 |
1 |
2 |
3 |
4 |
5 |
6 |
7 |
1. |
Domestic Deposit Rate |
|
|
|
|
|
|
|
Public Sector Banks |
|
|
|
|
|
|
|
Up to 1 year |
2.25-6.50 |
2.75-8.75 |
2.75-8.75 |
2.75-8.50 |
2.75-8.50 |
2.75-8.50 |
|
More than 1 year and up to 3 years |
5.75-6.75 |
7.25-9.50 |
7.25-9.75 |
8.00-9.00 |
8.00-9.25 |
8.00-9.25 |
|
More than 3 years |
6.00-7.25 |
7.50-9.50 |
7.75-9.75 |
8.00-9.50 |
8.00-9.00 |
8.00-9.00 |
|
Private Sector Banks |
|
|
|
|
|
|
|
Up to 1 year |
3.50-7.25 |
3.00-9.00 |
3.00-9.50 |
2.50-9.25 |
2.50-8.50 |
2.50-8.50 |
|
More than 1 year and up to 3 years |
5.50-7.75 |
6.75-9.75 |
6.75-10.25 |
6.25-10.00 |
7.25-9.60 |
7.25-9.60 |
|
More than 3 years |
6.00-7.75 |
7.75-9.60 |
7.50-10.00 |
7.25-10.00 |
7.25-10.00 |
7.25-10.00 |
|
Foreign Banks |
|
|
|
|
|
|
|
Up to 1 year |
3.00-6.15 |
3.00-9.50 |
0.25-9.00 |
2.00-9.00 |
2.00-9.25 |
2.00-9.25 |
|
More than 1 year and up to 3 years |
4.00-6.50 |
3.50-9.50 |
3.50-9.50 |
2.00-9.50 |
2.00-9.75 |
2.00-9.75 |
|
More than 3 years |
5.50-6.50 |
4.05-9.50 |
4.05-9.50 |
2.00-9.50 |
2.00-9.50 |
2.00-9.50 |
2. |
Benchmark Prime Lending Rate |
|
|
|
|
|
|
|
Public Sector Banks |
10.25-11.25 |
12.25-12.75 |
12.50-13.50 |
12.50-13.50 |
12.50-13.50 |
12.50-13.50 |
|
Private Sector Banks |
11.00-14.00 |
12.00-16.50 |
13.00-17.25 |
13.00-16.50 |
13.00-16.50 |
13.00-16.50 |
|
Foreign Banks |
10.00-14.50 |
10.00-15.50 |
10.00-15.50 |
10.00-15.50 |
10.00-15.50 |
10.00-15.50 |
3. |
Actual Lending Rate* |
|
|
|
|
|
|
|
Public Sector Banks |
4.00-16.50 |
4.00-17.00 |
4.00-17.75 |
4.00-17.75 |
- |
- |
|
Private Sector Banks |
3.15-20.50 |
3.15-25.50 |
4.00-26.00 |
4.00-24.00 |
- |
- |
|
Foreign Banks |
4.75-26.00 |
5.00-26.50 |
2.98-28.00 |
2.00-28.00 |
- |
- |
- : Not available.
* : Interest rate on non-export demand and term loans above Rs.2 lakh excluding lending rates at the extreme five per cent on both sides. |
and 15.14 per cent in December 2007. The weighted average BPLR of foreign banks also increased from 12.63 per cent to 14.00 per cent during the same period. 
Government Securities Market
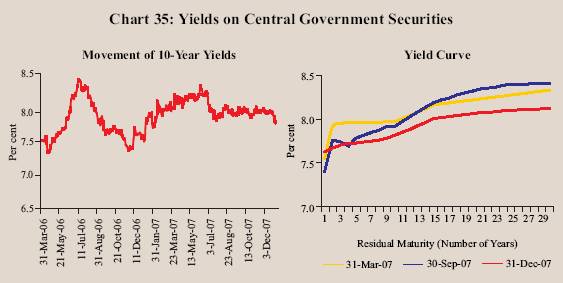
Yields in the Government securities market remained range-bound during the third quarter of 2007-08, partly reflecting global trends in yields, lower inflation and easy liquidity conditions (Chart 35). Yields softened since the first week of January 2008 reflecting easy liquidity conditions and lower inflation. The 10-year yield moved in a range of 7.42-8.32 per cent during 2007-08 (up to January 23, 2008). As on January 23, 2007, the yield was 7.42 per cent, 55 basis points lower than that at end-March 2007. The spread between 1-10 year yields was 19 basis points at end-December 2007 as compared with 52 basis points at end-September 2007 (42 basis points at end-March 2007). The spread between 10-year and 30-year yields was 31 basis points at end-December 2007 as compared with 49 basis points at end-September 2007 (37 basis points at end-March 2007).
The turnover in the Government securities market declined in November 2007 after increasing in October 2007 on account of hike in the CRR. The turnover, however, increased in December 2007 (Chart 36). The yield on 5-year AAA-rated corporate bonds softened during the third quarter of 2007-08. The credit spread between the yields on 5-year AAA-rated bonds and 5-year Government securities narrowed to 127 basis points at end-December 2007 from 157 basis points at end-September 2007 (142 basis points at end-March 2007) (Chart 37).
Equity Market
Primary Market
Resources raised through public issues increased sharply during April-December 2007 over the corresponding period of last year. Cumulative resources raised through public issues during April-December 2007 increased by 101.9 per cent to Rs. 49,215 crore. The number of issues increased from 79 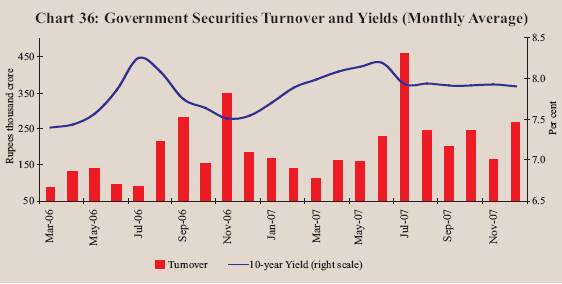
in April-December 2006 to 91 in April-December 2007 (Table 43). The average size of public issues also increased to Rs.541 crore during April-December 2007 from Rs.309 crore during April-December 2006. All public issues during April-December 2007 were in the form of equity, barring one. Out of 91 issues during April-December 2007, 65 issues were initial public offerings (IPOs), accounting for 49.8 per cent of total resource mobilisation.
Mobilisation of resources through private placement increased by 25.6 per cent to Rs.94,386 crore during April-September 2007 over the corresponding period of the previous year (Table 43). Resources mobilised by private sector entities increased by 45.1 per cent, while those by public sector entities increased by 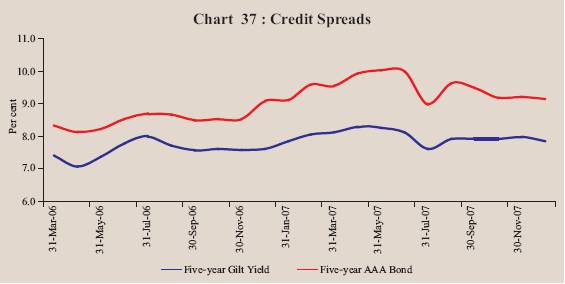
Table 43: Mobilisation of Resources from the Primary Market
|
(Amount in Rupees crore) |
Item |
2006-07 |
2007-08 |
|
(April-December) |
(April-December) P |
|
No. of Issues |
Amount |
No. of Issues |
Amount |
1 |
2 |
3 |
4 |
5 |
A. |
Prospectus and Rights Issues* |
|
|
|
|
|
1. |
Private Sector (a+b) |
79 |
24,381 |
88 |
45,883 |
|
|
a) Financial |
6 |
1,032 |
9 |
13,986 |
|
|
b) Non-financial |
73 |
23,349 |
79 |
31,897 |
|
2. |
Public Sector (a+b+c) |
- |
- |
3 |
3,332 |
|
|
a) Public Sector Undertakings |
- |
- |
2 |
2,516 |
|
|
b) Government Companies |
- |
- |
- |
- |
|
|
c) Banks/Financial Institutions |
- |
- |
1 |
816 |
|
3. |
Total (1+2) |
79 |
24,381 |
91 |
49,215 |
|
|
of which: |
|
|
|
|
|
|
(i) Equity |
77 |
23,625 |
90 |
48,715 |
|
|
(ii) Debt |
2 |
756 |
1 |
500 |
|
|
|
2006-07(April-
September) |
2007-08 (April-
September) |
B. |
Private Placement |
|
|
|
|
|
1. |
Private Sector |
718 |
40,639 |
824 |
58,977 |
|
|
a) Financial |
269 |
23,630 |
423 |
35,346 |
|
|
b) Non-financial |
449 |
17,009 |
401 |
23,631 |
|
2. |
Public Sector |
66 |
34,501 |
52 |
35,409 |
|
|
a) Financial |
54 |
28,882 |
39 |
26,131 |
|
|
b) Non-financial |
12 |
5,619 |
13 |
9,278 |
|
3. |
Total (1+2) |
784 |
75,140 |
876 |
94,386 |
|
|
of which: |
|
|
|
|
|
|
(i) Equity |
783 |
75,083 |
- |
- |
|
|
(ii) Debt |
1 |
57 |
876 |
94,386 |
Memo: |
C. Euro Issues (Apr-Dec) # |
35 |
8,840 |
15 |
14,417 |
P : Provisional. * :Excluding offers for sale.
- : Nil/Negligible. # : Includes ADRs and GDRs only. |
only 2.6 per cent during April-September 2007. Financial intermediaries (both from public sector and private sector) accounted for the bulk (65.1 per cent) of the total resource mobilisation from the private placement market during April-September 2007 (69.9 per cent during April-September 2006).
Resources raised through Euro issues _ American Depository Receipts (ADRs) and Global Depository Receipts (GDRs) _ by Indian corporates during April-December 2007 at Rs.14,417 crore were substantially higher than those during the corresponding period of previous year (Table 43).
During April-December 2007, net mobilisation of resources by mutual funds increased by 55.6 per cent to Rs.1,23,993 crore over the corresponding period of 2006 (Table 44). Scheme-wise, 81.5 per cent of net mobilisation of funds was
Table 44 : Resource Mobilisation by Mutual Funds |
(Rupees crore) |
Category |
April-March |
April-December |
|
2006-07 |
2006-07 |
2007-08 |
|
Net |
Net |
Net |
Net |
Net |
Net |
|
Mobilisation @ |
Assets# |
Mobilisation @ |
Assets # |
Mobilisation @ |
Assets # |
1 |
2 |
3 |
4 |
5 |
6 |
7 |
Private Sector |
79,038 |
2,62,079 |
64,140 |
2,56,725 |
1,05,868 |
4,47,174 |
Public Sector * |
14,947 |
64,213 |
15,568 |
66,873 |
18,125 |
1,02,762 |
Total |
93,985 |
3,26,292 |
79,708 |
3,23,598 |
1,23,993 |
5,49,936 |
@: Net of redemptions. #: End-period. *: Including UTI Mutual fund.
Note: Data exclude funds mobilised under Fund of Funds Schemes.
Source: Securities and Exchange Board of India. |
under income/debt market-oriented schemes, out of which bulk of the resources were mobilised through debt other than assured return schemes. Growth-oriented schemes accounted for only 15.3 per cent of net resource mobilisation during April-December 2007.
Secondary Market
The domestic stock markets recorded further gains during the third quarter of 2007-08 amidst intermittent corrections (Chart 38). Liquidity support from both foreign institutional investors (FIIs) and domestic mutual funds on the back of strong GDP growth, healthy corporate profitability and decline in the domestic inflation rate aided the market sentiment. The upward trend in EMEs equity markets, increase in ADR prices in the US markets and rise in global metal prices were the other factors that enthused the domestic stock markets. The uptrend in the domestic stock markets, however, was interspersed by corrections 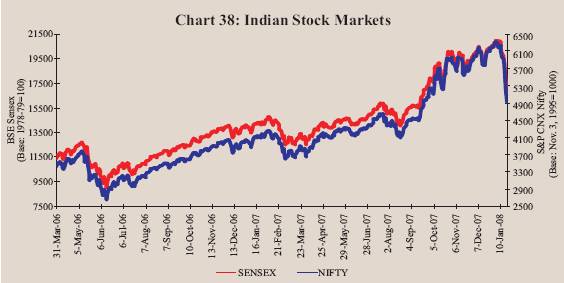
in mid-August and mid-December 2007 mainly on account of downward trend in advanced economies equity markets on account of worries over sub-prime losses and credit crunch in the US and Europe, concerns over the slowdown in the US economy, depreciation of the US dollar against major currencies and increase in global crude oil prices to record high levels.
Between end-March 2007 and January 23, 2008, the BSE Sensex moved in a range of 12455.37-20873.33. The BSE Sensex closed at a record high of 20873.33 on January 8, 2008, an increase of 59.7 per cent over end-March 2007. The S&P CNX Nifty also reached a record high of 6287.85 on January 8, 2008.
Since mid-January 2008 the domestic stock markets, however, witnessed sharp corrections mainly on account of downward trend in the major international equity markets amidst fears of recession in the US economy and depreciation of the US dollar against major currencies. Liquidity squeeze from the secondary market in the wake of the biggest IPO by Reliance Power, heavy net sales by FIIs in the Indian equity market, decline in ADR prices and fall in metal prices on the London Metal Exchange also dampened the market sentiment. The BSE Sensex closed at 17594.07 on January 23, 2008, witnessing a gain of 34.6 per cent over end-March 2007.
According to the data released by the Securities and Exchange Board of India (SEBI), FIIs have invested Rs.61,234 crore (US $ 14.9 billion) in the Indian equity market during 2007-08 so far (up to January 18, 2008) as compared with net purchases of Rs.18,045 crore (US $ 3.9 billion) during the corresponding period of the previous year (Chart 39). Mutual funds have made net investments of Rs. 9,788 crore during 2007-08 so far (up to January 18, 2008) as compared with net investments of Rs.12,595 crore during the corresponding period of last year.
The major gainers in the domestic stock markets during the current financial year so far (up to January 18, 2008) were metal, capital goods, oil and gas, banking, consumer durables, public sector undertakings, fast moving consumer goods and auto sector stocks (Table 45). 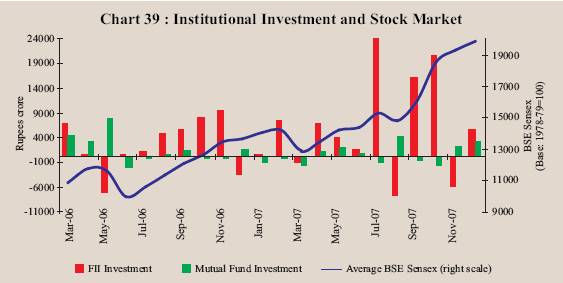
Table 45: BSE Sectoral Stock Indices
|
(Base: 1978-79=100) |
Sector |
Variation (per cent) |
|
End-March
2006@ |
End-March
2007@ |
January 18,
2008 # |
1 |
2 |
3 |
4 |
Fast Moving Consumer Goods |
109.9 |
-21.4 |
32.4 |
Public Sector Undertakings |
44.0 |
-3.2 |
63.1 |
Information Technology |
49.2 |
21.6 |
-22.6 |
Auto |
101.2 |
-8.5 |
5.7 |
Oil and Gas |
61.1 |
30.5 |
96.2 |
Metal |
40.3 |
-4.3 |
103.3 |
Health Care |
51.2 |
-5.4 |
10.3 |
Bankex |
36.8 |
24.2 |
73.8 |
Capital Goods |
156.0 |
11.1 |
102.0 |
Consumer Durables |
115.4 |
11.1 |
63.7 |
BSE 500 |
65.2 |
9.7 |
60.9 |
BSE Sensex |
73.7 |
15.9 |
45.5 |
@: Year-on-year variation. #: Variation over end-March 2007.
Source: Bombay Stock Exchange Limited. |
Reflecting the upward trend in stock prices, the price-earnings (P/E) ratios of the 30 scrips included in the BSE Sensex rose sharply from 20.3 at end-March 2007 to 27.7 at end-December 2007. The market capitalisation of the BSE increased sharply by 102.3 per cent between end-March 2007 and end-December 2007. The volatility in the stock market also increased during April-December 2007 (Table 46). The combined turnover of BSE and NSE in the cash segment during April-December 2007 was higher by 75.7 per cent than the corresponding period of 2006.
Table 46: Stock Market Indicators |
|
BSE |
NSE |
Indicator |
2005-06 |
2006-07 |
April-December |
2005-06 |
2006-07 |
April-December |
|
|
|
2006 |
2007 |
|
|
2006 |
2007 |
1 |
2 |
3 |
4 |
5 |
6 |
7 |
8 |
9 |
1. BSE Sensex / S&P CNX Nifty |
|
|
|
|
|
|
|
|
(i)End-period |
11280 |
13072 |
13787 |
20287 |
3403 |
3822 |
3966 |
6139 |
(ii) Average |
8280 |
12277 |
11845 |
16174 |
2513 |
3572 |
3454 |
4770 |
2. Coefficient of Variation |
16.7 |
11.1 |
10.4 |
14.1 |
15.6 |
10.4 |
9.7 |
15.0 |
3. Price-Earning Ratio |
|
|
|
|
|
|
|
|
(end-period)* |
20.9 |
20.3 |
22.8 |
27.7 |
20.3 |
18.4 |
21.3 |
27.6 |
4. Price-Book Value Ratio* |
5.1 |
5.1 |
5.2 |
6.7 |
5.2 |
4.9 |
5.1 |
6.4 |
5. Yield* (per cent per annum) |
1.2 |
1.3 |
1.2 |
0.8 |
1.3 |
1.3 |
1.2 |
0.8 |
6. Listed Companies |
4,781 |
4,821 |
4,796 |
4,887 |
1,069 |
1,228 |
1,158 |
1,353 |
7. Cash Segment Turnover |
|
|
|
|
|
|
|
|
(Rupees crore) |
8,16,074 |
9,56,185 |
7,01,710 |
11,60,248 |
15,69,556 |
19,45,285 |
14,22,014 |
25,70,712 |
8. Derivative Segment |
|
|
|
|
|
|
|
|
Turnover (Rupees crore) |
9 |
59,007 |
18,065 |
1,78,882 |
48,24,174 |
73,56,242 |
53,31,531 |
99,16,166 |
9. Market Capitalisation |
|
|
|
|
|
|
|
|
(Rupees crore) @ |
30,22,191 |
35,45,041 |
36,24,357 |
71,69,985 |
28,13,201 |
33,67,350 |
34,26,236 |
65,43,272 |
* : Based on 30 scrips included in the BSE Sensex and 50 scrips included in the S&P CNX Nifty. @: End-period.
Source: Bombay Stock Exchange Ltd. (BSE) and National Stock Exchange of India Ltd. (NSE). |
1 Cash flows generated by sub-prime mortgages were often repackaged into structured credit products and sold to investors. |


