
VII. Macroeconomic Outlook - ਆਰਬੀਆਈ - Reserve Bank of India


VII. Macroeconomic Outlook
Surveys conducted by the Reserve Bank as well as other agencies to collect lead information on the expectations about the overall business outlook point to significant turnaround and rising optimism, which is also corroborated by the recovery in the industrial production up to August 2009. The expected decline in agricultural output under the influence of the deficient monsoon, however, has impacted the overall growth outlook, which is evident from the findings of the Reserve Bank’s survey of professional forecasters suggesting a downward revision to the growth outlook for 2009-10 from 6.5 per cent to 6.0 per cent. The inflation outlook, notwithstanding the low year-on-year WPI inflation so far, is conditioned by the pressures of emerging high inflation in essential commodities as well as elevated and expanding consumer price inflation. VII.1 The projections of various domestic and international agencies as well as the different forward looking surveys point to an improvement in India’s growth outlook. However, the impact of the deficient monsoon on agricultural output and rural demand could inhibit a faster recovery. Business confidence surveys in general exhibit significant optimism, a marked turnaround from the bearish sentiments of the previous quarters. The industrial outlook survey of the Reserve Bank indicates the return of the economy to an expansion path. The professional forecasters’ survey conducted by the Reserve Bank in September 2009, however, suggests a downward revision to the growth outlook, reflecting the expected negative impact of the deficient monsoon on agricultural output. Business Expectations Surveys VII.2 Surveys conducted by different agencies to collect lead information on the forward looking assessment of the companies about the prospects of the economy show a general pattern of optimism, with the relevant business confidence indices exhibiting significant increases over the levels in the preceding quarter (Table 7.1)
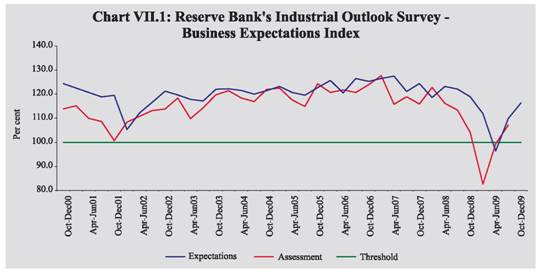
VII.3 The Business Confidence Index (BCI) of the NCAER (National Council of Applied Economic Research) that was released in July 2009 showed a 45 percent increase over the level in the previous quarter, which represents a reversal of the declining trend that was noticed in the previous five quarters. The survey exhibited improvement in all four components of BCI, i.e. “investment climate”, “overall economic conditions”, “financial position of firms” and “capacity utilisation”. The improvement was also broad based across all five sectors, i.e. consumer durables, consumer non-durables, capital goods, intermediates and services. The October 2009 NCAER-Mastercard Worldwide Index of Business Confidence shows further improvement in the BCI by 21 per cent, over and above the 45 per cent increase in July over April 2009. The findings of the survey suggest business sentiments returning closer to the pre-crisis levels. VII.4 The Business Confidence Survey of the FICCI for Q1:2009-10 that was released in September 2009 suggests that 70 per cent of the companies felt the overall economic conditions to be “moderately to substantially better” compared to previous six months. The overall business confidence index rose by 4.8 per cent over the previous quarter level, as 50 per cent of the survey respondents expected sales volume to increase, 30 per cent expected investment to increase, and 22 per cent viewed that they would add to the workforce in the next two quarters. While 80 per cent of the respondents recognised the beneficial effects of the fiscal stimulus on economic activity, rising cost of raw materials and manpower, delayed monsoon and high interest rates were expressed as areas of concern. VII.5 The Dun and Bradstreet Business Optimism Index for Q3:2009 which was conducted in June 2009 rose sharply by 40.8 per cent over the lowest level of the index in the previous quarter. Five of the six optimism indices, namely volume of sales, net profits, new orders, selling prices, and employee levels recorded improvement over the previous quarter. Inventory levels, however, declined by 2 percentage points. VII.6 The HSBC Markit Purchasing Managers’ Index (PMI) – which is an indicative measure of the health of the manufacturing sector – moved up in September 2009 after the decline in August 2009, but remained above the threshold (of 50) for the sixth month in a row suggesting expansion in activities. The turnaround into the expansion phase since April 2009 is largely driven by home market. PMI for the services remained in the expansion zone (i.e., above 50), though with some moderation in September 2009. The composite PMI in September 2009 was almost unchanged in the expansion zone, as improvement in manufacturing was offset by moderation in services. Reserve Bank’s Industrial Outlook Survey VII.7 The 47th round of Industrial Outlook Survey of the Reserve Bank conducted in July-August 2009 showed further improvement in the sentiments of the manufacturing sector after the turnaround that was seen in the survey findings of the previous quarter. The survey covered opinions on “assessment for July-September 2009” and “expectations for October-December 2009”, and both indices remained in the growth terrain (i.e. above 100, which is the threshold that separates contraction from expansion) for the last two quarters of 2009. This suggests that as per expectations of the survey respondents, the industrial recovery already seen up to August 2009 in terms of trends in IIP growth could gain further momentum during 2009-10 (Chart VII.1). The indices for assessment (July-September) and expectations (October-December) reached 107.2 and 116.4, respectively. VII.8 The survey findings also indicate improving demand conditions, as reflected in better expectations about order books, capacity utilisation and production. The working capital finance requirement is expected to grow in the October- December quarter of 2009, which suggests that demand for credit from the private sector may exhibit a turnaround from the persistent deceleration experienced so far. The overall survey response indicates that availability of finance has further improved and eased, which corroborates the impact of the accommodative monetary policy stance in improving the availability of finance in general. The survey findings also point to continuation of pressures on profit margins, though of a much lower magnitude in relation to what was experienced in past few quarters. The input prices are expected to firm up for the second successive quarter; with improving demand condition, however, gradual return of pricing power could also give rise to higher selling prices. According to the survey findings, the outlook for employment is also improving and firms are expected to increase their workforce on the back of expected increase in demand (Table 7.2).
VII.9 The significant upturn in business expectations could be seen as broad based across industry groups, though industries such as transportation, food products, pharmaceuticals and fertilisers look more optimistic than the others. The input price inflation is also felt across the board, but it is higher for paper, rubber, textiles and food industries. All industries, excluding textiles, are expected to increase their employment levels. The improvement is also seen across all size groups, but the bigger companies with annual production of Rs. 1,000 crore or more look most optimistic. Survey of Professional Forecasters1 VII.10 The general prevailing perception about the impact of the delayed monsoon gets reflected in the assessment of the growth outlook of the professional forecasters. The results of the ninth round of survey of professional forecasters' conducted by the Reserve Bank in September 2009 shows overall (median) growth rate for 2009-10 at 6.0 per cent, as against 6.5 per cent reported in the earlier survey (Table 7.3). The sectoral growth rate forecast for the agriculture sector was revised downwards from 2.5 per cent to (-) 1.4 per cent, whereas for industry the assessment was revised upwards from 4.8 per cent to 6.3 per cent. For services, the forecasts suggest modest downward revision from 8.3 per cent in the earlier survey to 8.1 per cent in the current survey.
VII.11 The outlook for India’s growth in 2009-10 as projected by different organisations since June 2009 has been either revised upwards or maintained unchanged (Table 7.4). The Asian Development Bank (ADB) revised the growth outlook for India upwards in September 2009 from 5 per cent to 6 per cent, highlighting the role of both emerging signs of recovery in business confidence and continuation of fiscal stimulus. NCAER outlook released in July 2009 also showed a higher projected growth figure of 7.2 per cent for 2009-10, notwithstanding the significant downward revision in growth outlook for the agriculture sector to 1 per cent from the previous projection of 2.5 per cent. The IMF had already scaled up the projected growth for India in its July 2009 outlook from 4.5 per cent to 5.4 per cent. The October 2009 outlook of the IMF retains the projected growth at the same level for 2009, while highlighting the role of policy stimulus in boosting domestic demand and relatively lower dependence of India on exports in relation to other Asian countries. The Economic Advisory Council to the Prime Minister projected recently the Indian economy to grow by 6.5 per cent in 2009-10, with an assessment suggesting growth unlikely to be lower than 6.25 per cent but with the possibility of reaching 6.75 per cent.
Factors Influencing the Current Growth and Inflation Outlook VII.12 Emerging upside prospects as well as possible downside risks condition the current assessment of India’s growth outlook for 2009-10. Factors that support the prospects of a faster and sustained recovery in growth include: (a) the impact of the policy stimulus, (b) visible signs of industrial recovery, as evidenced by 5.8 per cent growth in IIP during April-August 2009, with double digit growth recorded in August, (c) stronger performance of the core infrastructure sector, showing higher growth of 4.8 per cent in April-August 2009 as against 3.3 per cent in the corresponding period of the previous year, besides the significant acceleration in growth in August 2009 at 7.1 per cent, (d) improvement in lead indicators of services in July-September 2009, such as railways freight, cement production/delivery, sales of steel and automobiles including commercial vehicles, (e) significant upturn in the business confidence as per different business expectations surveys, including the Reserve Bank’s Industrial Outlook Survey, (f) revival in capital flows in the first half of 2009-10, after two consecutive quarters of net outflows in the second half of 2008-09, (g) significant recovery in the stock market (over end March 2009 level), and higher resource mobilisation through public issues and private placements in the first five months of 2009-10 over the corresponding period of last year, and (h) the improving overall global economic and financial conditions. VII.13 A number of strong downside risks weigh down the growth prospects: (a) the deceleration in growth of private consumption and investment demand,(b) deficient monsoon and drought like conditions in several parts of the country and the flood in a few states affecting bothkharif production as well as rural demand, (c) decline in sales of corporates in the first quarter of 2009-10, (d) persistence of deceleration in non-food credit growth, with growth in credit card and consumer durables related credit turning negative, suggesting possible continuation of the deceleration in private consumption demand even in the second quarter of 2009- VII.14 The combination of weak recovery and elevated CPI inflation has already magnified the complexity of policy challenges, notwithstanding the subdued nature of headline WPI inflation so far. Among the alternative plausible sources of inflation that could determine the near-term inflation outlook, factors which support possible firming up of headline inflation clearly overshadow the factors which may help in containing the inflationary pressures. The sources of comfort for the inflation outlook could be: (a) persistence of negative output-gap and weak aggregate demand, (b) stabilisation of international oil prices over the last few months, notwithstanding the recent increase in October 2009 so far, (c) modest recent deceleration in broad money growth, despite the accommodative monetary policy stance of the Reserve Bank, (d) no further increase in minimum support prices for agricultural commodities, since that could worsen the inflation with much greater certainty than helping in generating positive supply response, (e) effective use of the high stock of foodgrains with special focus on improved distribution to contain the high food prices, (f) better harvest during rabi season that could help in bringing down the prices of certain commodities which have led the spiral in inflation in essential commodities so far, and (g) selective import of certain commodities where the current price differentials with international markets could still be significant. VII.15 Factors that could firm up inflationary pressures further in the near-term, particularly in terms of headline WPI inflation include: (a) fading base effect of the last year, which in itself alone will manifest in the form of positive WPI inflation in the second half of 2009-10, (b)the rigidity of the CPI inflation at the double digit level for last few months, (c) strong upward momentum already seen in WPI inflation as the index has risen by 5.9 per cent over its end-March 2009 level, even though the year-on-year inflation continues to be low at 1.2 per cent,(d) high inflation in food and essential commodities, which requires augmentation of supply, but could be difficult to ensure over the short-run, and limited import options for specific commodities, (e) persistent high CPI inflation, which could lead to wage/ cost push inflation, as wages and prices would come under increasing pressure of revision with gradual return of pricing power and wage bargaining, (f) the risk of further increase in minimum support prices under the cost-plus pricing approach, (g) possible firming up of international commodity prices with economic recovery and sudden spurt in demand from EMEs, and more importantly (h) given the dominance of supply side factors in the emerging inflationary pressures, the policy challenges in anchoring inflation expectations. The overall economic outlook, thus, is conditioned by both upside prospects of recovery with downside risks and emerging inflationary pressures. 1 Introduced by the Reserve Bank from the quarter ended September 2007. The forecasts reflect the views of professional forecasters and not the Reserve Bank. |
||||||||||||||||||||||||||||||||||||||||||||||||||||||||||||||||||||||||||||||||||||||||||||||||||||||||||||||||||||||||||||||||||||||||||||||||||||||||||||||||||||||||||||||||||||||||||||||||||||||||||||||||||||||||||||||||||||||||||||||||||||||||||||||||||||||||||||||||||||||||||||||||||||||||||||||||||||||||||||||||||||||||||||||||||||||||||||||||||||||||||||||||||||||||||||||||||||||||||||||||||||||||||||||||||||||||||||||||||||||||||||||||||||||||||||||||||||||||||||||||||||||||||||||||||||||||||||||||||||||||||||||||||||||||||||||||||||||||||||||||||||||||||||||||||||||||||||||||||||||||||||||||||||||||||||||||||||||||||||||||||||||||||||||||||||||||||||||||||||||||||||||||||||||||||||||||||||||||||||||||||||||||||||||||||||||||||||||||||||||||||||||||||||||||||||||||||||||||||||||||||||||||||||||||||||||||||||||||||||||||||||||||||||||||||||||||||

ਇਸ ਪੇਜ ਨੂੰ ਸ਼ੇਅਰ ਕਰੋ:


ਭਾਰਤੀ ਰਿਜ਼ਰਵ ਬੈਂਕ ਮੋਬਾਈਲ ਐਪਲੀਕੇਸ਼ਨ ਇੰਸਟਾਲ ਕਰੋ ਅਤੇ ਨਵੀਨਤਮ ਖਬਰਾਂ ਤੱਕ ਤੇਜ਼ ਐਕਸੈਸ ਪ੍ਰਾਪਤ ਕਰੋ!


