 IST,
IST,
Chapter III: Regulatory Initiatives in the Financial Sector
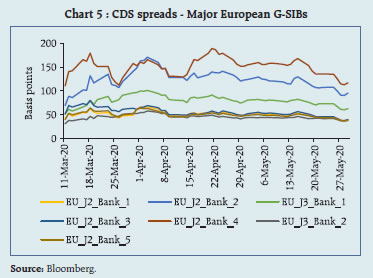
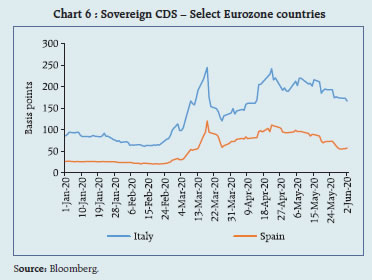
In their response to COVID-19 pandemic, central banks and other regulators as well as standard setting bodies have gone beyond the policy measures undertaken during the Global Financial Crisis (GFC) to address sagging demand conditions, sector-specific liquidity stress and financial stability and other concerns. Such policy actions find justification in the immediate circumstances, but they have also to balance regulatory and supervisory principles that ensure transparency with long-term stability of the financial system. On the domestic front, the Government of India and the financial sector regulators took several steps to deal with the pandemic-induced disruptions. The Financial Stability and Development Council (FSDC) along with its Sub Committee (FSDC-SC) have been alert to emerging challenges. 3.1 COVID-19 has taken a colossal toll of lives and livelihood and posed a cataclysmic threat to global financial stability. During Q1:2020, prices of risk assets collapsed, and market volatility spiked, with expectations of widespread defaults leading to a surge in borrowing costs. Given the unprecedented nature of the crisis, central banks have been called to the frontline again and have mobilised an unprecedented defence, involving both conventional and unconventional instruments – interest rate reduction; funding liquidity and market liquidity expansion; asset purchases; credit easing; macroprudential policies; and swap lines - to keep financial markets and financial intermediaries functional, and to preserve global financial stability. As a result of these measures1, equity markets recovered from their troughs, credit spreads narrowed from peaks, investor confidence improved, and risk appetite is gaining traction. III.1 Monetary Policy 3.2 As COVID-19 exploded into a pandemic, central banks’ first line of defence was to reduce policy interest rates in order to ease borrowing costs and financial stress. Among the systemically important central banks, the US Federal Reserve (US Fed) cut its target for the Federal funds rate by 150 bps to a range of 0 to 0.25 per cent in a space of less than 2 weeks. The Bank of England (BoE) reduced its policy rate by 65 bps in little more than a week to 0.1 per cent. Among other advanced economies, central banks had little room available as they were either close to the zero lower bound or already in the negative interest rate territory as in the case of European Central Bank (ECB) and the Bank of Japan (BoJ), the latter maintaining 10-year JGB yields at around 0 per cent under its yield curve control policy. 3.3 Central banks in developing countries also cut their policy rates sizeably relative to their own histories. Among the large emerging market economies, the Banco Central do Brasil cut its policy rate by 75 bps; the South African Central Bank reduced its policy rate by 100 bps; the Central Bank of the Republic of Turkey reduced its policy rate by 100 bps and Bank Indonesia lowered its policy rate by 50 bps. Central banks also provided forward guidance on the future path of policy rates, indicating a highly accommodative policy stance going forward. III.2 Funding and Market Liquidity 3.4 Central banks in both developed and developing countries also resorted to extraordinary infusion of liquidity in the wake of the pandemic. The US Fed, which was offering USD 100 billion in overnight repo and USD 20 billion in 2-week repo, expanded the facility, offering USD 1 trillion in daily overnight repo, USD 500 billion in one month repo and USD 500 billion in 3-month repo. In addition, it established - re-established in some cases - a series of facilities aimed at providing funding liquidity or improving market liquidity to ensure the smooth functioning of financial markets and to maintain the flow of credit in the economy. Central banks in other major economies, both advanced and emerging, also took several measures to provide liquidity, with several of them tailored to the country-specific context (Table 3.1). These monetary authorities are continuously recalibrating these facilities in terms of size, duration and collaterals accepted. In a similar vein, central banks in developing countries have also established facilities for providing liquidity and supporting economic activities. These facilities are commensurate with the stage of development of their financial systems and the headroom available. Central banks in emerging markets (EMs) have also proactively infused liquidity to prevent sudden insolvencies and thereby support financial stability. In India, the Reserve Bank of India (RBI) along with the Ministry of Finance and other financial sector regulators made robust interventions to offset the impact of the pandemic, which are detailed later in the section on ‘Domestic Developments’. III.3 Asset Purchases 3.5 Many central banks resumed large-scale asset purchases, or ‘quantitative easing’ (QE), a key tool used in response to the GFC to overcome the zero lower bound which has been hit by most AE central banks. The US Fed announced its intention to increase its holdings of Treasury securities and agency mortgage-backed securities (MBS) by at least USD 500 billion and USD 200 billion, respectively, to support the smooth functioning of financial markets. Subsequently, it went for open-ended purchases and also widened the purchases to include commercial mortgage-backed securities to support smooth market functioning and effective transmission of monetary policy to broader financial conditions and the economy. Market activity subsequently improved, and the Fed tapered its purchases through April and May. On June 10, however, the Fed indicated it would stop tapering and would buy at least USD 80 billion a month in Treasuries and USD 40 billion in residential and commercial mortgage backed securities until further notice. Between mid-March and mid-June, the Fed’s portfolio of outrightly held securities grew from USD 3.9 trillion to USD 6.1 trillion. Likewise, the BoE increased its holdings of UK government and sterling non-financial investment-grade corporate bonds by £200 billion. The BoJ decided to (a) actively purchase ETFs and Japan real estate investment trusts (J-REITs) to support their issuance; and (b) conduct further active purchases of both JGBs and T-bills, with a view to maintaining stability in the bond market and stabilising the entire yield curve at a lower level. The ECB launched a new temporary asset purchase programme - the Pandemic Emergency Purchase Programme (PEPP) - directed at private and public sector securities to the tune of €750 billion. It also added a temporary envelope of additional net asset purchases of €120 billion until end-2020 to the existing asset purchase programme (APP). Central banks in developing countries largely resorted to traditional open market operations (OMOs) in respective government securities to support the financial markets’ functioning and some of them fashioned unconventional liquidity tools in response to the extraordinary situation. III.4 Credit Facilities 3.6 As QE programs appeared to reach a wall in their efficacy – while overall borrowing costs eased, risk averse financial intermediaries and markets continued to discriminate against entities lower down in the credit risk curve - central banks made efforts to ensure credit flow to productive sectors. The US Fed established new facilities to support large corporations, small businesses, states and municipalities and, in an unprecedented move, decided to provide up to USD 2.6 trillion in loans although utilisation levels of the various programs have been significantly small relative to the outlay. The ECB recalibrated its targeted lending operations by expanding the range of acceptable collaterals with reduced haircuts for its refinancing operations, and also introduced pandemic emergency longer-term refinancing operations (PELTROs). The BoE introduced a 4-year concessional funding facility for banks, with provisions for additional funding for lending to small and medium sized enterprises. 3.7 These credit easing measures have helped in alleviating panic selling and in stabilising market conditions, including through announcement effects. In the US, corporate bond prices have been boosted across the rating spectrum, fuelling a record surge in new corporate bond sales, backed by the Fed’s purchases of USD 3 billion out of the budgeted USD 750 billion for corporate debt purchases till June 3. It is noteworthy that companies have been reluctant to utilise these facilities in jurisdictions with strong market oversight and corporate governance in view of perceptions of stigma (Table 3.2). III.5 Macroprudential Policies 3.8 Macroprudential interventions (e.g., modification or more flexible accounting rules; prudential criteria for classifying and measuring bank exposures affected by the crisis) have also been extensively deployed to combat the negative effects of COVID-19 and preserve financial stability (Table 3.3). 56 countries have implemented more than 700 macroprudential policies since late January 20202. Such steps effectively lighten capital and other regulatory requirements and/or a less stringent supervisory stance. International standard setters (e.g., Basel Committee on Banking Supervision (BCBS)) have also postponed the implementation of new standards and have publicly supported similar steps at the national/multilateral level [Group of Twenty (G20); Financial Stability Board (FSB)].
III.5.1 Policies for Flexibility in Troubled Asset Classification 3.9 Globally, governments and regulators have introduced steps to reduce the costs of loan modifications/restructuring to help borrowers adversely affected by the pandemic. These initiatives also obviate the requirement of additional capital against increased risk under prevailing accounting standards. The BCBS has endorsed these strategies as long as supervisors make sure that banks use them prudently and due disclosures are made to enable market participants to assess the rationale and potential impact of such actions by the banks. III.5.2 Policies for Easing Impact of Lifetime Expected Loss Accounting 3.10 Latest accounting standards require lenders to conduct forward-looking assessments of expected credit losses (ECLs) over the lifespan of each asset. Since expected-loss models cannot prepare banks for situations where black swan events materialise (e.g., COVID-19), it would be prudent to assume that the potential impact of COVID-19 on bank capital may be more pronounced than they would have been under an incurred-loss model or the earlier accounting approach. III.5.3 Relief to Insurance Industry 3.11 COVID-19 has had a pronounced impact on the insurance business, which is bracing up for a potential surge in insurance claims, including for business interruption covers, in anticipation of delays in claim submissions because of dislocations. In this context, insurance authorities have encouraged or instructed insurers to conserve capital by either delaying, reducing or cancelling dividend distribution and share buybacks and/or by reviewing variable remuneration policies and considering the postponement of disbursements. The International Association of Insurance Supervisors (IAIS), through its Insurance Core Principles (2019), has advised insurance supervisors to consider putting in place measures to dampen procyclical investment behaviour when designing a risk-based regulatory capital framework. Additionally, many insurance regulators3 have taken action to provide operational relief to insurers so as to help them re-deploy resources, maintaining business continuity and intensifying monitoring of financial exposure to COVID-19. III.5.4 Securities markets 3.12 The International Organisation of Securities Commissions (IOSCO) issued a public statement on May 29, 2020 highlighting the importance of timely and high-quality information on the impact of COVID-19 on securities issuers’ operating performance, financial position and prospects. The pandemic’s material implications for financial reporting and auditing, including issuers’ disclosures, should inform investment decisions. The IOSCO specifically underscored:
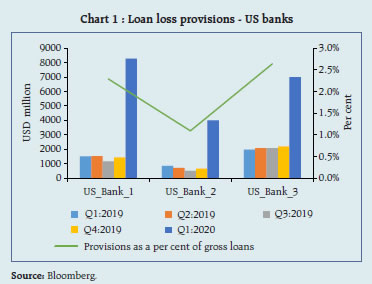
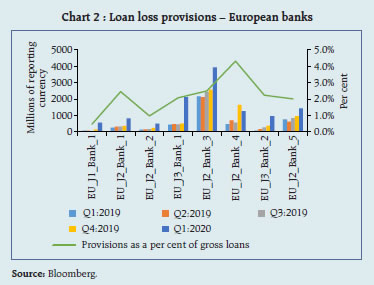
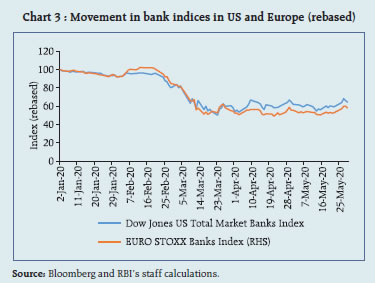
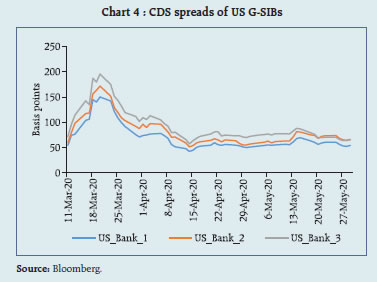
III.5.5 Need for an Exit Plan 3.13 The massive challenges caused by the pandemic have required regulators and policymakers to adopt bold and extraordinary approaches, measures and tools. Yet, such regulatory and supervisory responses should not compromise the stability and transparency of the financial system and endanger inter-generational stability. Regulatory forbearance should be complemented with sufficient and due disclosures on creditworthiness and supervisory oversight. A clearly laid out exit plan from the forbearance regime is highly desirable for the assurance of all stakeholders. For instance, the slew of measures aimed at countering the immediate impact of the pandemic has affected banks’ assets and liabilities, but the markets have varied reactions to banking stocks across jurisdictions (Box 3.1).
III.6 Domestic Developments 3.14 Since the publication of the last FSR in December 2019, the Financial Stability and Development Council (FSDC) and its Sub Committee (FSDC-SC) have been constantly monitoring the evolving situation through formal and informal interactions. In its 22nd meeting on May 28, 2020 chaired by the Finance Minister, the Council reviewed current global and domestic macroeconomic conditions, financial vulnerabilities, issues relating to NBFCs and credit rating agencies (CRAs), strengthening the resolution framework and cyber security of the financial sector. The Council noted that the COVID-19 pandemic poses a serious threat to the stability of the global financial system. It noted that decisive monetary and fiscal policy actions have stabilised investor sentiment in the short-run, but there is a need for the government and all regulators to keep a continuous vigil on financial vulnerabilities even as efforts are focussed on avoiding dislocation in financial markets. 3.15 At its 24th meeting held on June 18, 2020 the FSDC-SC reviewed major developments in global and domestic economies and financial markets. The Sub-Committee also discussed the setting up of an Inter Regulatory Technical Group on Fintech (IRTG-Fintech); the importance of cyber security across the financial system; and the National Strategy on Financial Education (NSFE) 2020-2025. It deliberated upon the status of and developments under the Insolvency and Bankruptcy Code (IBC), 2016 and the working of credit rating agencies. Overall, given the prevailing extraordinary circumstances, the Sub Committee unanimously resolved that (a) every participating regulator and ministry will continue to remain alert and watchful of the emerging challenges; (b) interact more frequently, both formally and informally, as also collectively; and (c) do whatever is necessary to revive the economy and preserve financial stability. III.6.1 Initiatives from Regulators 3.16 The RBI, other financial sector regulators and the Government of India (GOI) have taken several steps to mitigate the impact of COVID-19 induced dislocation. Financial sector regulators have taken initiatives spanning monetary stimulus and regulatory regimes to offset the COVID-19 impact. Significant regulatory actions to ease operational constraints due to the COVID-19 induced lockdown as also for maintaining market integrity and resilience in the face of severe risk aversion by market participants have been undertaken by the financial sector regulators (Annex 3). 3.17 The Government of India has, on its part, worked out a support package entailing a prudent mix of sovereign guarantee based schemes, direct fiscal expenditure and longer-term structural policy reforms. The package encompasses a comprehensive ‘Atma Nirbhar’ (self-reliance) package in five tranches covering measures to create rural employment, infrastructure, support to MSME sector, and creation of an enabling business environment. Other measures include expenditure control such as a freeze on employees’ dearness allowance as well as a relief package to support the vulnerable and disadvantaged sections of society, both in kind (free supply of grains) and cash (Direct Benefit Transfer or DBT). Put together, the overall package, including from the RBI in the form of various liquidity measures, is of the order of 10 per cent of GDP. Furthermore borrowing limits of State Governments were increased from 3 per cent to 5 per cent of gross state domestic product (GSDP). 3.18 The major elements of the GOI’s policy package include: (i) Fund of Funds for infusing equity into micro, small and medium enterprises (MSMEs), collateral-free loans for standard MSMEs, provision of subordinate debt to those MSMEs which are classified as stressed or NPA; (ii) Employee Provident Fund (EPF) support to eligible establishments by means of payment of employer and employee EPF contributions till August 2020; (iii) special liquidity scheme for NBFCs/HFCs/MFIs and Partial Credit Guarantee Scheme 2.0 for NBFCs/ HFI/MFIs to inject liquidity; (iv) Tax deducted at source (TDS) and tax collected at source (TCS) reduced by 25 per cent of the existing rates for the remaining period of 2020-21; (v) additional re-finance support for crop loan requirement of rural cooperative banks and RRBs through the National Bank For Agriculture and Rural Development (NABARD); (vi) concessional credit via Kisan Credit Card (KCC) for PM-KISAN beneficiaries, animal husbandry and fishery-dependent persons to inject additional liquidity; and (vii) Interest subvention of 2 percent on MUDRA Shishu loanee; and (viii) scheme to facilitate easy access to credit for street vendors to restart their businesses. III.7 Cyber Security 3.19 Over the years, cyber threats have emerged as a major area of concern in the financial sector, more specifically in the context of banking operations involving critical payment system infrastructure. Several milestones have been accomplished in the area of cyber risk management and developing resilience to such threats. Cyber security preparedness requires continuous and synchronous efforts from multiple stakeholders with varied levels of cyber security preparedness. Some of the recent measures include:
3.20 The banking industry is a target of choice for cyber-attacks. In the post COVID-19 lockdown, there has been an increased incidence of cyber threats. In order to ensure that unconventional, remote working conditions necessitated by the lockdown and adoption of other practices/procedures do not lead to a relaxation of existing cyber security and data protection controls in supervised entities, the RBI has taken several measures. On March 11, 2020, when WHO declared COVID-19 a pandemic, the RBI issued an advisory on March 13, 2020 to all its regulated/supervised entities to inter alia ensure that access to systems is secure and critical services to customers operate without disruption. Since March 2020, the RBI issued more than 10 advisories/alerts to supervised entities on various cyber threats and best practices to be adopted. Some of them were issued in close coordination with Indian Computer Emergency Response Team (CERT-In). A series of video conference meetings were conducted in May 2020 regarding cyber security preparedness and broad cyber/IT threats in order to proactively sensitise the top managements of supervised entities. 3.21 For the financial sector, on a proactive basis, CERT-In is tracking latest cyber threats, analysing threat intelligence from multiple sources and issuing advisories and automated alerts to the Chief Information Security Officers (CISOs) encompassing relevant details so that the financial entities may develop a set of effective practices for responding to and recovery from cyber incidents, while enhancing their respective cyber resilience. CERT-In is enabling the finance sector to deal with cyber attacks by conducting workshops as well as dedicated cyber security exercises and joint cyber security exercises with RBI and IDRBT. CERT-In has carried out 13 exercises for the financial sector till date. III.8 Payment and Settlement Systems 3.22 The RBI continued its efforts to bring in improvements in existing payment systems and implement measures to ensure business continuity in the context of such pandemic situations for extended periods. The major developments with regards to Payment and Settlement Systems since December 2019 are detailed below. III.8.1 Launch of NEFT 24x7x365 3.23 The Reserve Bank’s Payment Systems Vision 2021 aspires to ensure efficient and uninterrupted availability of safe, secure, accessible and affordable payment systems. In pursuance of this vision, the RBI made available in December 2019 the National Electronic Funds Transfer (NEFT) system for round-the-clock fund transfer facility. India joined a select group of nations which offer round-the-clock fund transfer facility, others being Hong Kong, United Kingdom, South Korea, Singapore and China. With this, the general public can use the NEFT system any time of the day/night on all days of the year for transferring funds, purchasing goods / services and making utility bill payments. III.8.2 Business Continuity of Payment Systems 3.24 The COVID-19 pandemic and the resultant lockdown necessitated the triggering of business continuity plans for the smooth running of systemically important and critical payment systems. While the day-to-day operations of the Real Time Gross Settlement (RTGS) and NEFT systems were shifted to the Primary Data Centre to operate under a protected environment, the Clearing Corporation of India Limited, which operates systemically important financial market infrastructure for the money market, government securities and foreign exchange settlements, implemented work-from-home procedures for most of its officials with skeletal staff in the office while keeping ready the on-city-site and remote disaster recovery sites with minimum staff to take over in case of disruption of activities at the primary site. III.8.3 Setting up the Payments Infrastructure Development Fund 3.25 The Payment Systems Vision 2019-21 of the RBI envisaged creation of an Acceptance Development Fund [now, renamed as Payments Infrastructure Development Fund (PIDF)] to subsidise the deployment of point of sale (PoS) acceptance infrastructure. The focus of the PIDF is to increase the acceptance infrastructure (both physical and digital modes) across the country with emphasis on Tier III to Tier VI centres and the north-eastern parts of the country. The RBI has made an initial contribution of ₹250 crores to the corpus of PIDF covering half the fund and remaining contribution will be from card issuing banks and card networks operating in the country. The PIDF will be governed through an Advisory Council and managed and administered by RBI. III.9 Resolution and Recovery 3.26 Since the coming into force of the provisions of the Corporate Insolvency Resolution Process (CIRP) with effect from December 1, 2016, close to 3800 CIRPs had commenced by the end of March 2020 (Tables 3.4 and 3.5). 3.27 Operational creditors (OCs) triggered 49.65 per cent of the CIRPs, followed by 43.61 per cent by financial creditors and the remaining by corporate debtors (CDs) (Table 3.6). 3.28 As regards the status of CIRPs, 34 per cent of the ongoing CIRPs were delayed beyond 270 days, (Table 3.7). 3.29 About 56 per cent of the CIRPs, which were closed, ended in liquidation and 14 per cent ended with resolution plans. It is, however, important to note that 73 per cent of the CIRPs that ended in liquidation (637 out of 879 of which data is available) were earlier with the Board of Industrial and Financial Reconstruction (BIFR) or defunct and the economic value of most of these corporate debtors had already eroded before they were admitted into CIRP (Table 3.8). III.10 Non-Banking Financial Companies 3.30 NBFCs complement banks in extending credit in the economy and they are a vital cog in the wheel for extending last mile credit needs. There were 9,543 NBFCs registered with the RBI as on September 30, 2019 (excluding HFCs), of which 82 were deposit-accepting4 (NBFCs-D) and 274 were systemically important non-deposit accepting NBFCs (NBFCs-ND-SI). As on March 31, 2019, the total assets of NBFCs and HFCs was ₹44.4 lakh crore (NBFCs: 70 per cent; HFCs: 30 per cent), which is approximately one-fourth the size of the assets of the scheduled commercial banks (₹166 lakh crore) (Tables 3.9 and 3.10). 3.31 Following the credit events of 2019, NBFCs with strong governance standards and resilient operating practices remained operational with market access; however smaller NBFCs and MFIs faced constraints and illiquidity, reflecting inherent fragilities rather than a systemic liquidity crunch. Financial markets have been discriminating between strong NBFCs and weaker ones. These developments have brought greater focus on market discipline and asset quality. 3.32 The RBI issued regulatory guidelines on Ind-AS implementation by NBFCs from 2020-21 onwards. NBFCs/ARCs are mandated to follow board approved policies that clearly articulate and document their business models and portfolios, objectives for managing each portfolio, and sound methodologies for computing expected credit losses (ECL). The audit committee of the board (ACB) should approve the classification of accounts that are past due beyond 90 days but not treated as impaired, with the rationale clearly documented. Also, the number of such accounts and the total amount outstanding and the overdue amount should be disclosed in the notes to the financial statements. NBFCs/ARCs also need to maintain asset classifications and compute provisions as per extant prudential norms on Income Recognition, Asset Classification and Provisioning (IRACP). III.11 Mutual Funds 3.33 The mutual fund industry’s assets under management (AUM) fell by 9.2 per cent at the end of March 2020 over its value at the end of September 2019, with AUM of the equity-oriented schemes declining more than their debt counterparts across the top-30 (T-30) and bottom-30 (B-30) cities (Table 3.11). 3.34 Systematic investment plans (SIPs) have been favoured by investors (Table 3.12). 3.35 At the end of April 2020, the number of folios through SIPs increased over March 2020 (Table 3.13). 3.36 On the other hand, there was a net outflow of ₹ 7,384 crore from non-SIP investments as on March 31, 2020. In April 2020, both SIP and non-SIP investments recorded inflows (Table 3.14). III.11.1 Exposure of MFs to Downgraded Corporate Bonds 3.37 While investments in corporate bonds offer higher returns, the risk premium may not be commensurate with the current elevated risk in the corporate bonds market. The exposure of debt oriented mutual fund schemes to corporate bonds rose to 46.9 per cent of total AUM of these schemes at the end of March 2020 from 42.9 per cent at the end of September 2019. The exposure of debt oriented mutual funds to corporate bonds, which have been downgraded, exhibited a steady downward movement in the last 6 months. This exposure was 2.37 per cent at the end of September 2019 which came down to 0.61 per cent in March 2020 and to 0.6 per cent in April 2020 (Chart 3.1). 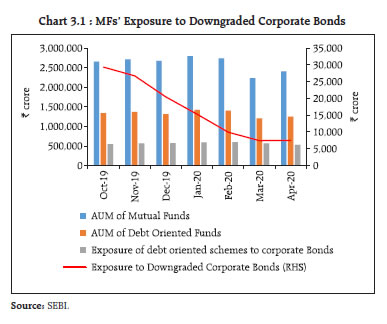 III.11.2 Deployment of Resources by Mutual Funds 3.38 Mutual funds’ total deployment in the equity market in March 2020 (₹ 8,98,472 crore) was sizably lower than in October 2019 (₹ 11,77,565 crore), owing to reduction in value of equities in the wake of extreme uncertainty surrounding COVID-19. However, market conditions and sentiment improved in April 2020 and the equity markets recovered, the with total deployment in the equity market increased in value to ₹ 10,14,909 crore. In the debt segment, MFs’ investments in instruments of maturity of 90 days and less - mostly in commercial paper- dwindled since October 2019 and touched a trough in March 2020. In April 2020, however, there was a turnaround (Chart 3.2). 3.39 Investment in medium and long-term instruments (of maturity of more than 90 days) – corporate bonds are preferred the most, followed by PSU bonds - remained broadly stable, although there has been a slow but steady increase in investments in government securities (Chart 3.3). 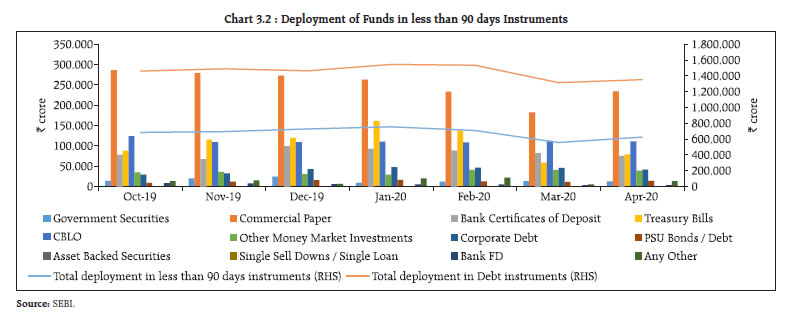 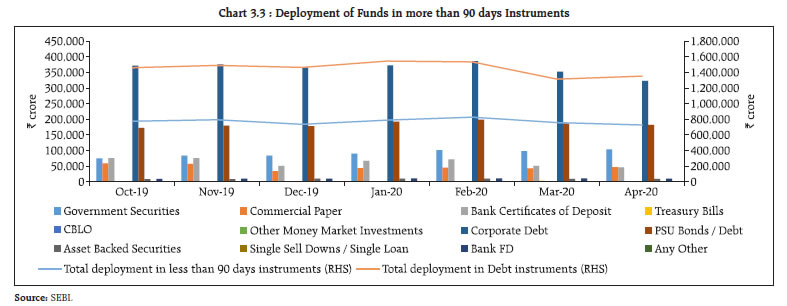 III.12 Capital Mobilisation - Equity and Corporate Bonds 3.40 Total capital raised in primary markets during 2019-20 rose by 11 per cent year-on-year (y-o-y), with ₹ 3.34 lakh crore raised through both equity and debt issues during January-March 2020, despite volatile market conditions (Chart 3.4). 3.41 Within the total funds raised in capital markets during FY 2019-20, the amount raised through equity issues increased by 29.2 per cent mainly due to higher amount raised through public issues, right issues and qualified institutional placements (QIPs), whereas the capital mobilised through debt issues went up by 7 per cent (Chart 3.5 a and b). 3.42 During April 2020, however, both equity and debt issuances went down significantly in terms of numbers and amount in relation to a year ago (Table 3.15). 3.43 During the year, ₹14,984 crore was raised through public issues in the bonds market. ₹ 6.75 lakh crore was raised through private placements of corporate bonds (Chart 3.5b). The major issuers were body corporates and NBFCs, accounting for nearly 55 per cent of the total issuances during the year (Chart 3.6a). Banks and body corporates were the major subscribers during the period (Chart 3.6b and Chart 3.7). 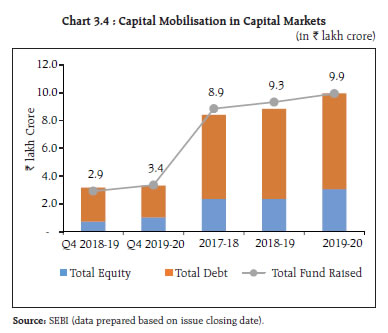 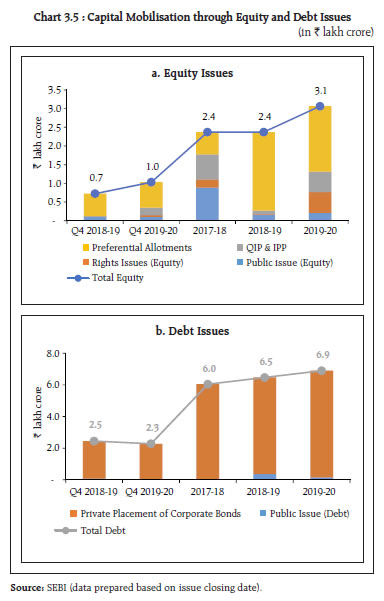 III.13 Credit Ratings (October 2019-March 2020) 3.44 On an aggregate basis there was a y-o-y increase in the share of downgraded/suspended listed companies during quarters ended December 2019 and March 2020. Downgraded/ suspended CARE rated debt issues of listed companies went up to 22 per cent of total rating action during the quarter ended March 2020, the highest in the last 3 years. CRISIL-rated downgrades/suspensions witnessed a spike to 17 per cent in the December 2019 quarter, but they went down to 9 per cent during the quarter ended March 2020 (Chart 3.8). 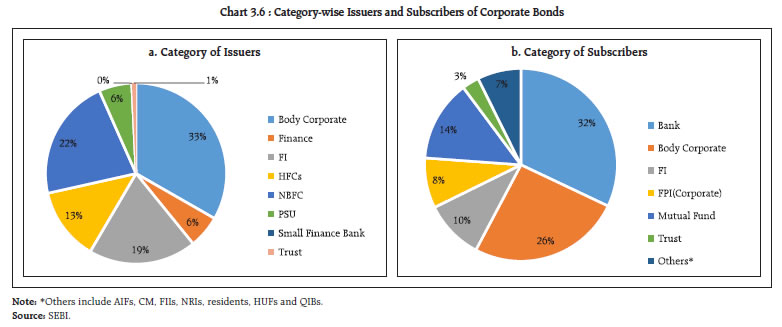 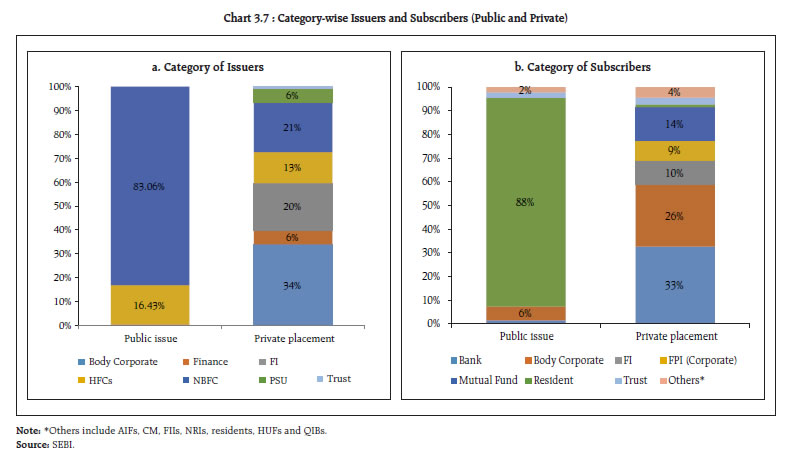 III.14 Commodity Derivatives Market 3.45 COVID-19 is expected to drive down commodity prices in 2020, with energy prices being the most impacted so far. Crude oil prices touched a historic low in April 2020 with April crude oil futures settling at negative levels one day before expiry on supply gluts and technical positioning of oil ETFs, despite the production cuts announced by the Organisation of Petroleum Exporting Countries (OPEC) plus. 3.46 Global base metal prices have also fallen, albeit by a lesser magnitude, pulled down by the prolonged slump in global manufacturing demand. The slowdown in economic activity (particularly in China) and shutting down of mines and refineries across the world disrupted metal supply chains in Q1: 2020. Global uncertainties and safe-haven flows drove gold prices higher in 2020, with some correction in March (Chart 3.9). Commodity prices are expected to trade softer in 2020 than in 2019. The outlook will depend on the effective containment of the pandemic and relaxation of social distancing measures. III.14.1 Domestic Commodity Derivatives Market 3.47 Most of the physical markets across the country were shut post March 20. Although market activity has resumed in most places by end-April, arrivals have been adversely impacted in the peak of physical market supplies for rabi crops (March to May). Wheat, which is the biggest rabi season crop, saw a 65 per cent y-o-y decline in mandi arrivals at an all-India level during April 2020, while mustard (-68 per cent), coriander (-75 per cent), castor (-78 per cent), chana (-82 per cent) and jeera (-83 per cent) were also affected. Closure of markets badly impacted trading on the exchanges as well as ancillary functions such as deposits in warehouses. Traded values across major commodities fell sharply by around 40-60 per cent post the lockdown. 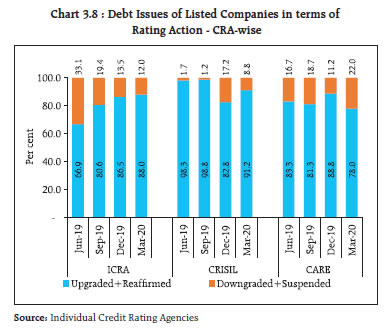 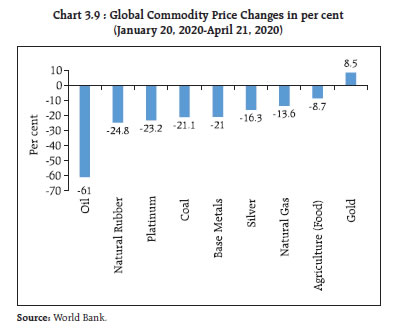 3.48 During 2019-20, the benchmark commodity derivative indices fell sharply - the MCX iCOMDEX composite index declined by 22.9 per cent while the NKrishi index decreased by 6.9 per cent The decline in indices was steeper during the last quarter of 2019-20. While the iCOMDEX bullion index increased marginally by 2.6 per cent during January-March 2020, the iCOMDEX crude oil and iCOMDEX base metal indices declined by 63.3 per cent and 16.0 per cent, Movement in domestic and international commodity futures indices during 2019-20 is shown in Chart 3.10. 3.49 Trading activity in the commodity derivatives segment of the exchanges registered an uptick during the year in terms of total number of derivatives contracts traded (23.3 per cent) and aggregate turnover of all exchanges (25.0 per cent). The turnover of futures contracts increased by 24.1 per cent while that of ‘options on futures’ contracts increased by 61.1 per cent. The aggregate turnover was boosted by the energy and bullion segments (Table 3.16). 3.50 At NCDEX (a leading exchange in agri-derivatives), however, the average daily turnover witnessed a fall from ₹1,488 crore before March 20, 2020 to ₹ 682 crore in the period post March 20, 2020. The open interest on the NCDEX platform fell from around 7.73 lakh units to 4.73 lakh units (around 40 per cent) in the period post March 20, 2020. MCX, which is a leading exchange in non-agri commodity derivatives also saw a similar magnitude of decline in turnover (by 55 per cent); however, the decline in open interest by 7 per cent was lower than on NCDEX. Since the imposition of the lockdown in India, the turnover in all the segments has witnessed a drastic decline (month-on-month) - by 70 per cent in the pan-India turnover in the energy segment in April 2020, by 63.1 per cent and 58.2 per cent, respectively, in the bullion and metal segments, and by 54 per cent in the agri-derivatives segment (Chart 3.11). 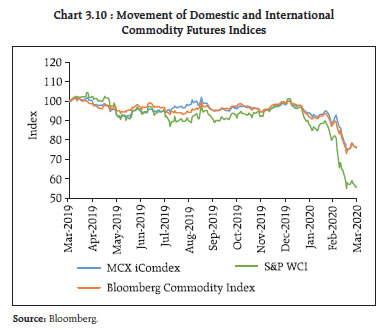 III.15 Insurance 3.51 COVID-19’s impact on the insurance sector may take the form of potential increase in life and health insurance claims, concerns about solvency of insurers due to market volatility, asset-liability mismatches and depressed premium collection and revenues. A prudent regulatory framework, greater supervisory oversight of investments through conservative investment policies and asset valuation methods in the Indian insurance sector limited some of these downside risks. A preliminary study by the Insurance Regulatory and Development Authority of India (IRDAI) shows that all insurers will meet the solvency margin as on March 31, 2020. The IRDAI has issued guidelines to all insurers to put in place effective mechanisms to closely monitor COVID-19 related developments, including its impact on companies’ risks and financials and also to assess possible business disruption in advance and activate business continuity mechanisms. 3.52 Insurers have also been advised to put in place business continuity plans (BCPs) and crisis management committees to monitor the situation on a real-time basis and adopt necessary measures for minimising business disruptions. Crisis management committees have to provide regular inputs to the insurers’ risk management committees, which will evaluate strategic, operational, liquidity, credit, reputational, market and foreign exchange risks, besides the threats stemming from reduction in new business, renewals, capital erosion and claims, which have to be promptly communicated to the regulatory authority. All insurers have been directed to align dividend pay-outs for 2019-20 so as to ensure that they have adequate capital and resources available with them for protecting policyholders’ interests.  3.53 The COVID-19 pandemic has refocused attention on the influence of insurance cover on business solvency (Box 3.2). III.16 Pension Funds 3.54 The National Pension System (NPS) is a voluntary, defined contribution, retirement savings scheme designed to enable subscribers to make optimum decisions regarding their future through systematic savings during their working lives. The corpus accumulated during the working life is utilised for old age income of the NPS subscribers. In response to COVID-19, the PFRDA took several steps for supporting subscribers and intermediaries. 3.55 The Authority included COVID-19 among the critical illnesses eligible for partial withdrawals under the National Pension System (NPS). A request placed for partial withdrawals by the subscriber shall be immediately addressed, towards treatment of illness of self/subscriber, his legally wedded spouse, children (including a legally adopted child) or dependent parents as per the regulations. 3.56 The Atal Pension Yojana (APY) is a defined benefit voluntary pension scheme, with subscribers mostly belonging to the unorganised sections of society suffering the most during lock-down and post lock-down periods. Under the APY scheme, subscribers have to contribute to their pension accounts on a monthly/quarterly/semi-annual basis through an auto debit facility from their savings bank accounts. The Authority took cognisance of the difficulties for subscribers to contribute regularly to the scheme during COVID-19. Hence, it was decided to stop auto-debits from savings accounts for APY contributions till June 30, 2020. Also, APY subscribers would not be charged any penal interest if they regularise their APY accounts by depositing such non-deducted APY contributions along with regular APY contributions between July 1, 2020 and September 30, 2020. 3.57 In addition, the Authority also permitted operational relaxations for easing operational constraints induced by the lockdown as under:
3.58 The National Pension System (NPS) and the Atal Pension Yojana (APY) have shown progress in terms of the total number of subscribers as well as asset under management (AUM)). The number of subscribers in NPS and APY have reached 1.34 crore and 2.11 crore respectively. Assets under Management under NPS and APY have also touched ₹ 4,06,953 crore and ₹ 10,526 crore respectively (Table 3.17). 3.59 The PFRDA continued to work towards financial inclusion of the unorganised sector and low-income groups by expanding coverage under APY. As on March 31, 2020, 403 banks were registered under APY, with the aim of bringing more and more citizens in the pension net. 3.60 Overall, policy authorities have been responding to the COVID-19 pandemic across monetary, liquidity, fiscal and financial regulatory domains to keep the financial system functional and well-oiled, on the one hand and, businesses and households viable and solvent, on the other. However, challenges remain in pandemic-proofing large sections of society, especially those that tend to get excluded in formal financial intermediation, unwinding the stimulus and support packages in a calibrated manner, without disrupting the markets and re-establishing prudential norms in their pre-pandemic stance. 1 Global Financial Stability Report Update, International Monetary Fund, June 2020. 2 Source: Yale Systemic Risk Blog (accessed on April 15, 2020) 3 FSI noted actions relating to operational relief for insurers undertaken by 32 insurance regulators globally including India. 4 Only 22 NBFCs are allowed to accept deposits as they have investment grade ratings. | |||||||||||||||||||||||||||||||||||||||||||||||||||||
ਪੇਜ ਅੰਤਿਮ ਅੱਪਡੇਟ ਦੀ ਤਾਰੀਖ:


