 IST,
IST,


Services and Infrastructure Outlook Survey for Q3:2024-25
|
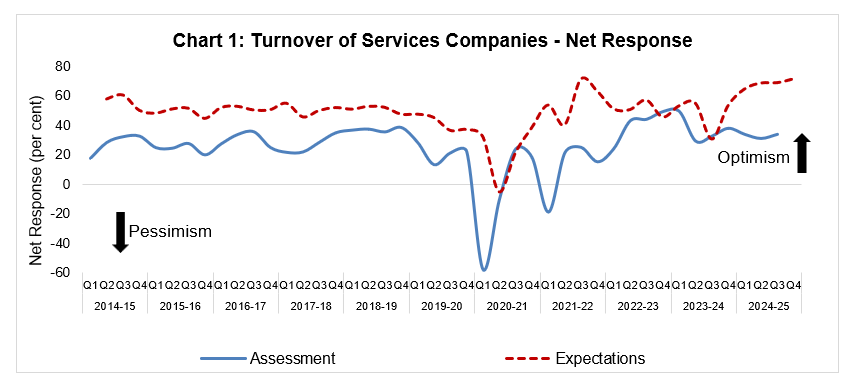
Today, the Reserve Bank released the results of 43rd round of its quarterly Services and Infrastructure Outlook Survey (SIOS) conducted during Q3:2024-25. This forward-looking survey1 captures qualitative assessment and expectations of Indian companies engaged in the services and infrastructure sectors on a set of business parameters relating to demand conditions, price situation and other business conditions. In the latest round of the survey2, 965 companies provided their assessment for Q3:2024-25 and expectations for Q4:2024-25 as well as outlook on key parameters for the subsequent two quarters. Highlights: A. Services Sector Assessment for Q3:2024-25
Expectations for Q4:2024-25
Expectations for Q1:2025-26 and Q2:2025-26
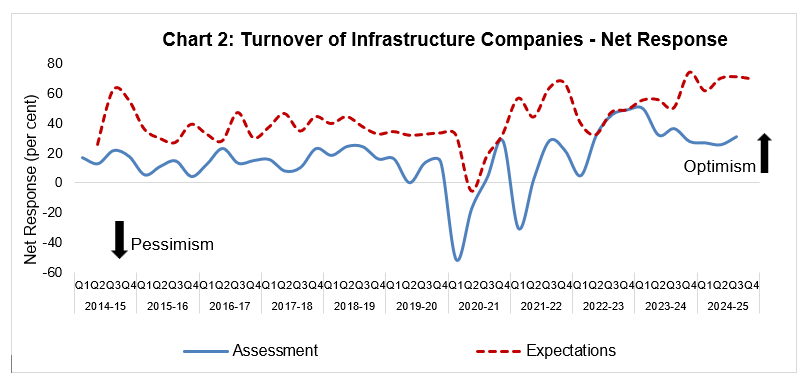
B. Infrastructure Sector Assessment for Q3:2024-25
Expectations for Q4:2024-25
Expectations for Q1:2025-26 and Q2:2025-26
 Summary of Net Responses3 on Survey Parameters Note: Please see the excel file for time series data Services Sector
Infrastructure Sector
1 The survey results reflect the respondents’ views, which are not necessarily shared by the Reserve Bank. 2 Results of the previous survey round were released on the Bank’s website on October 09, 2024. 3 Net Response (NR) is the difference between the percentage of respondents reporting optimism and those reporting pessimism. It ranges between -100 to 100. Positive value indicates expansion/optimism and negative value indicates contraction/pessimism. In other words, NR = (I – D); where, I is the percentage response of ‘Increase/optimism’, D is the percentage response of ‘Decrease/pessimism’ and E is the percentage response as ‘no change/ equal’ (i.e., I+D+E=100). For example, increase in turnover is optimism whereas decrease in cost of inputs is optimism. |
|||||||||||||||||||||||||||||||||||||||||||||||||||||||||||||||||||||||||||||||||||||||||||||||||||||||||||||||||||||||||||||||||||||||||||||||||||||||||||||||||||||||||||||||||||||||||||||||||||||||||||||||||||||||||||||||||||||||||||||||||||||||||||||||||||||||||||||||||||||||||||||||||||||||||||||||||||||||||||||||||||||||||||||||||||||||||||||||||||||||||||||||||||||||||||||||||||||||||||||||||||||||||||||||||||||||||||||||||||||||||||||||||||||||||||||||||||||||||||||||||||||||||||||||||||||||||||||||||||||||||||||||||||||||||||||||||||||||||||||||||||||||||||||||||||||||||||||||||||||||||||||||||||||||||||||||||||||||||||||||||||||||||||||||||||||||||||||||||||||||||||||||||||||||||||||||||||||||||||||||||||||||||||||||||||||||||||||||||||||||||||||||||||||||||||||||||||||||||||||||||||||||||||||||||||||||||||||||||||||||||||||||||||||||||||||||||||||||||||||||||||||||||||||||||||||||||||||||||||||||||||||||||||||||||||||||||||||||||||||||||||||||||||||||||||||||||||||||||||||||

ਇਸ ਪੇਜ ਨੂੰ ਸ਼ੇਅਰ ਕਰੋ:


ਭਾਰਤੀ ਰਿਜ਼ਰਵ ਬੈਂਕ ਮੋਬਾਈਲ ਐਪਲੀਕੇਸ਼ਨ ਇੰਸਟਾਲ ਕਰੋ ਅਤੇ ਨਵੀਨਤਮ ਖਬਰਾਂ ਤੱਕ ਤੇਜ਼ ਐਕਸੈਸ ਪ੍ਰਾਪਤ ਕਰੋ!
ਸਾਡੀ ਐਪ ਇੰਸਟਾਲ ਕਰਨ ਲਈ QR ਕੋਡ ਸਕੈਨ ਕਰੋ।


ਪੇਜ ਅੰਤਿਮ ਅੱਪਡੇਟ ਦੀ ਤਾਰੀਖ:


